Cloud Accounts
This feature is in public beta.
Cloud Accounts lets you connect a cloud provider account to Coralogix, see the resources it contains, and turn on metrics monitoring per service — without writing infrastructure templates or per-service configuration by hand. Use it to start collecting cloud metrics quickly and control which services and regions you monitor.
AWS is the first supported provider, with support for more providers planned. After you connect an account, Coralogix discovers its resources and groups them by service. You then deploy a monitoring configuration to the services you select, at the collection tier you select.
What you need
- An AWS account with permission to create a CloudFormation stack.
- The
INTEGRATIONS:READCONFIGpermission to view the Cloud Accounts page. - The
INTEGRATIONS:DEPLOYpermission to connect accounts and deploy, undeploy, or delete monitoring.
Connect an AWS account
-
Go to Cloud Accounts.
-
Select Add cloud.
-
In step 1, select AWS as the provider.
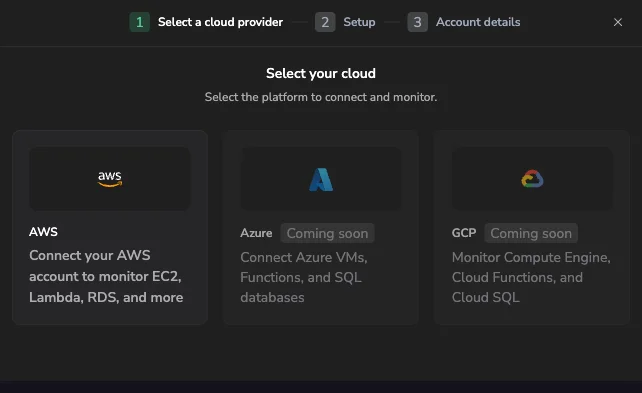
Shows the provider step with AWS available and Azure and GCP coming soon.
-
In step 2, deploy the CloudFormation stack:
- Select Open AWS console to create the stack in AWS, or
- Select Download YAML to deploy the template yourself.
The stack creates the IAM role Coralogix uses to read your AWS resources.

Displays the stack-creation options for the connected AWS account.
-
In step 3, enter the account details, then select Add.
-
Refresh the page to see the connected account.
Review discovered resources
The Cloud Accounts table shows three levels:
- Account — the connected AWS account.
- Service — an AWS service namespace, such as
AWS/EC2orAWS/RDS. - Instance — an individual resource within a service, grouped by resource type.
Each service row shows its status, performance tier, metric count, and the regions where its resources are monitored.
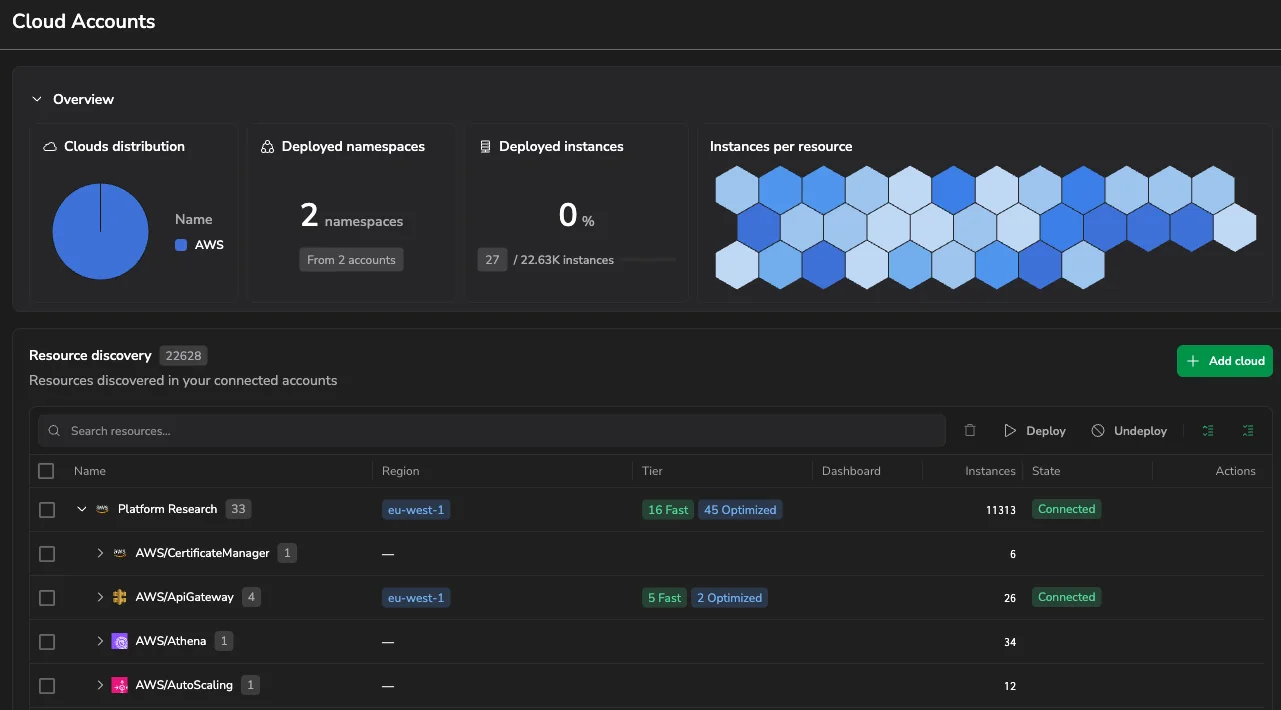
Displays the overview cards and the resource discovery table grouped by account, service, and instance.
Resource discovery can take time after you connect an account.
Deploy monitoring to a service
After discovery, you decide which configurations to deploy. Deploying a configuration starts collecting telemetry data for that cloud resource type. Undeploy deactivates that specific configuration and stops collecting the data, and you can deploy it again at any time.
- In the table, select Deploy on a service row to open the deploy panel.
- Select the regions to monitor. The panel pre-fills the regions where the service's resources were discovered.
- In the metrics table, select the metrics to collect.
- Set the performance tier for the selected metrics. To change several at once, select the rows and use Set performance tier.
- Select Deploy.
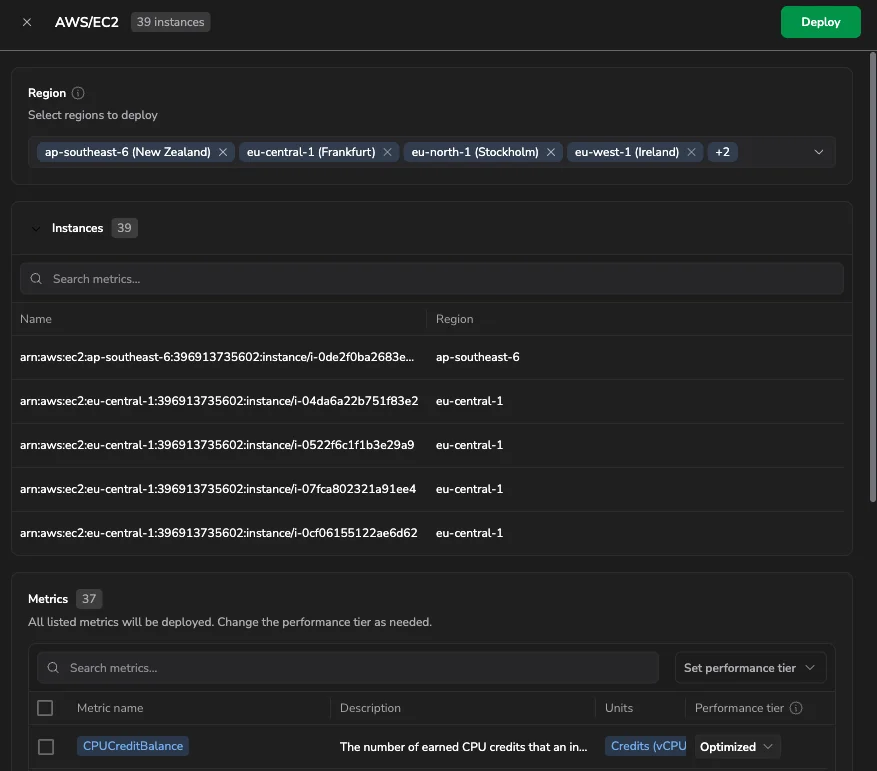
Shows the region selector, instances list, and per-metric performance tier controls in the deploy panel.
Performance tiers
You set a performance tier per metric. The tier controls how the metric is collected.
| Tier | Collection | Latency | Notes |
|---|---|---|---|
| Optimized | Amazon CloudWatch polling | Up to 10 minutes | Cost-optimized. Near-instant to deploy. |
| Fast | CloudWatch Metric Streams (Amazon Data Firehose) | Real-time, no delay | Slower to deploy — provisions AWS streaming resources. |
| Disabled | Not collected | — | The metric is not collected for the service. |
Each active tier adds cost in your own AWS account, driven by how it collects metrics. Optimized polls Amazon CloudWatch on a schedule, which keeps AWS cost low and deploys almost instantly. Fast collects in real time through the AWS streaming resources it provisions, so it carries higher AWS cost and takes longer to deploy.
Search and re-tier metrics in bulk: select rows in the metrics table, then use Set performance tier.
Deploy, undeploy, or delete in bulk
Act on several services at once:
- Select the checkbox on one or more service rows. Selecting an account row selects all of its services.
- Select Deploy, Undeploy, or Delete in the toolbar:
- Deploy — turns on monitoring for selected services that aren't monitored yet.
- Undeploy — turns monitoring off. The configuration stays listed so you can re-deploy later; services already in that state are skipped.
- Delete — available for accounts. Removes the account (or its monitoring configuration). This action cannot be undone.
- Review the confirmation dialog box — it lists each selected resource with its status, tiers, metric count, and regions.
- Select the action to confirm.

Displays the confirmation summary for a bulk deploy, with one row per selected resource.
For a service that isn't monitored yet, a bulk Deploy applies recommended defaults: each metric uses its recommended collection mode (tier), and monitoring is deployed to the regions where that service's resources were discovered. A service with no discoverable region is skipped. Adjust tiers and regions per service in the deploy panel before deploying individually.
Control what you collect
How much you monitor — and the AWS and Coralogix cost that comes with it — is set by what you deploy. Narrow collection to what you need:
- Deploy only the services you need. Discovered services aren't monitored until you deploy them.
- Limit regions. In the deploy panel, monitor only the regions you care about instead of every region where a resource was discovered.
- Select specific metrics. Deploy only the metrics you need per service rather than the full set.
- Prefer the Optimized tier for metrics that don't need real-time latency — it's the lower-cost collection mode.
- Undeploy what you no longer need. Undeploy keeps the configuration listed, so you can re-deploy later without losing your selections.
Expected results
- Connected accounts appear in the Cloud Accounts table with their discovered services.
- Deployed services show an active status and the tier you set.
- Coralogix begins collecting the selected metrics for the selected regions.
Troubleshooting
- The account doesn't appear after I add it. Refresh the page.
- Deploy is slow. A full deploy creates AWS resources and takes longer. Use the Optimized tier for a faster deploy.
- A service shows no regions. Regions are derived from the resources discovered in the account. If none are discovered for a service, no region is shown, and a bulk deploy skips that service — deploy it individually and select regions in the deploy panel.
- Permission error mentions
AWS Organizations Service Control Policy (SCP). In AWS Organizations, update the service control policy attached to the account, organizational unit, or root so it allows the AWS permission shown in the error. A service control policy block overrides the IAM role permissions created from the CloudFormation template.
Related resources
- AWS CloudWatch metrics — the CloudWatch-polling integration behind the Optimized tier.