Azure metrics
Collect metrics from your Azure subscriptions using the Azure Monitor REST API and route them to Coralogix for dashboards, alerts, and Infrastructure Explorer correlation.
Overview
Azure Monitor serves as the observability core within the Azure Cloud ecosystem. It plays a pivotal role by aggregating data from diverse origins, encompassing logs and metrics derived from Azure infrastructure and resources, custom applications, and agents running on virtual machines.
Azure metrics are retrieved from Azure using the Azure Monitor REST API, a widely used API service that allows customers to gain insights into Azure resources.
To collect metrics, the integration must authenticate as an Azure service principal that has the Monitoring Reader role on each subscription you want to monitor.
Virtual machine and scale set instance metrics
Starting with version 1.9.0, the integration enriches metrics for Azure Virtual Machines and Virtual Machine Scale Set instances with a host.id attribute containing the Azure VM ID. This attribute lets you correlate Azure metrics with the corresponding VM in the Azure Infrastructure Explorer.
Microsoft.Compute/virtualMachineScaleSets and Microsoft.Compute/virtualMachineScaleSets/virtualMachines are independent namespaces in the resource type filter. To collect per-instance metrics with host.id enrichment, add Microsoft.Compute/virtualMachineScaleSets/virtualMachines explicitly — selecting the parent scale set namespace alone does not trigger per-instance collection.
Supported metrics aggregations
This integration does not fetch the full set of metric aggregation types. Only the following aggregations are supported:
MinimumMaximumAverageTotalCount
Authentication methods
The integration supports two authentication methods:
-
App Registration with Client Secret: you create an Azure app registration in your tenant and provide its client credentials to Coralogix.
-
Multi-Tenant App Registration: you authorize the application provided by Coralogix to access your Azure tenant. This method eliminates the need for static credentials and is available starting from version 1.3.0.
| Topic | Client Credentials | Multi-Tenant App |
|---|---|---|
| What you create in Azure | An App registration in your tenant | No customer-managed app registration is required |
Tenant ID value in Coralogix | Azure Directory (tenant) ID from Microsoft Entra ID > Overview | Azure Directory (tenant) ID from Microsoft Entra ID > Overview |
Client ID and Client Secret | Required | Not required |
| Who completes authorization | A user who can create and configure the app registration and assign subscription IAM roles | A user who can grant tenant consent in Entra and assign subscription IAM roles |
Which identity gets Monitoring Reader | The service principal for your Azure app registration | The enterprise application / service principal created for the Coralogix app after authorization |
| How to verify setup | Confirm the app service principal has Monitoring Reader under subscription Access Control (IAM) | Confirm the Coralogix enterprise application exists under Enterprise applications, then confirm it has Monitoring Reader under subscription Access Control (IAM) |
What you need
- Azure Monitor must be enabled on your instance
Required permissions
- Client Credentials app registration permissions: The Client Credentials flow requires a user who can create and configure an Azure app registration in the target tenant, generate a client secret, and identify the corresponding service principal for role assignment.
- Microsoft Entra authorization permissions: The Multi-Tenant App flow typically requires an Entra admin role such as Cloud Application Administrator or Application Administrator to complete the Authorize step. The exact requirement can vary based on your tenant's consent policy.
- Azure subscription IAM permissions: Assigning Monitoring Reader requires permission to create role assignments at the subscription scope, such as User Access Administrator, Role Based Access Control Administrator, or an equivalent role with
Microsoft.Authorization/roleAssignments/write. - Plain user accounts: A user with only the default User role in Entra may be blocked from granting consent to the Coralogix application.
Select an authentication flow
Pick the setup path that matches your Azure authentication model:
- Client Credentials: Create an app registration in your Azure tenant and provide its client credentials to Coralogix.
- Multi-Tenant App: Authorize the Coralogix application in your Azure tenant without creating your own app registration.
Azure Metrics integration deployment
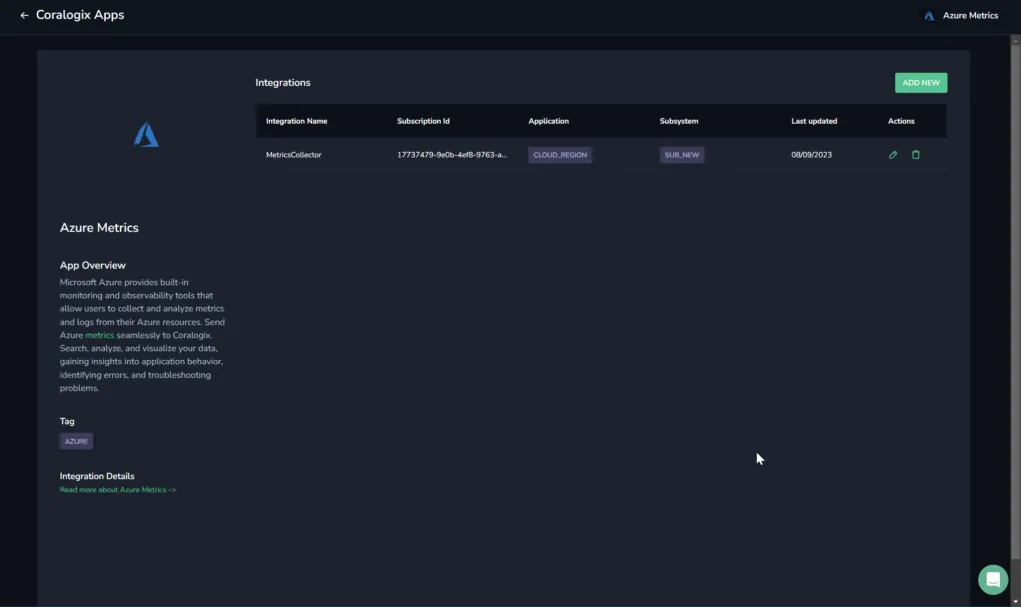
STEP 1. Access Data Flow, then Integrations.
STEP 2. From the Integrations section, select Azure Metrics.
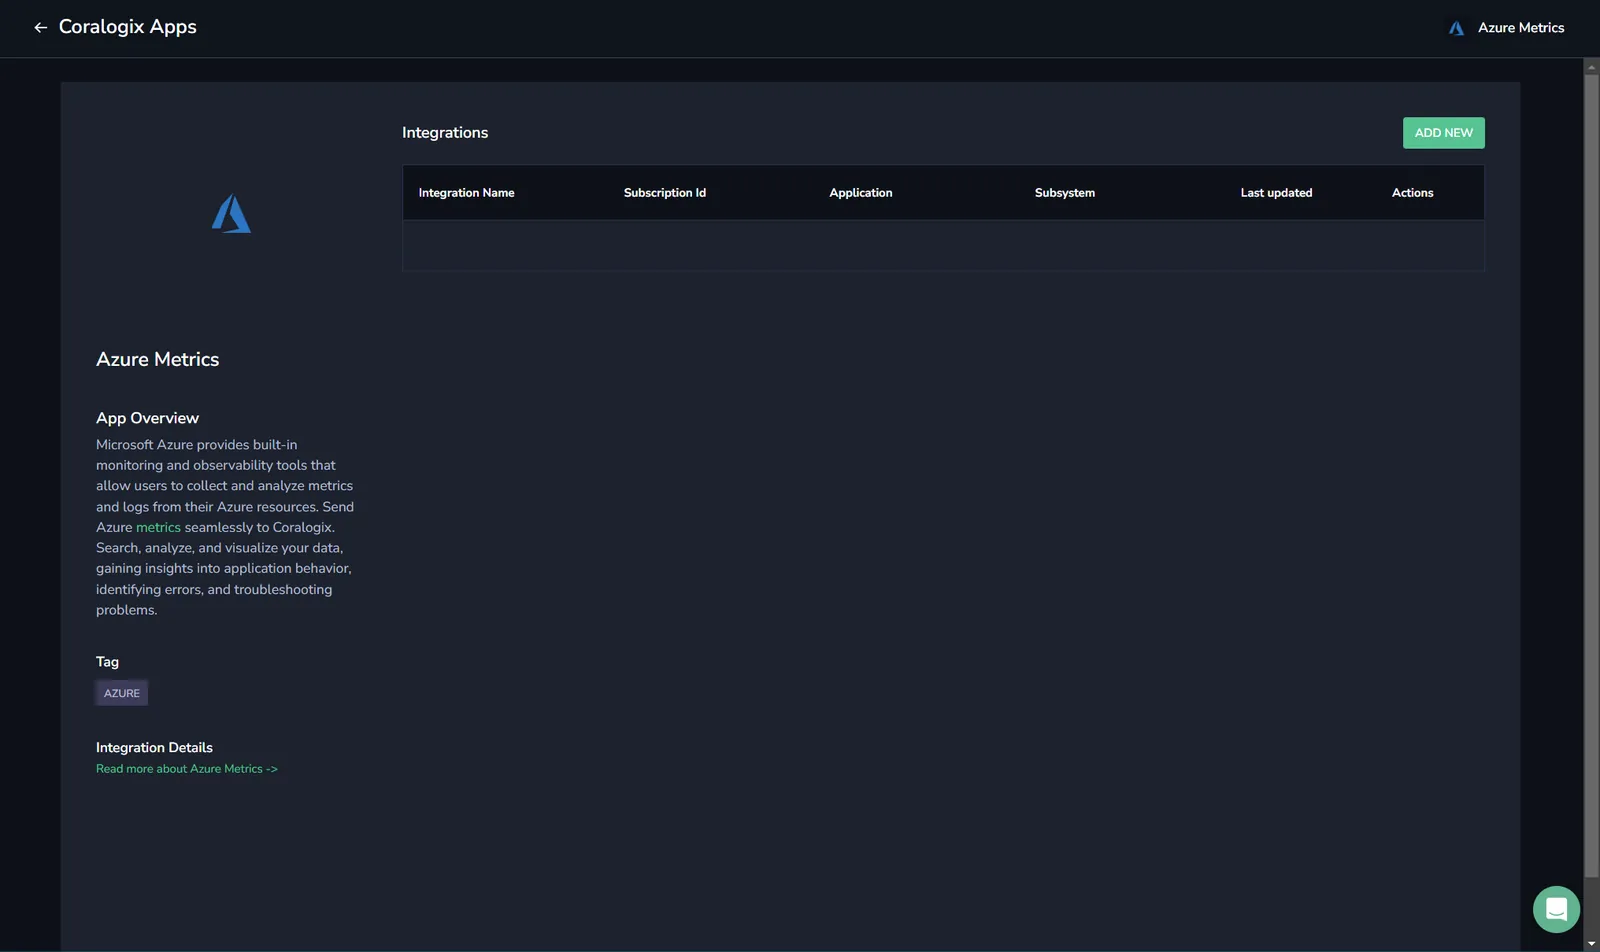
STEP 3. Select ADD NEW.
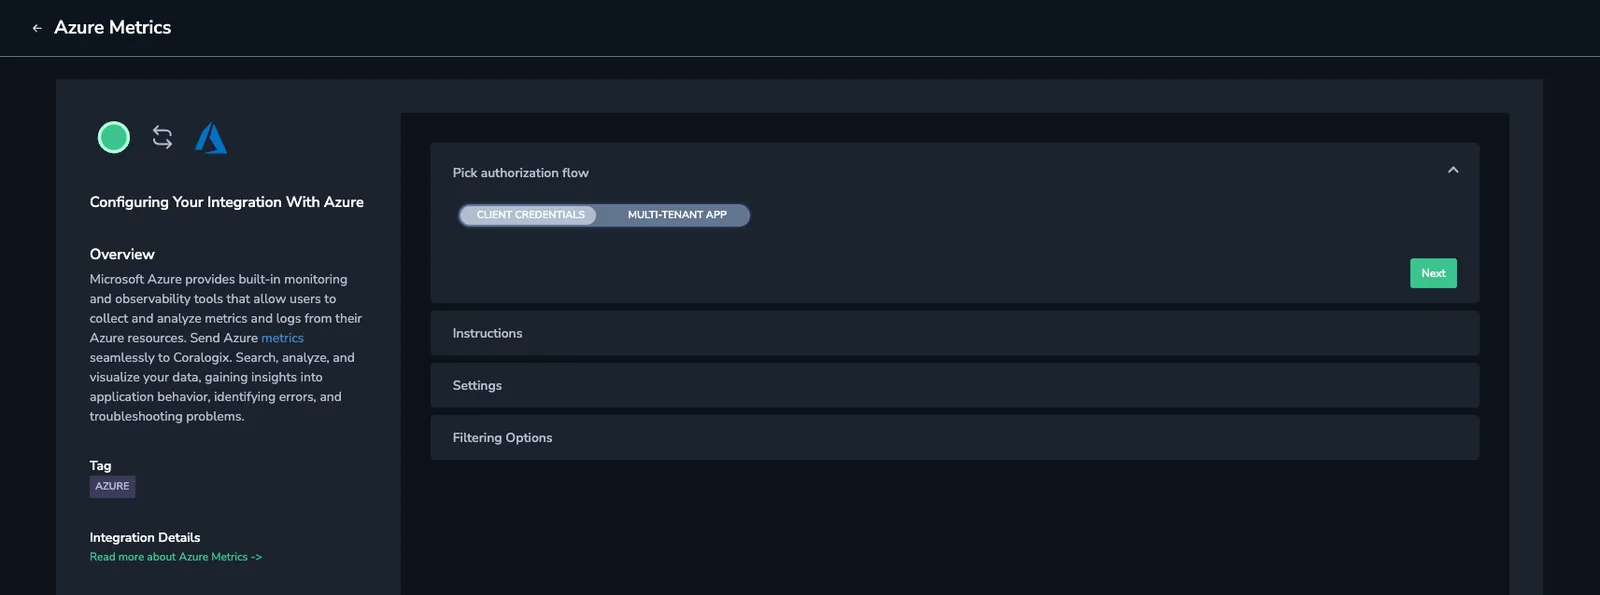 STEP 4. Pick authentication flow: CLIENT CREDENTIALS/MULTI-TENANT APP.
Use the flow-specific step that applies to you:
Client Credentials only
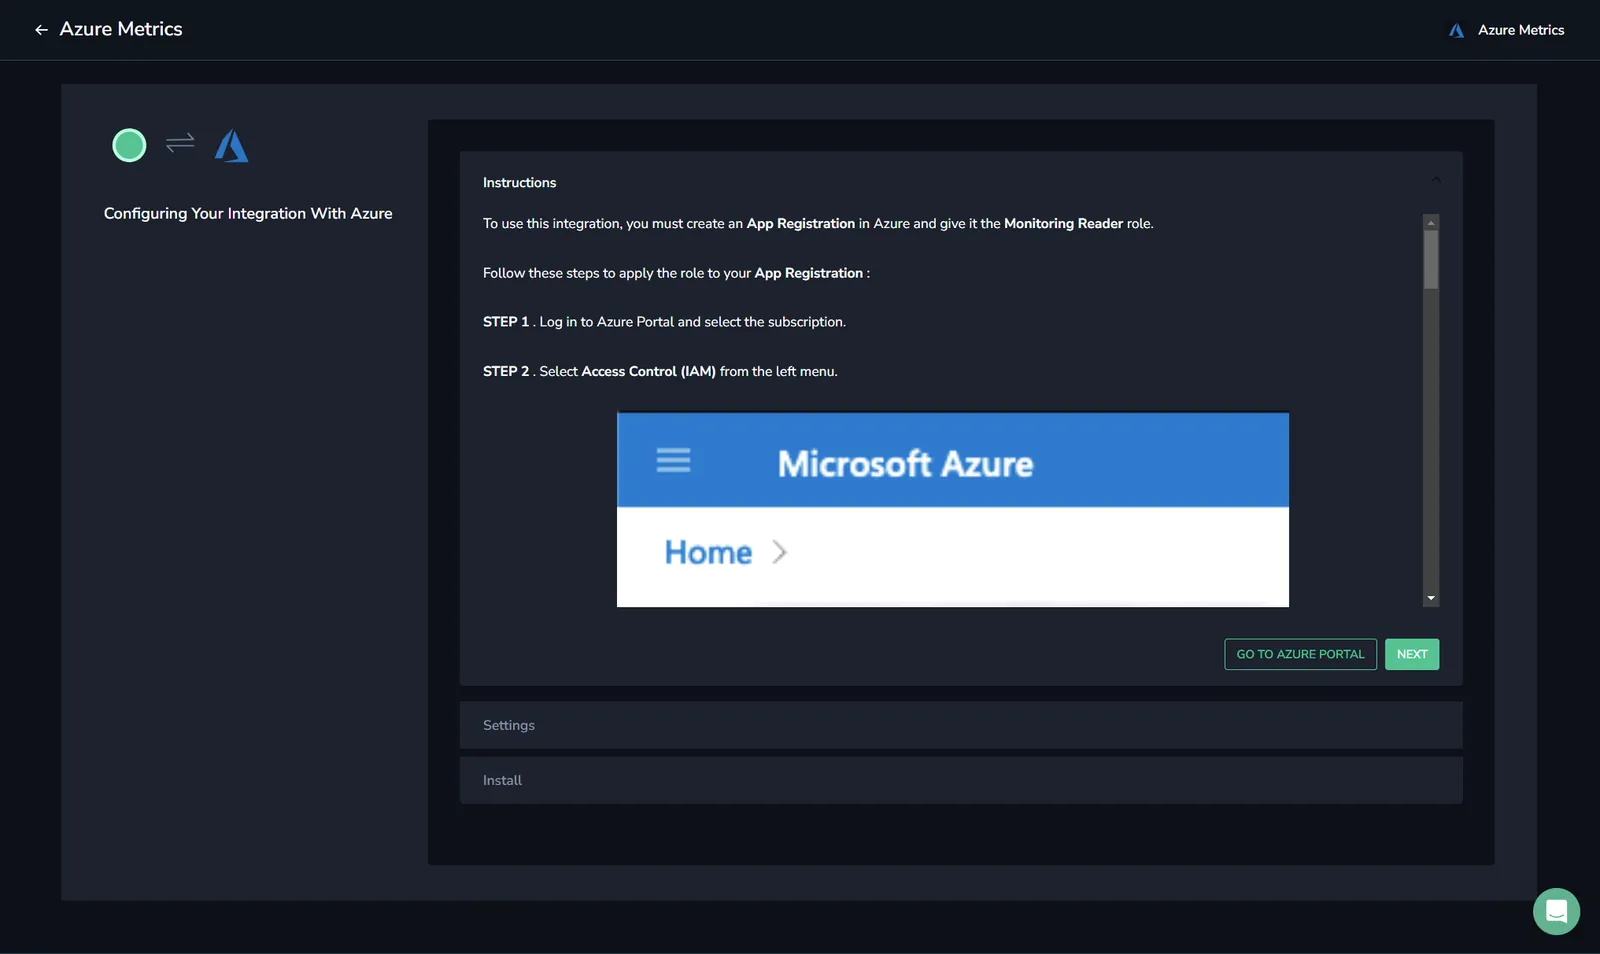
STEP 5. If you chose Client Credentials and do not already have an Azure app registration for this integration, select GO TO AZURE PORTAL and complete the following steps:
-
STEP 5.1. Go to App registrations.
-
STEP 5.2. Select New registration, enter a name, select Accounts in this organizational directory only (Single tenant), and select Register.
-
STEP 5.3. Open the new registration and copy:
- the Directory (tenant) ID from Overview
- the Application (client) ID from Overview
-
STEP 5.4. Go to Certificates & secrets, then Client secrets, select New client secret, and save the generated secret value for the next steps.
If you want to collect metrics from more than one subscription, you do not need multiple app registrations. Reuse the same application and assign it the required permissions in each subscription separately.
Common settings
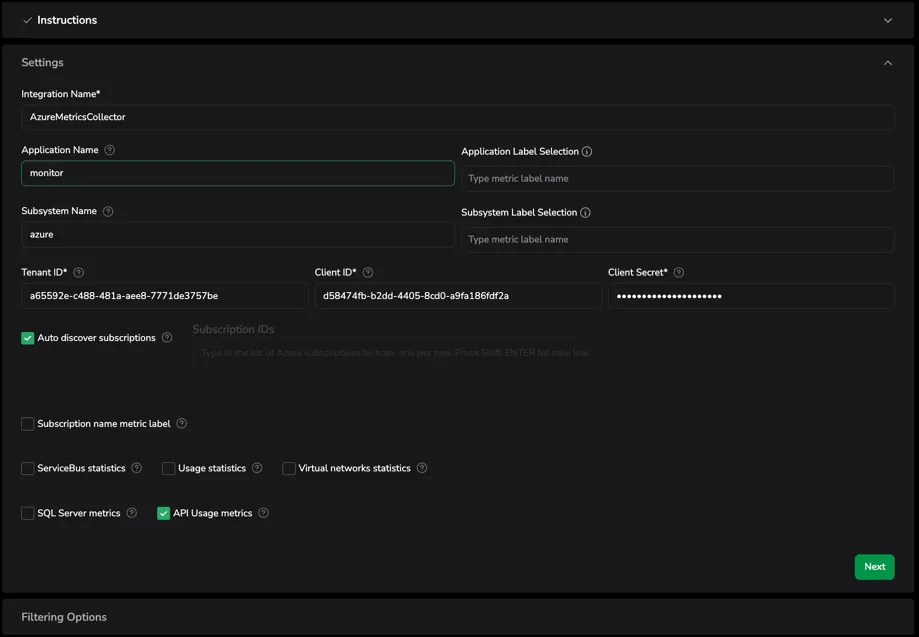
STEP 6. Return to the Coralogix Azure Metrics integration tab and define your Settings.
-
Integration Name: A name for your integration (auto-filled with the default name).
-
Application Name: [Optional] Application name, if present, will be the value of the "application name" label of every collected metric (auto-filled with the default name).
-
Application Label Selection: [Optional] Select labels that will be used to create the application name. The first label value that matches a metric label will be used as the application name.
-
Subsystem Name: [Optional] The name of the subsystem for your application (auto-filled with the default name).
-
Subsystem Label Selection: [Optional] Select labels that will be used to create the subsystem name. The first label value that matches a metric label will be used as the subsystem name.
-
Tenant ID: Enter the Azure Directory (tenant) ID from Microsoft Entra ID > Overview.
-
Client ID:
- Client Credentials: Enter the Application (client) ID from the Azure app registration.
- Multi-Tenant App: Leave this blank.
-
Client Secret:
- Client Credentials: Enter the client secret value from Certificates & secrets.
- Multi-Tenant App: Leave this blank.
-
Subscription IDs: Either check Auto Discover Subscriptions or enter one or more subscription IDs. The integration identity must have access to every manually entered subscription. Enter one subscription ID per line. Use SHIFT+Enter to move to the next line.
-
Subscription name metric label: If checked, all metrics will have label
subscription_namecontaining the subscription name. This is different from the subscription ID, which is always added ascloud_account_id. -
If needed, select the ServiceBus statistics, Usage statistics, Virtual networks statistics, SQL Server metrics and/or API Usage metrics checkboxes to create metrics from:
STEP 7. Select NEXT.
Common filtering and metric namespace selection
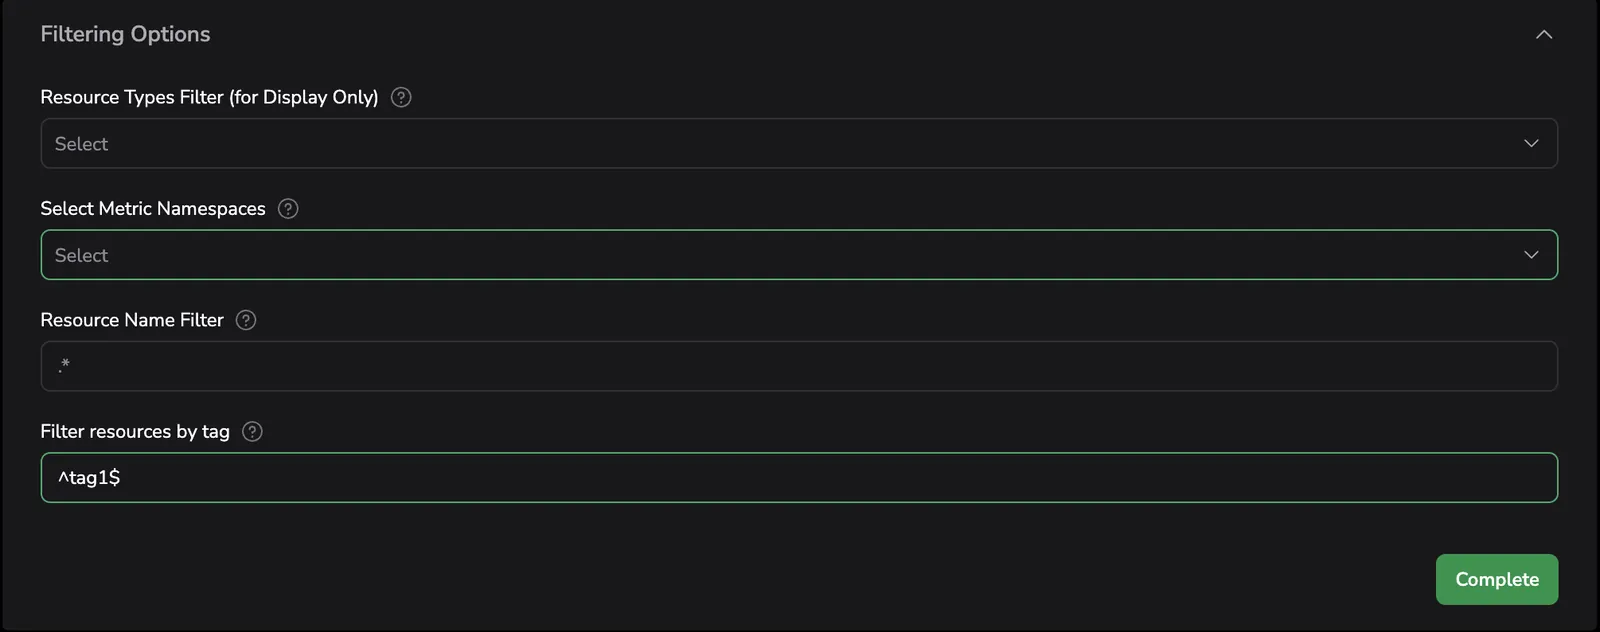
STEP 8. Define Filtering Options.
-
Resource Types Filter / Select Metric Namespace: Select resource types from the dropdown list to filter the list of metric namespaces shown in the next step. If none are selected, all metric namespaces will be available.
-
Resource Name Filter: Specify a Regular Expression (RegEx) to filter by Azure resource name.
-
Filter Resources by Tag: Specify a comma-separated list of conditions in the
tagortag:regexform. If only a tag is given, resources having this tag will match the condition. If a RegEx is given, the tag value must match the RegEx. Each condition can be inverted by prepending a!. Metrics will be collected only for the resources matching all conditions. Example:env:(?)^prod$, !testing
STEP 9. Select from the dropdown list which Metric Namespaces to bring into Coralogix. If none are selected, all metric namespaces will be brought in.
Multi-Tenant App only
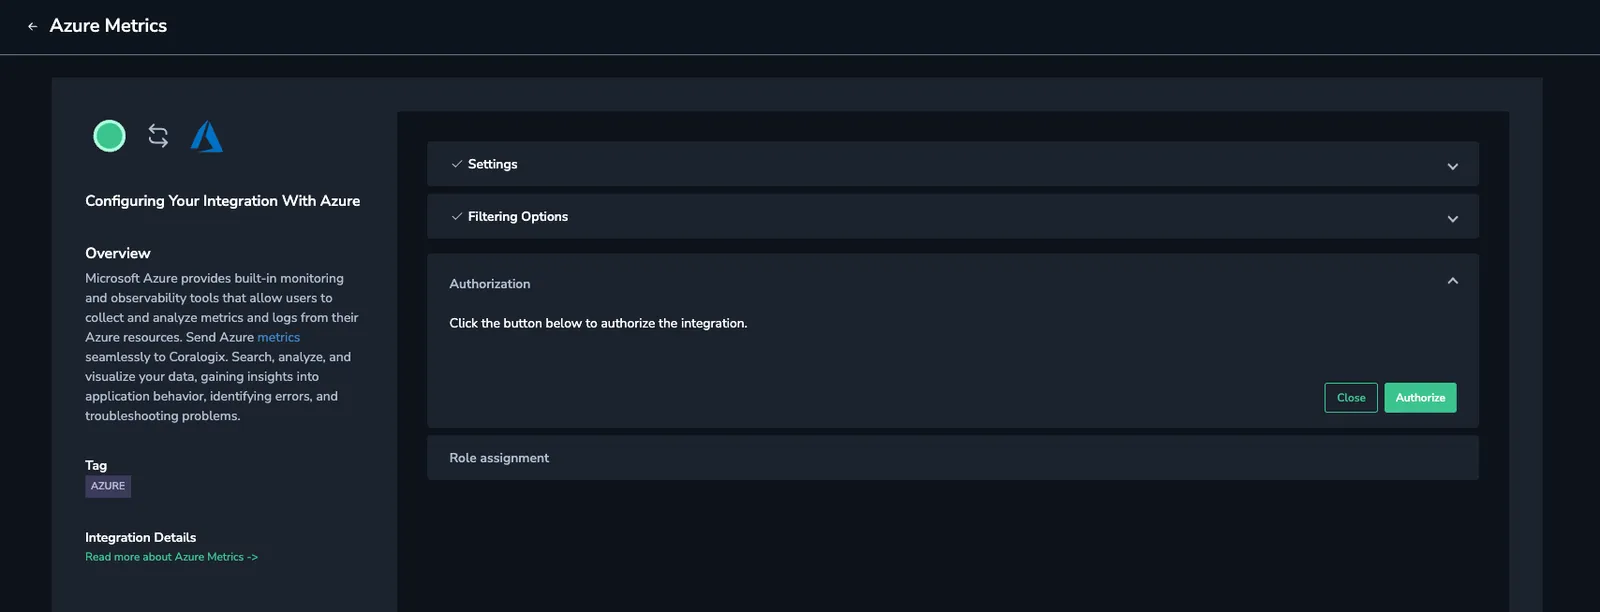
STEP 10. If you chose Multi-Tenant App, select Authorize in Coralogix. Review the Microsoft authorization screen and select Accept.
The Authorize action starts in Coralogix, not in Azure. A successful authorization creates or provisions the Coralogix enterprise application / service principal in your tenant.
Assign Monitoring Reader
STEP 11. Assign the Monitoring Reader role to the correct service principal:
-
Client Credentials: Select the service principal associated with your Azure app registration.
-
Multi-Tenant App: Select the Coralogix enterprise application / service principal created after Authorize.
-
STEP 11.1. Log in to Azure Portal and select the subscription. Version 1.5.0 and higher support multiple subscriptions. If you want to collect metrics from multiple subscriptions from one integration, repeat the following steps for every subscription.
-
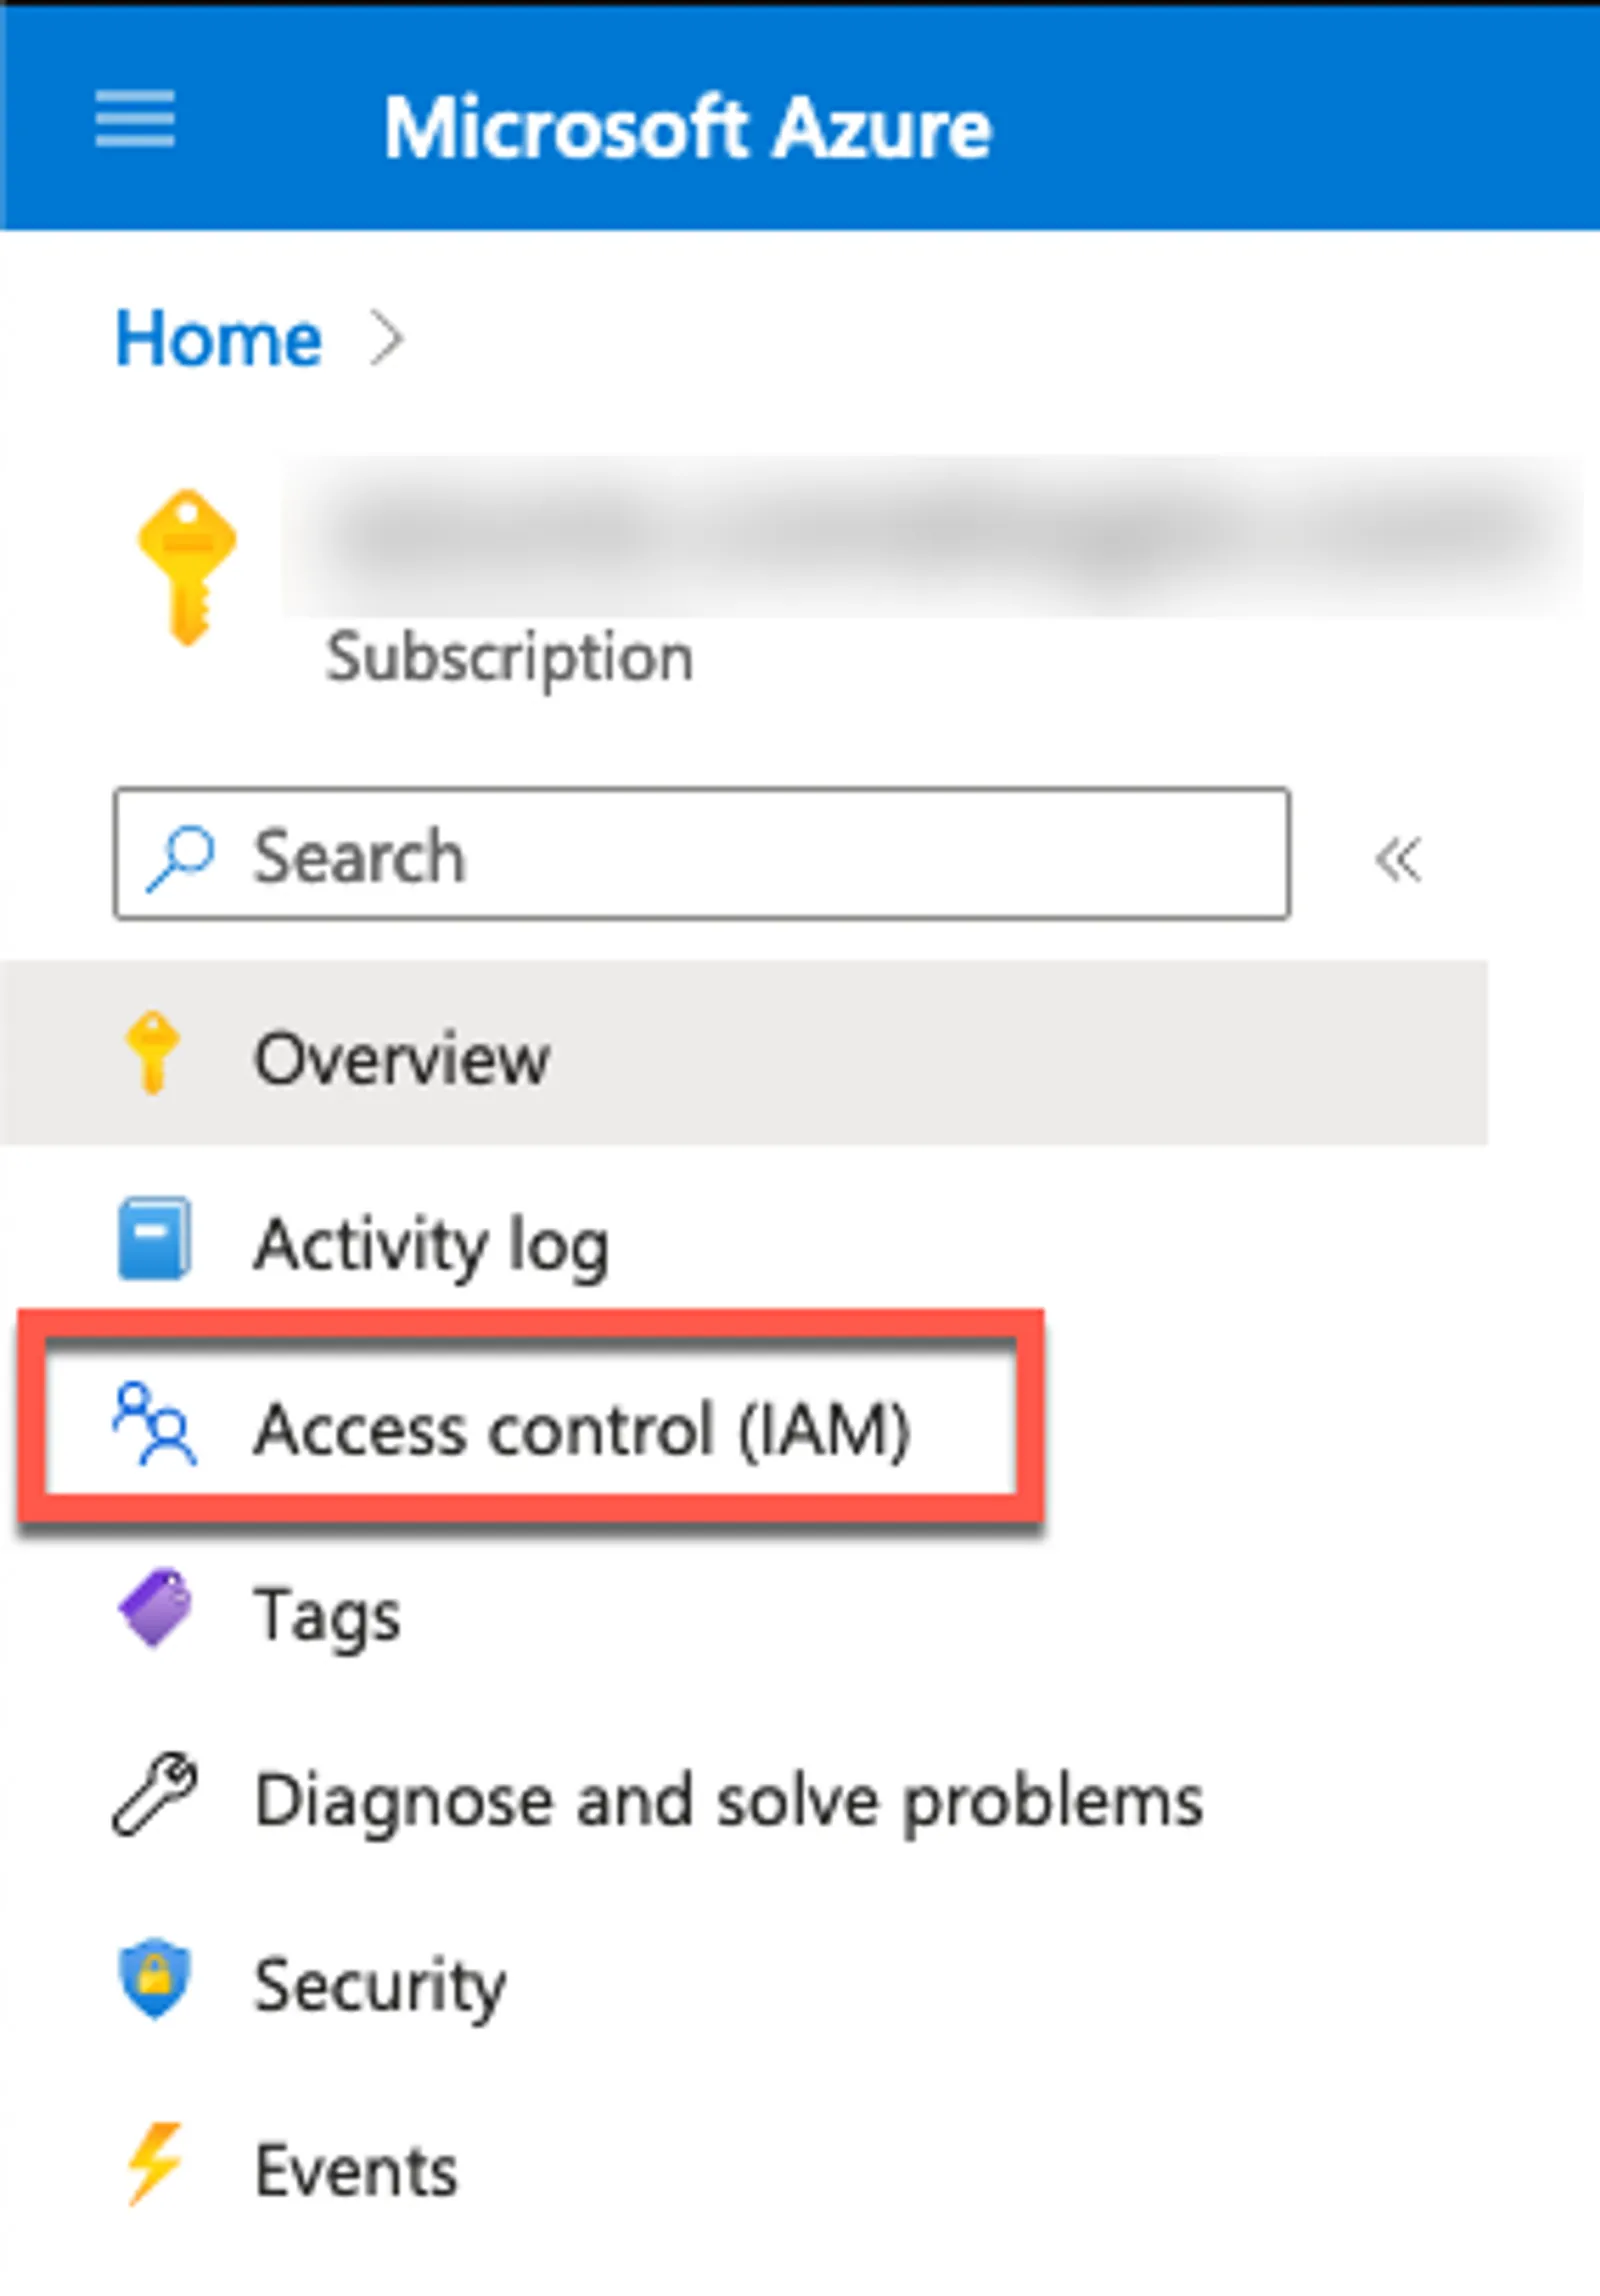
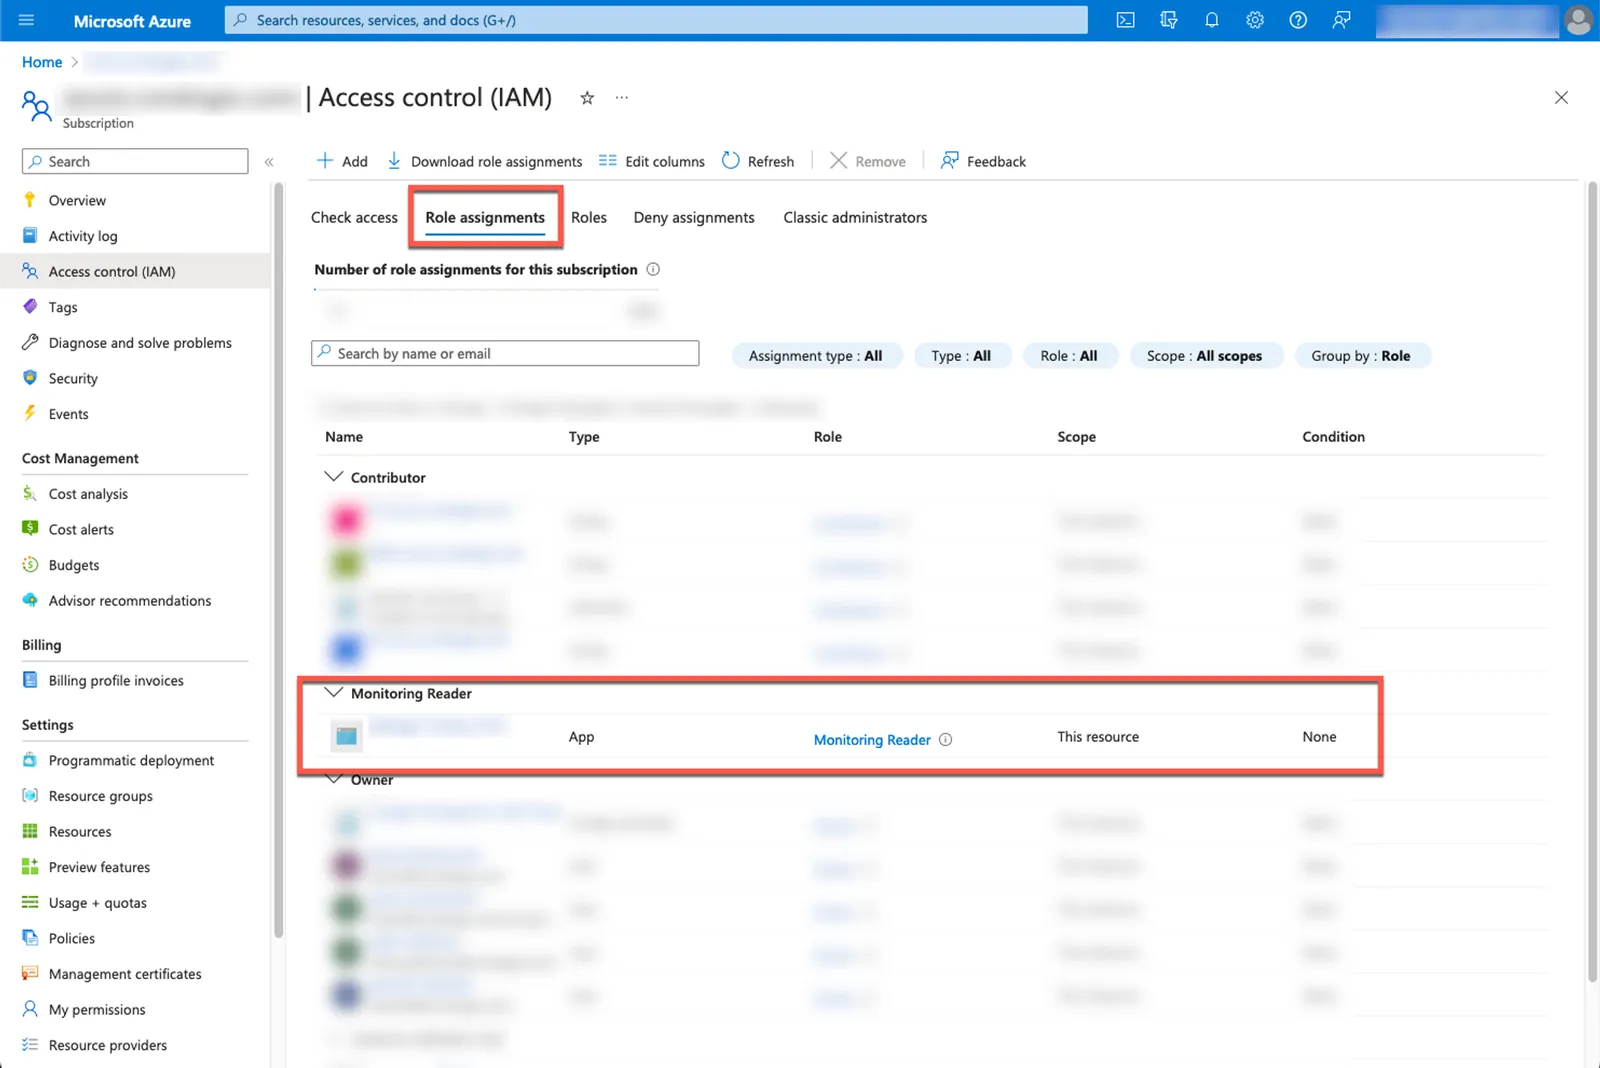
STEP 11.2. Select Access Control (IAM) from the left menu.
-
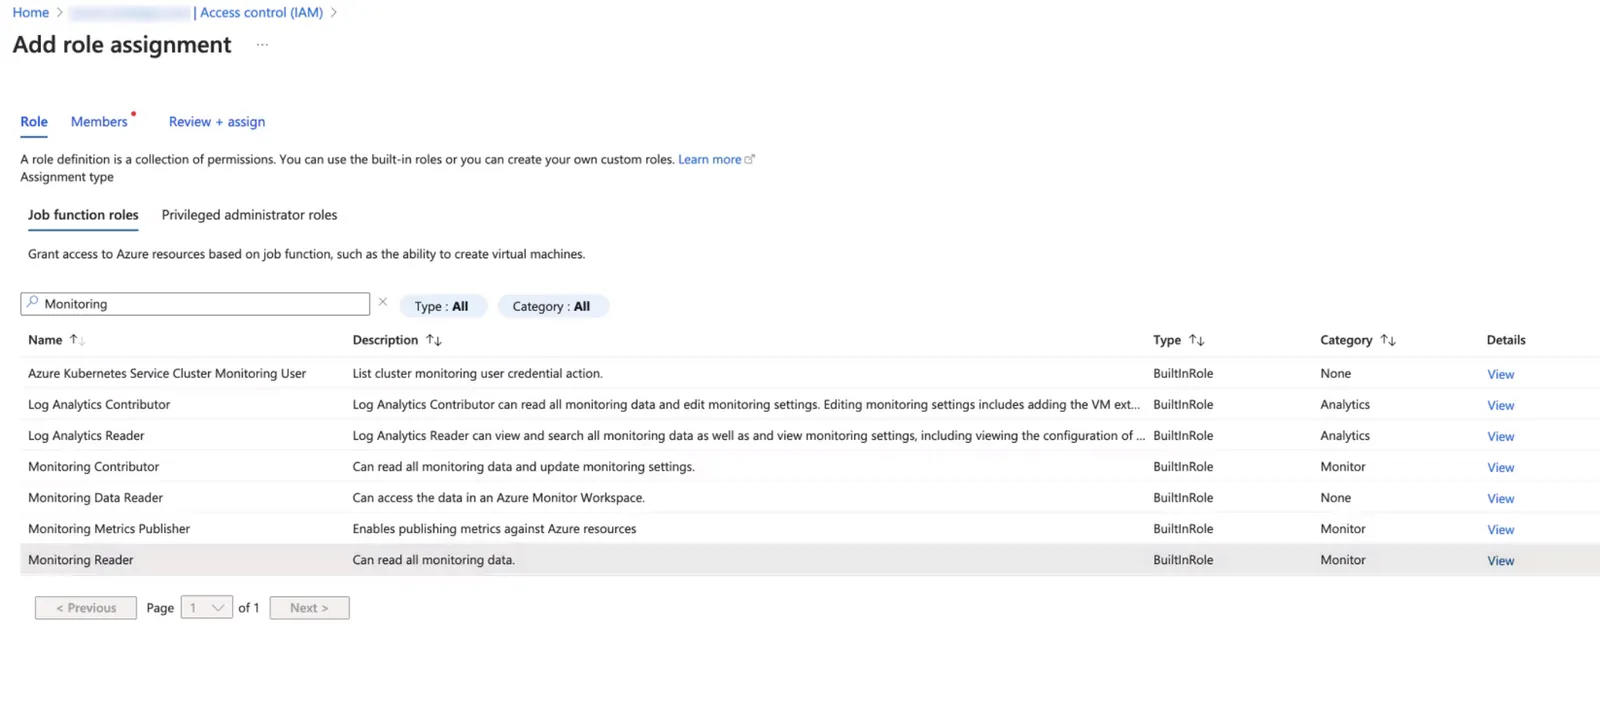
STEP 11.3. Select Add role assignment from the top-left + Add button in the Access Control panel.
-
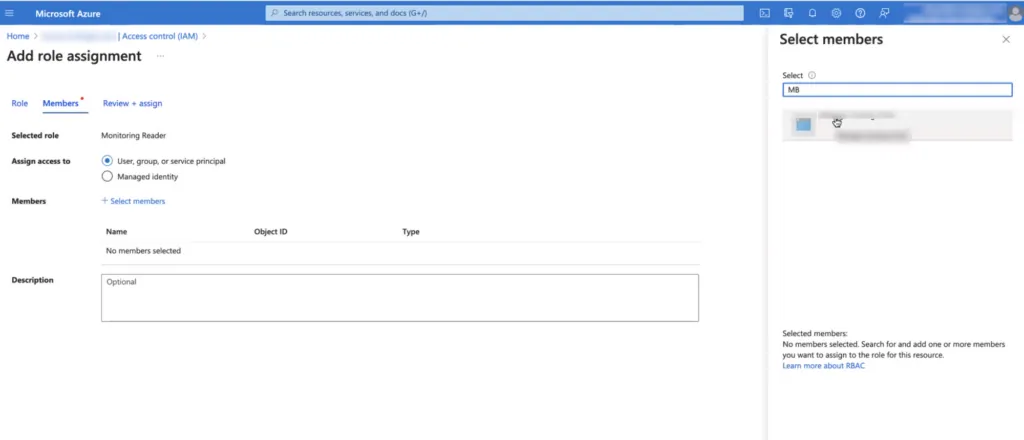
STEP 11.4. In the Add role assignment panel, search for Monitoring Reader and select it.
-
STEP 11.5. Under Members, select User, group, or service principal and then select + Select members.
-
STEP 11.6. Search for the correct target for your flow:
- Client Credentials: The service principal that belongs to your Azure app registration.
- Multi-Tenant App: The Coralogix enterprise application / service principal created after Authorize.
After review and assignment, you should see the selected service principal with Monitoring Reader permissions under the Role Assignments tab.
STEP 12. Select Complete.
Verify the setup
- In Microsoft Entra ID > Enterprise applications, confirm that the Coralogix enterprise application exists after a successful Multi-Tenant App authorization.
- In the target subscription, open Access Control (IAM) and confirm the correct service principal has the Monitoring Reader role.
- If you collect metrics from more than one subscription, repeat the IAM role assignment for each subscription.
Troubleshooting authorization failures
If Authorize fails with an error such as AADSTS700016, the most common causes are:
- the wrong Tenant ID was entered
- the Coralogix application has not yet been consented to in that tenant
- the signed-in user does not have permission to grant consent
Verify that the Tenant ID is the Azure Directory (tenant) ID, have an Entra admin complete Authorize, and confirm that the Coralogix enterprise application appears in Enterprise applications before assigning Monitoring Reader.
Limitations
Important: Azure metrics are subject to a platform-level behavior occurring daily at 2:00 AM UTC, where Azure Monitor may reset or drop specific time series.
- Sequential Processing & Data Gaps: The Coralogix integration scrapes Azure metrics in a continuous, linear sequence. If Azure drops a time series, it will not reappear in Coralogix until that time series becomes active again and a new data point is generated.
- Lack of Retrospective Backfilling: While Azure may retroactively populate these gaps with "default" values when queried via the Azure portal at a later time, the integration does not re-query historical time windows once they have been processed. This ensures optimal performance and prevents unnecessary API cost overhead.
- Impact on Observability: Users may observe a temporary data gap in dashboards or alerts starting at 2:00 AM UTC. The duration of this gap depends on when the specific time series next generates data.
This behavior is a result of native data handling within the Azure Metrics API and the sequential nature of metrics ingestion.
Example Scenario
Consider the metric azure_microsoft_cognitive_services_accounts_azure_open_ai_availability_rate_avg. A specific time series for this metric with the label metadata_modelname="gpt-4o-mini" is dropped by Azure at 2:00 AM UTC.
- The time series does not send new data until the model is used again at 3:56 AM UTC.
- Coralogix, having already queried the 2:00 AM – 3:55 AM window sequentially, will show a gap for that specific
gpt-4o-minitime series. - Even if Azure retroactively fills that 2-hour gap with "default" values in their own portal later, Coralogix will not re-ingest that historical window, and the gap will remain in your Coralogix dashboards.