GCP metrics
Overview
Google Cloud Platform provides built-in monitoring and observability tools that allow users to collect and analyze metrics from their GCP resources. Send Google Cloud metrics seamlessly to Coralogix. Search, analyze, and visualize your data, gaining insights into application behavior, identifying errors, and troubleshooting problems.
Prerequisites
Configure a service account to facilitate automated intermediation.
Setup
An integration must be created to start collecting metrics for a GCP project.
STEP 1. Access Data Flow > Extensions.
STEP 2. From the Integrations section, select GCP Metrics.
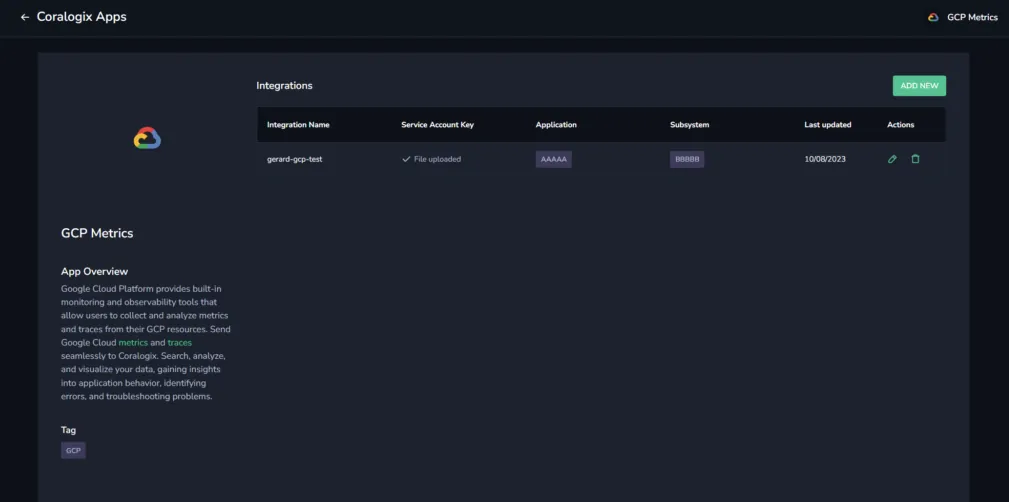
STEP 3. Select + ADD NEW.
STEP 4. Pick the ACCOUNT KEY/IMPERSONATION authentication flow and select NEXT (available for version 1.1.0 and later).
STEP 5. (For key-based authentication only) If you haven’t already done so, select GO TO GCP ACCOUNT and create a key file as described above. Once you have created a key file, select NEXT.
STEP 6. (For key-based authentication only) Select SELECT FILE and select the key file that you created in the previous section. A confirmation that the file was uploaded successfully will appear. Select NEXT.
STEP 7. Select the metric prefixes you want to pull into Coralogix by selecting them from the dropdown menu. To limit unnecessary API calls that fetch no data but count towards the quota limit, specify only the GCP prefixes of the metrics you want to pull into Coralogix.
-
Coralogix queries only the metrics under the selected prefixes.
-
For metrics for which no data has been available for more than 15 minutes, the scraping interval will be reduced from 15 minutes to 1 hour.
-
Querying all of your metrics may result in GCP quota limits and less frequent metric updates.
Version 1.8.0 keeps the project_id and location labels that earlier versions dropped. Adding a label changes the identity of a time series, so review dashboards, alerts and recording rules that match or group on the current label set before you upgrade. See Metric labels.
STEP 8. Select NEXT.
STEP 9. Optionally select additional labels.
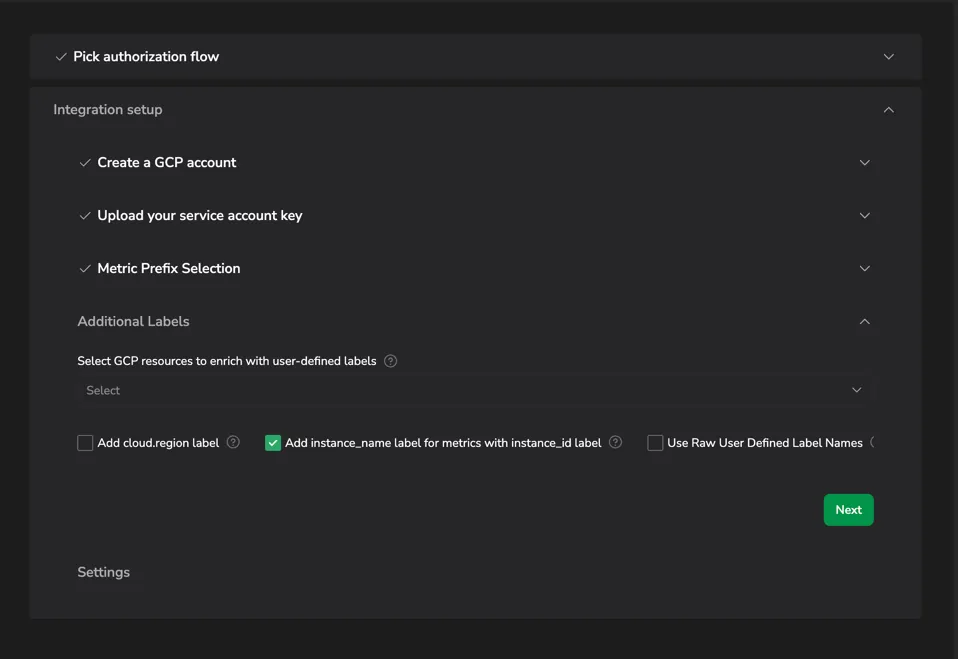
For user-defined labels, optionally select resource types from the list. Metrics that contain labels like instance_id or database_id that
refer to the selected resource types will be enriched with the user-defined labels of the corresponding resources.
For every selected resource type, the service account must contain permission to view these resources:
- Cloud SQL Instances – requires the
cloudsql.instances.listpermission, included in theCloud SQL Viewerrole - Cloud Storage Buckets – requires the
storage.buckets.listpermission, included in theStorage Bucket Viewerrole - Memorystore (Valkey) Instances – requires the
memorystore.instances.listpermission, included in theMemorystore Viewerrole - Memorystore for Redis Instances – requires the
redis.instances.listpermission, included in theCloud Memorystore Redis Viewerrole - Memorystore for Memcached Instances – requires the
memcache.instances.listpermission, included in theCloud Memorystore Memcached Viewerrole - AlloyDB Instances – requires
alloydb.instances.listandalloydb.instances.listpermissions, included in theAlloyDB Viewerrole - AlloyDB Clusters – requires
alloydb.clusters.listandalloydb.clusters.listpermissions, included in theAlloyDB Viewerrole - Pub/Sub Topics – requires the
pubsub.topics.listpermission, included in thePub/Sub Viewerrole - Pub/Sub Subscriptions – requires the
pubsub.subscriptions.listpermission, included in thePub/Sub Viewerrole
Pub/Sub topics and subscriptions are read from every project in your scoping project's metrics scope, not only from the project the integration is set up for. The service account therefore needs pubsub.topics.list (for Pub/Sub Topics) or pubsub.subscriptions.list (for Pub/Sub Subscriptions) in every project of the scope, the scoping project included. A project the service account cannot list is skipped, and its topics' metrics are simply not enriched. If no project in the scope can be listed, the label scan fails and is reported as an error on the integration until the permission is granted; metric collection itself is unaffected.
Topics and subscriptions are selected separately; picking one does not enable the other. Besides their user-defined labels, this adds each resource's name and state as the system_name and system_state labels.
Under Additional Labels, you can also enable the following options:
- Add cloud.region label: adds a
cloud.regionlabel, derived from the resource zone, to all collected metrics across every namespace. - Add instance_name label for metrics with instance_id label: adds an
instance_namelabel togce_instancemetrics that already carry aninstance_idlabel. This requires theroles/compute.viewerpermission on the service account. - Use Raw User Defined Label Names: emits user-defined labels with their original GCP names instead of the default
user./user_prefix.
- By default, user-defined labels on resources referred to by the metric will be added to the metric label, prefixed with
user.string (user_in the legacy Prometheus format). If more than one resource referred to by the metric defines the same user label - e.g. AlloyDB cluster and instance both define labeltag, the more specific resource wins - in this case, the instance label will win. If raw user-defined label names are enabled, labels are emitted with their original GCP names. If a raw user-defined label conflicts with an existing metric, resource, system, application, or subsystem label, the existing label is kept and the user-defined label is not emitted.
STEP 10. Select NEXT.
STEP 11. Select the application and subsystem names.
-
Enter a default name for the application, or [optionally] select labels that will be used to create the application name. The first label value, which matches a metric label, will be used as the application_name. For example, given three application labels, if the first does not match any metrics, the value of the second label will be used as the application name.
-
Enter a default subsystem name or [optionally] select labels that will be used to create the subsystem name.
-
Note: Application and Subsystem names for metrics are optional. If no default name or labels are provided, the application name and subsystem name will not be populated for this metric.
-
GCP Project ID: ID of a GCP project that you perform the setup for (for impersonation-based authentication only).
-
GCP Billing Project ID: A caller-specified project for quota and billing purposes. The caller must have
serviceusage.services.usepermission on the project. -
Service Account Email: Email of the service account you configured at the beginning (for impersonation-based authentication only).
STEP 12. (For impersonation-based authentication only)
-
Select NEXT
-
Copy email of Coralogix principal
-
Select GO TO GCP ACCOUNT
-
Select the service account you created earlier. Navigate to the Principals with access tab and select Grant access. Paste the copied email into the New principals field, assign the
Service Account Token Creatorrole, and select Save. -
Navigate back to the Coralogix portal.
It may take a few minutes for the GCP IAM role change to take effect.
STEP 13. Select COMPLETE.
Operation
Metric labels
Every collected metric carries labels from four sources:
| Label | Source |
|---|---|
cloud_provider | Always gcp. |
gcp_project_id | The project the integration collects metrics from. Under a metrics scope this is the scoping project, not the project that owns the resource. |
api_domain | The GCP service the metric belongs to, for example pubsub. |
| Monitored resource labels | Copied from the GCP monitored resource, for example topic_id or instance_id. |
| Metric labels | Copied from the GCP metric, for example response_code. Which ones exist depends on the metric. |
cx_application_name, cx_subsystem_name | The application and subsystem you configured in STEP 11. |
user_<label> | User-defined labels of the resource types you selected in STEP 9. With Use Raw User Defined Label Names enabled, the original GCP name is used instead. |
system_name, system_state | For pubsub_topic and pubsub_subscription metrics, the resource's name and state, when Pub/Sub Topics or Pub/Sub Subscriptions is selected in STEP 9. |
cloud_region, instance_name | Added only when you enable the corresponding option in STEP 9. |
project_id and locationIntegration versions 1.2.0 to 1.7.0 drop the project_id and location monitored resource labels. Version 1.8.0 keeps them.
They are not duplicates of the labels the integration adds:
project_idis the project that owns the monitored resource, whilegcp_project_idis the project the integration collects from. Under a metrics scope these are different projects, and withoutproject_ida resource cannot be attributed to the project it lives in.locationis the resource's own location, which may be a region, a multi-region, orglobal.cloud_regionis derived from the resource zone and is only present when you enable Add cloud.region label.
Metric Names
The integration produces metrics with names built from the GCP metric names after some transformations, dictated by the Prometheus and OTLP specifications. Most importantly:
- The unit of the metric is added as a suffix to the metric name, after being converted following the OTLP unit conversion rules:
- Converting from abbreviations to full words (e.g. “ms” to “milliseconds”).
- Special case: Converting “1” to “ratio”.
- Converting “foo/bar” to “foo_per_bar”. If the metric name already contains the unit suffix, it is not added again.
- All not-alphabetical characters (
_,/,-etc.) are replaced with underscores (_). - The suffix
_totalis added to the metric name if the metric is a counter
Examples
{
  "type": "pubsub.googleapis.com/subscription/dead_letter_message_count",
  "unit": "1",
  ....
}
Will result in metric name pubsub_googleapis_com_subscription_dead_letter_message_count_ratio_total:
- unit
1is converted toratioand added as a suffix _totalis added as it is a counter metric
{
  "type": "networking.googleapis.com/vm_flow/egress_bytes_count",
  "unit": "By",
  ....
}
Will result in metric name networking_googleapis_com_vm_flow_egress_bytes_count_total
- unit
Byis converted tobytesand not added second time as it is already present in the metric name _totalis added as it is a counter metric