Ship Snowflake logs and audit data with OpenTelemetry
Snowflake has no direct Coralogix export, but it records user activity in queryable account usage views. This page routes that data to Coralogix through the OpenTelemetry Collector: the SQL query receiver runs a query against Snowflake on an interval and emits each row as a log.
The Collector also ships a dedicated Snowflake receiver for performance and resource metrics. This page covers the SQL query receiver, which is what reaches the log and audit tables.
What you need
- An OpenTelemetry Collector installed and configured.
- An active Snowflake account with sufficient access to the account usage views,
ACCOUNTADMIN, for example. - Your Coralogix domain and a Send-Your-Data API key, supplied to the Collector as
CORALOGIX_DOMAINandPRIVATE_KEY.
Build the connection string
The SQL query receiver connects with a datasource string built from your Snowflake account identifier.
In the Snowflake console, open the account menu in the bottom-left corner, hover over your account, and select Copy account URL.
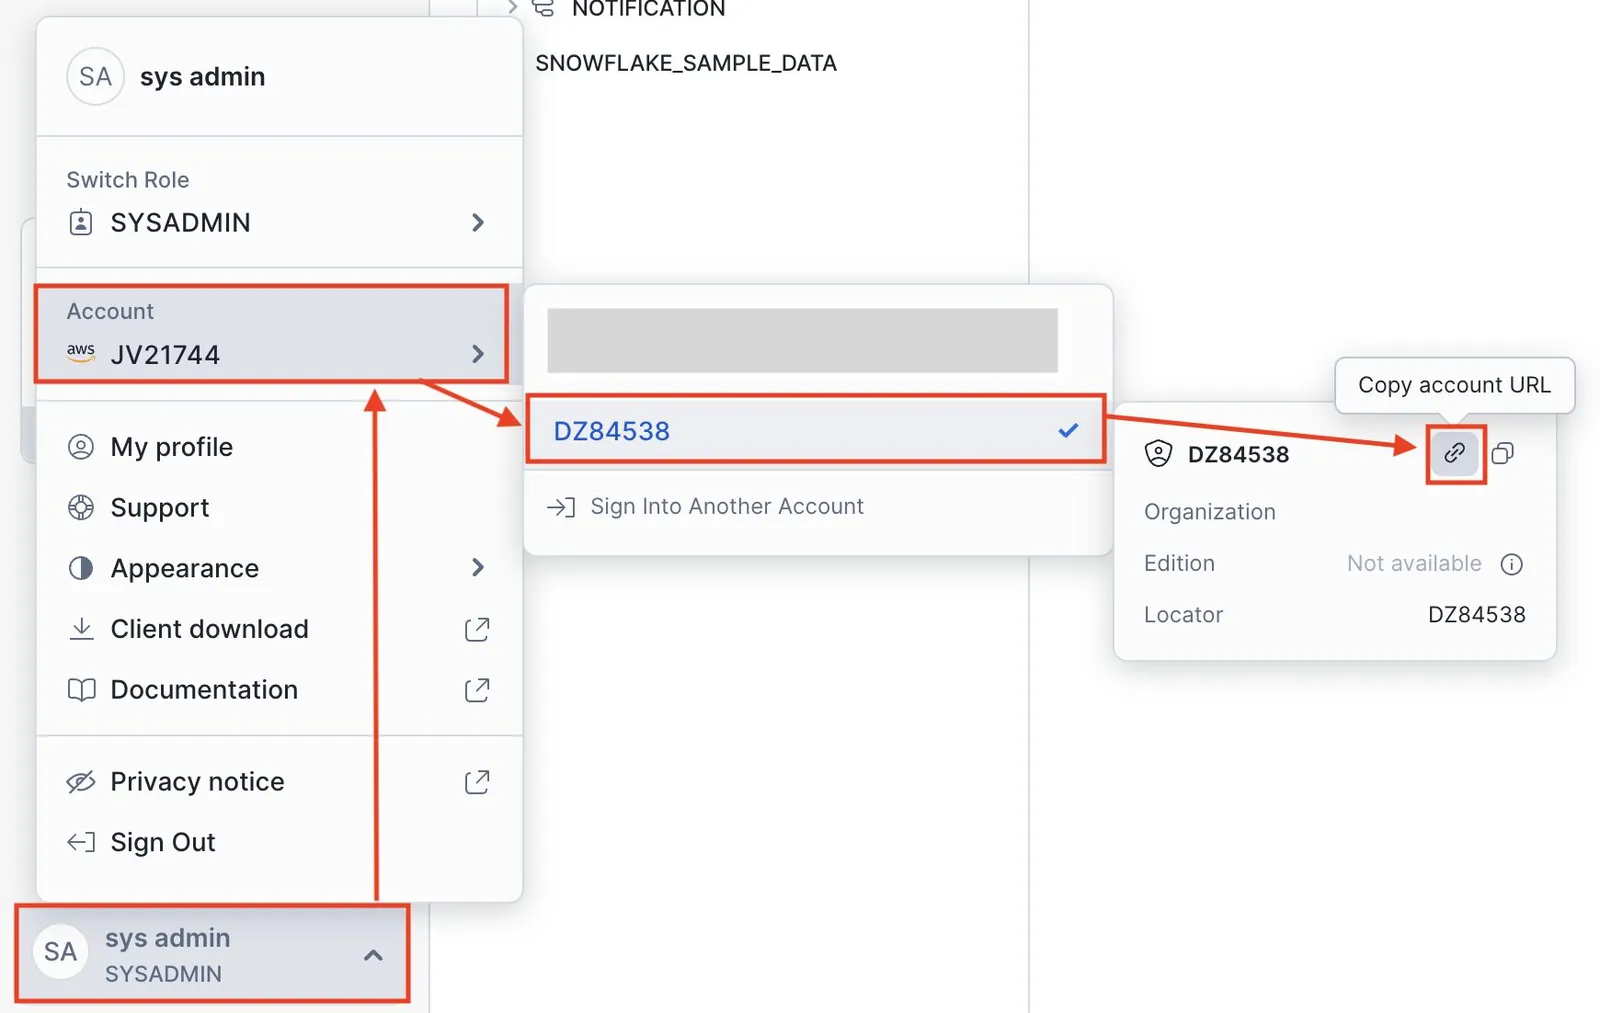
Shows the path from the user menu to the account URL that carries the identifier.
The URL follows this shape, and everything before snowflakecomputing.com is the identifier, for xy12345.us-east-2.aws.snowflakecomputing.com, that is xy12345.us-east-2.aws.
<account_locator>.<cloud_region_id>.<cloud>.snowflakecomputing.com
Snowflake covers the variants in its account identifiers guide.
Combine your credentials and identifier:
<username>:<password>@<account_identifier>/SNOWFLAKE/ACCOUNT_USAGE
Configure the SQL query receiver
Add the receiver to your Collector configuration file (otel-collector-config.yaml, typically) and attach it to a logs pipeline. This example collects login history.
exporters:
  coralogix:
    application_name: 'otel'
    application_name_attributes:
    - aws.ecs.task.family
    - service.namespace
    domain: ${CORALOGIX_DOMAIN}
    logs:
      headers:
        X-Coralogix-Distribution: ecs-fargate-integration/0.0.1
    metrics:
      headers:
        X-Coralogix-Distribution: ecs-fargate-integration/0.0.1
    private_key: ${PRIVATE_KEY}
    subsystem_name: 'integration'
    subsystem_name_attributes:
    - service.name
    - aws.ecs.docker.name
    - container_name
    timeout: 30s
    traces:
      headers:
        X-Coralogix-Distribution: ecs-fargate-integration/0.0.1
receivers:
  sqlquery:
    collection_interval: 21600s
    driver: snowflake
    datasource: "<username>:<password>@<ACCOUNT_IDENTIFIER>.snowflakecomputing.com/SNOWFLAKE/ACCOUNT_USAGE"
    queries:
      - sql: |
          SELECT
          OBJECT_CONSTRUCT(
              'application', 'snowflake',
              'environment', 'debug',
              'log_type', 'login_history',
              'EVENT_TIMESTAMP', EVENT_TIMESTAMP,
              'EVENT_TYPE', EVENT_TYPE,
              'USER_NAME', USER_NAME,
              'CLIENT_IP', CLIENT_IP,
              'REPORTED_CLIENT_TYPE', REPORTED_CLIENT_TYPE,
              'FIRST_AUTHENTICATION_FACTOR', FIRST_AUTHENTICATION_FACTOR,
              'IS_SUCCESS', IS_SUCCESS,
              'ERROR_CODE', ERROR_CODE,
              'ERROR_MESSAGE', ERROR_MESSAGE,
              'EVENT_ID', EVENT_ID
          ) log,
          EXTRACT(EPOCH FROM EVENT_TIMESTAMP) AS EPOCH_TIMESTAMP
          FROM SNOWFLAKE.ACCOUNT_USAGE.LOGIN_HISTORY
          WHERE EXTRACT(EPOCH FROM EVENT_TIMESTAMP) > ?
          ORDER BY EPOCH_TIMESTAMP ASC
        tracking_start_value: "0"
        tracking_column: EPOCH_TIMESTAMP
        logs:
          - body_column: LOG
service:
  pipelines:
    logs:
      receivers:
        - sqlquery
      exporters:
        - coralogix
What the settings do
| Setting | Purpose |
|---|---|
driver | The database driver. snowflake. |
datasource | The connection string you assembled above. |
collection_interval | How often the query runs. Lower it for fresher data. |
sql | The query. It builds a JSON object from LOGIN_HISTORY columns and takes the tracking value through the ? placeholder. |
tracking_column and tracking_start_value | Where the receiver resumes from between runs. |
logs.body_column | The column whose contents become the log body. LOG here. |
Derive a numeric EPOCH_TIMESTAMP column from EXTRACT(EPOCH FROM EVENT_TIMESTAMP) and track on that. tracking_column only works on numeric types, and the table's EVENT_ID is not a continuous sequence. With ORDER BY EPOCH_TIMESTAMP ASC, the Collector carries the last row's value into the next query.
Restarting the Collector resets tracking to tracking_start_value and re-queries everything. Bound the query to avoid that, for example, EVENT_TIMESTAMP >= DATEADD(hour, -6, CURRENT_TIMESTAMP()).
Deploy and validate
Fold the sqlquery receiver into the Collector configuration you deploy, Kubernetes, ECS, or EC2.
Apply the configuration change and roll out the Collector.
Confirm exactly one sqlquery receiver instance is running. More than one produces duplicate records.
In Coralogix, select Explore, then Logs.
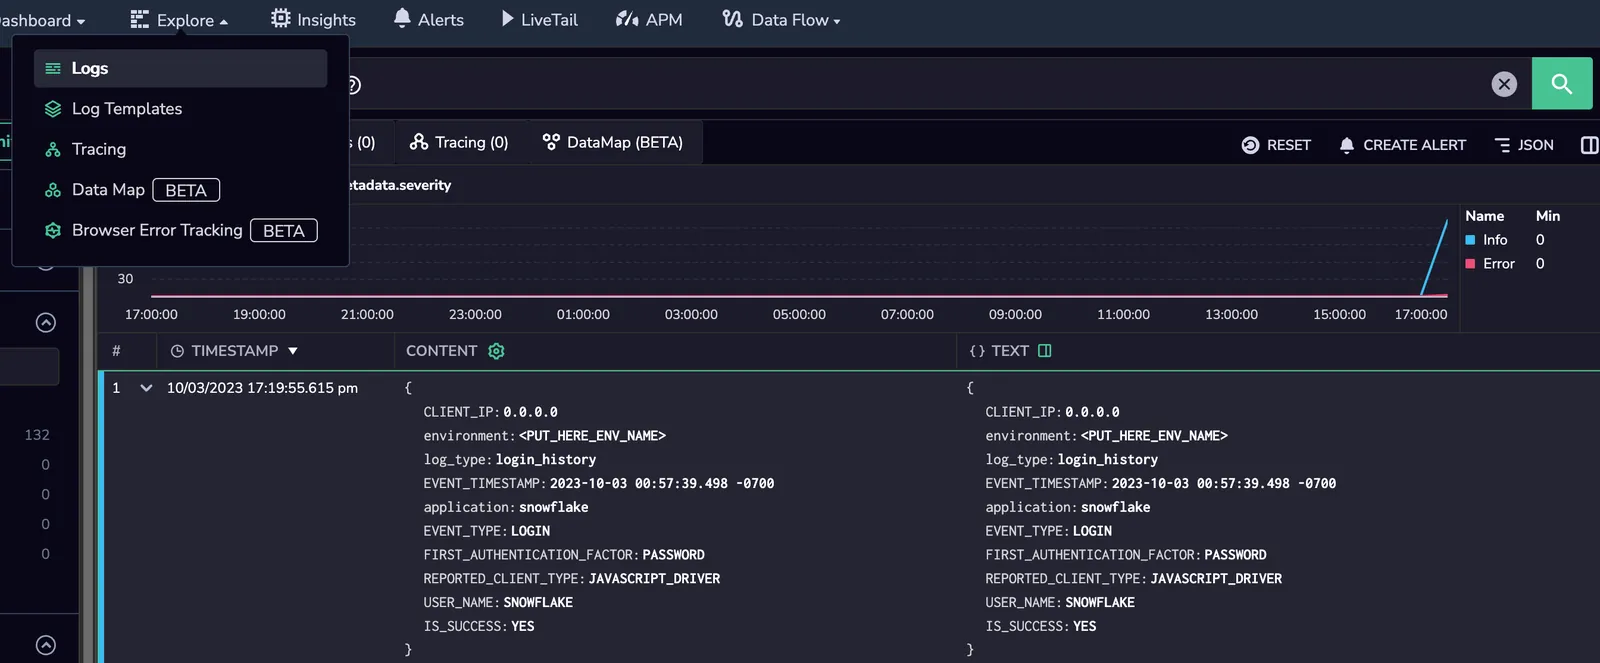
Shows a login history row arriving as a structured log, with the fields the query constructed.
Collect more tables
Repeat the sqlquery.queries block for each account usage view you want. Common candidates:
WAREHOUSE_EVENTS_HISTORY, WAREHOUSE_LOAD_HISTORY, WAREHOUSE_METERING_HISTORY, DATABASE_STORAGE_USAGE_HISTORY, DATA_TRANSFER_HISTORY, GRANTS_TO_ROLES, GRANTS_TO_USERS, METERING_DAILY_HISTORY, PIPE_USAGE_HISTORY, REPLICATION_USAGE_HISTORY, STAGE_STORAGE_USAGE_HISTORY, STORAGE_USAGE, TASK_HISTORY, and COPY_HISTORY.
ECS task definition
A Fargate task definition that runs the Collector with its configuration and API key pulled from Secrets Manager:
{
  "containerDefinitions": [
      {
          "name": "otel-collector",
          "image": "otel/opentelemetry-collector-contrib",
          "cpu": 0,
          "portMappings": [
              {
                  "name": "otel-collector-4317-tcp",
                  "containerPort": 4317,
                  "hostPort": 4317,
                  "protocol": "tcp",
                  "appProtocol": "grpc"
              },
              {
                  "name": "otel-collector-4318-tcp",
                  "containerPort": 4318,
                  "hostPort": 4318,
                  "protocol": "tcp",
                  "appProtocol": "grpc"
              }
          ],
          "essential": true,
          "command": [
              "--config",
              "env:SSM_CONFIG"
          ],
          "environment": [
              {
                  "name": "CORALOGIX_DOMAIN",
                  "value": "us2.coralogix.com"
              }
          ],
          "mountPoints": [],
          "volumesFrom": [],
          "secrets": [
              {
                  "name": "SSM_CONFIG",
                  "valueFrom": "<ARN_TO_SECRETS_MANAGER>"
              },
              {
                  "name": "PRIVATE_KEY",
                  "valueFrom": "<ARN_TO_SECRETS_MANAGER>"
              }
          ],
          "user": "0",
          "logConfiguration": {
              "logDriver": "awslogs",
              "options": {
                  "awslogs-group": "<ENV>-coralogix-open-telemetry",
                  "awslogs-create-group": "true",
                  "awslogs-region": "<REGION>",
                  "awslogs-stream-prefix": "snowflake"
              }
          },
          "systemControls": []
      }
  ],
  "family": "staging-coralogix-open-telemetry",
  "networkMode": "awsvpc",
  "revision": 22,
  "volumes": [],
  "status": "ACTIVE",
  "requiresAttributes": [
      {
          "name": "com.amazonaws.ecs.capability.logging-driver.awslogs"
      },
      {
          "name": "ecs.capability.execution-role-awslogs"
      },
      {
          "name": "com.amazonaws.ecs.capability.docker-remote-api.1.19"
      },
      {
          "name": "ecs.capability.secrets.asm.environment-variables"
      },
      {
          "name": "com.amazonaws.ecs.capability.docker-remote-api.1.17"
      },
      {
          "name": "com.amazonaws.ecs.capability.task-iam-role"
      },
      {
          "name": "com.amazonaws.ecs.capability.docker-remote-api.1.18"
      },
      {
          "name": "ecs.capability.task-eni"
      },
      {
          "name": "com.amazonaws.ecs.capability.docker-remote-api.1.29"
      }
  ],
  "placementConstraints": [],
  "compatibilities": [
      "EC2",
      "FARGATE"
  ],
  "requiresCompatibilities": [
      "FARGATE"
  ],
  "cpu": "1024",
  "memory": "3072",
  "runtimePlatform": {
      "cpuArchitecture": "X86_64",
      "operatingSystemFamily": "LINUX"
  },
  "tags": [
      {
          "key": "project",
          "value": "<PROJECT_NAME>"
      }
  ]
}