Snyk vulnerability monitoring with Coralogix
Export your Snyk security testing data to Coralogix as Prometheus metrics, so vulnerability counts sit alongside the rest of your telemetry and can be alerted on and charted like any other metric.
The open-source Snyk exporter, written in Go by the LunarTech team, scrapes Snyk's API and exposes the results in Prometheus format. Coralogix ingests them through Prometheus RemoteWrite.
What you need
- An active Snyk account, with access to the organization you want to monitor.
- A host that can run Docker and reach both the Snyk API and your Coralogix endpoint.
- A Coralogix Send-Your-Data API key.
Collect your Snyk organization ID and API key
The exporter authenticates with a Snyk service account token and scrapes one organization at a time, so you need both values before you start.
In the Snyk sidebar, select your group, then your organization, then Settings.
Under Organization ID, select Copy.
Under Organization API key, select Manage service accounts.
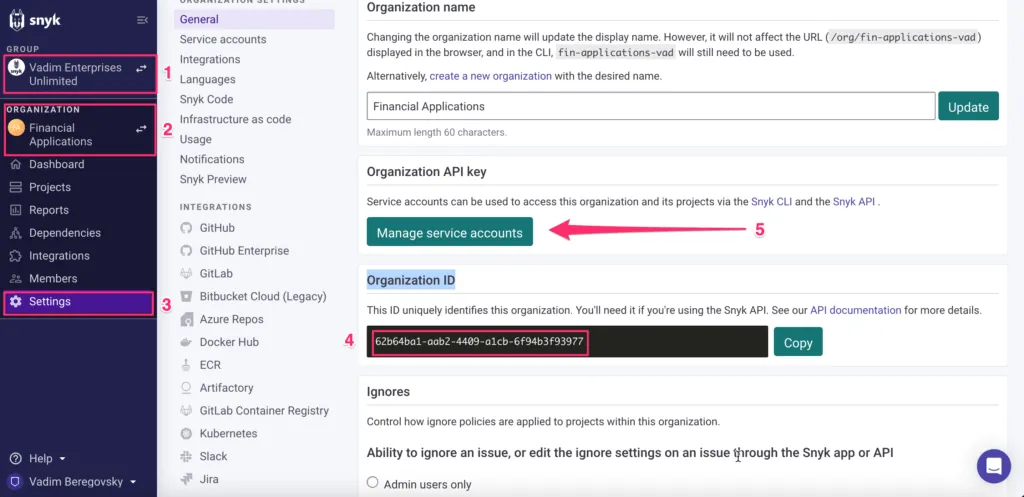
Shows where the organization ID and the service accounts entry point sit in Snyk's organization settings.
Enter a Name, select a Role, then select Create. The role cannot be changed after creation.
Copy the generated organization API key. Snyk shows it once.
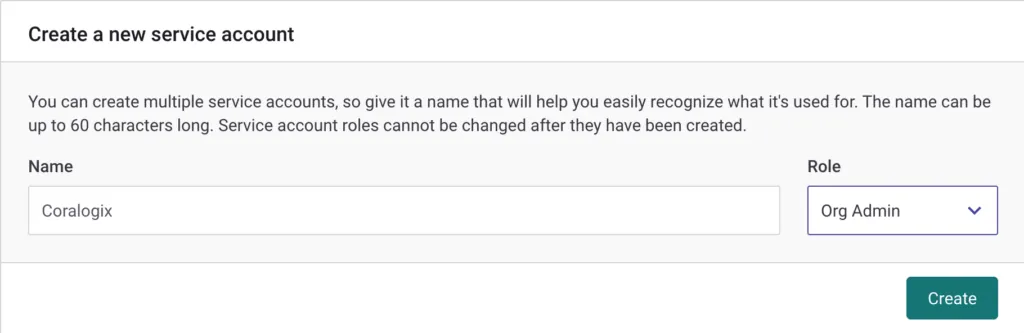
Shows the service account form used to mint the token the exporter authenticates with.
Run the exporter
Substitute your token and organization ID:
docker run -p9532:9532 quay.io/lunarway/snyk_exporter \
  --snyk.api-token '<API_TOKEN>' \
  --log.level="info" \
  --snyk.organization='<ORG_ID>'
On startup the exporter reports the organization it is scraping:
time="2023-04-25T18:45:37Z" level=info msg="Starting Snyk exporter for organization '62b64ba1-aab2-4409-a1cb-6f94b3f93977'" source="main.go:67"
time="2023-04-25T18:45:37Z" level=info msg="Listening on :9532" source="main.go:111"
time="2023-04-25T18:45:37Z" level=info msg="Snyk API scraper starting" source="main.go:140"
time="2023-04-25T18:45:37Z" level=info msg="Running Snyk API scraper for organizations: Financial Applications" source="main.go:174"
time="2023-04-25T18:45:37Z" level=info msg="Collecting for organization 'Financial Applications'" source="main.go:196"
Once a scrape completes, it reports how many results it is exposing:
time="2023-04-25T18:52:54Z" level=info msg="Recorded 585 results for organization 'Financial Applications'" source="main.go:205"
time="2023-04-25T18:52:54Z" level=info msg="Exposing 585 results as metrics" source="main.go:216"
Add a remote_write block to your Prometheus configuration, following the Prometheus integration instructions:
remote_write:
- url: https://ingress.eu2.coralogix.com/prometheus/v1
  name: '<customer_name>'
  remote_timeout: 120s
  bearer_token: '<Send_Your_Data_private_key>'
| Field | What to enter |
|---|---|
url | The Prometheus RemoteWrite endpoint for your Coralogix domain. |
name | A name for the time series. |
bearer_token | Your Coralogix Send-Your-Data API key. |
Validate the integration
In the Coralogix Grafana instance, query the snyk_vulnerabilities_total metric.
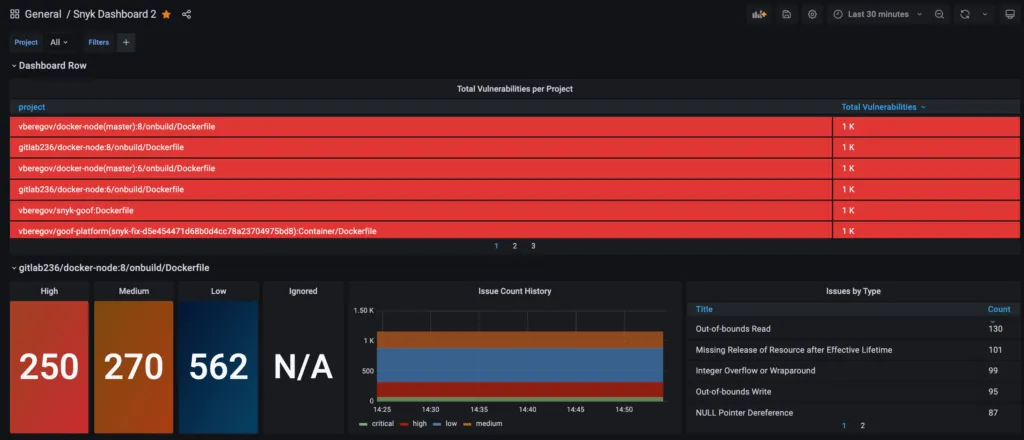
Shows vulnerability totals per project alongside severity breakdowns and issue history.