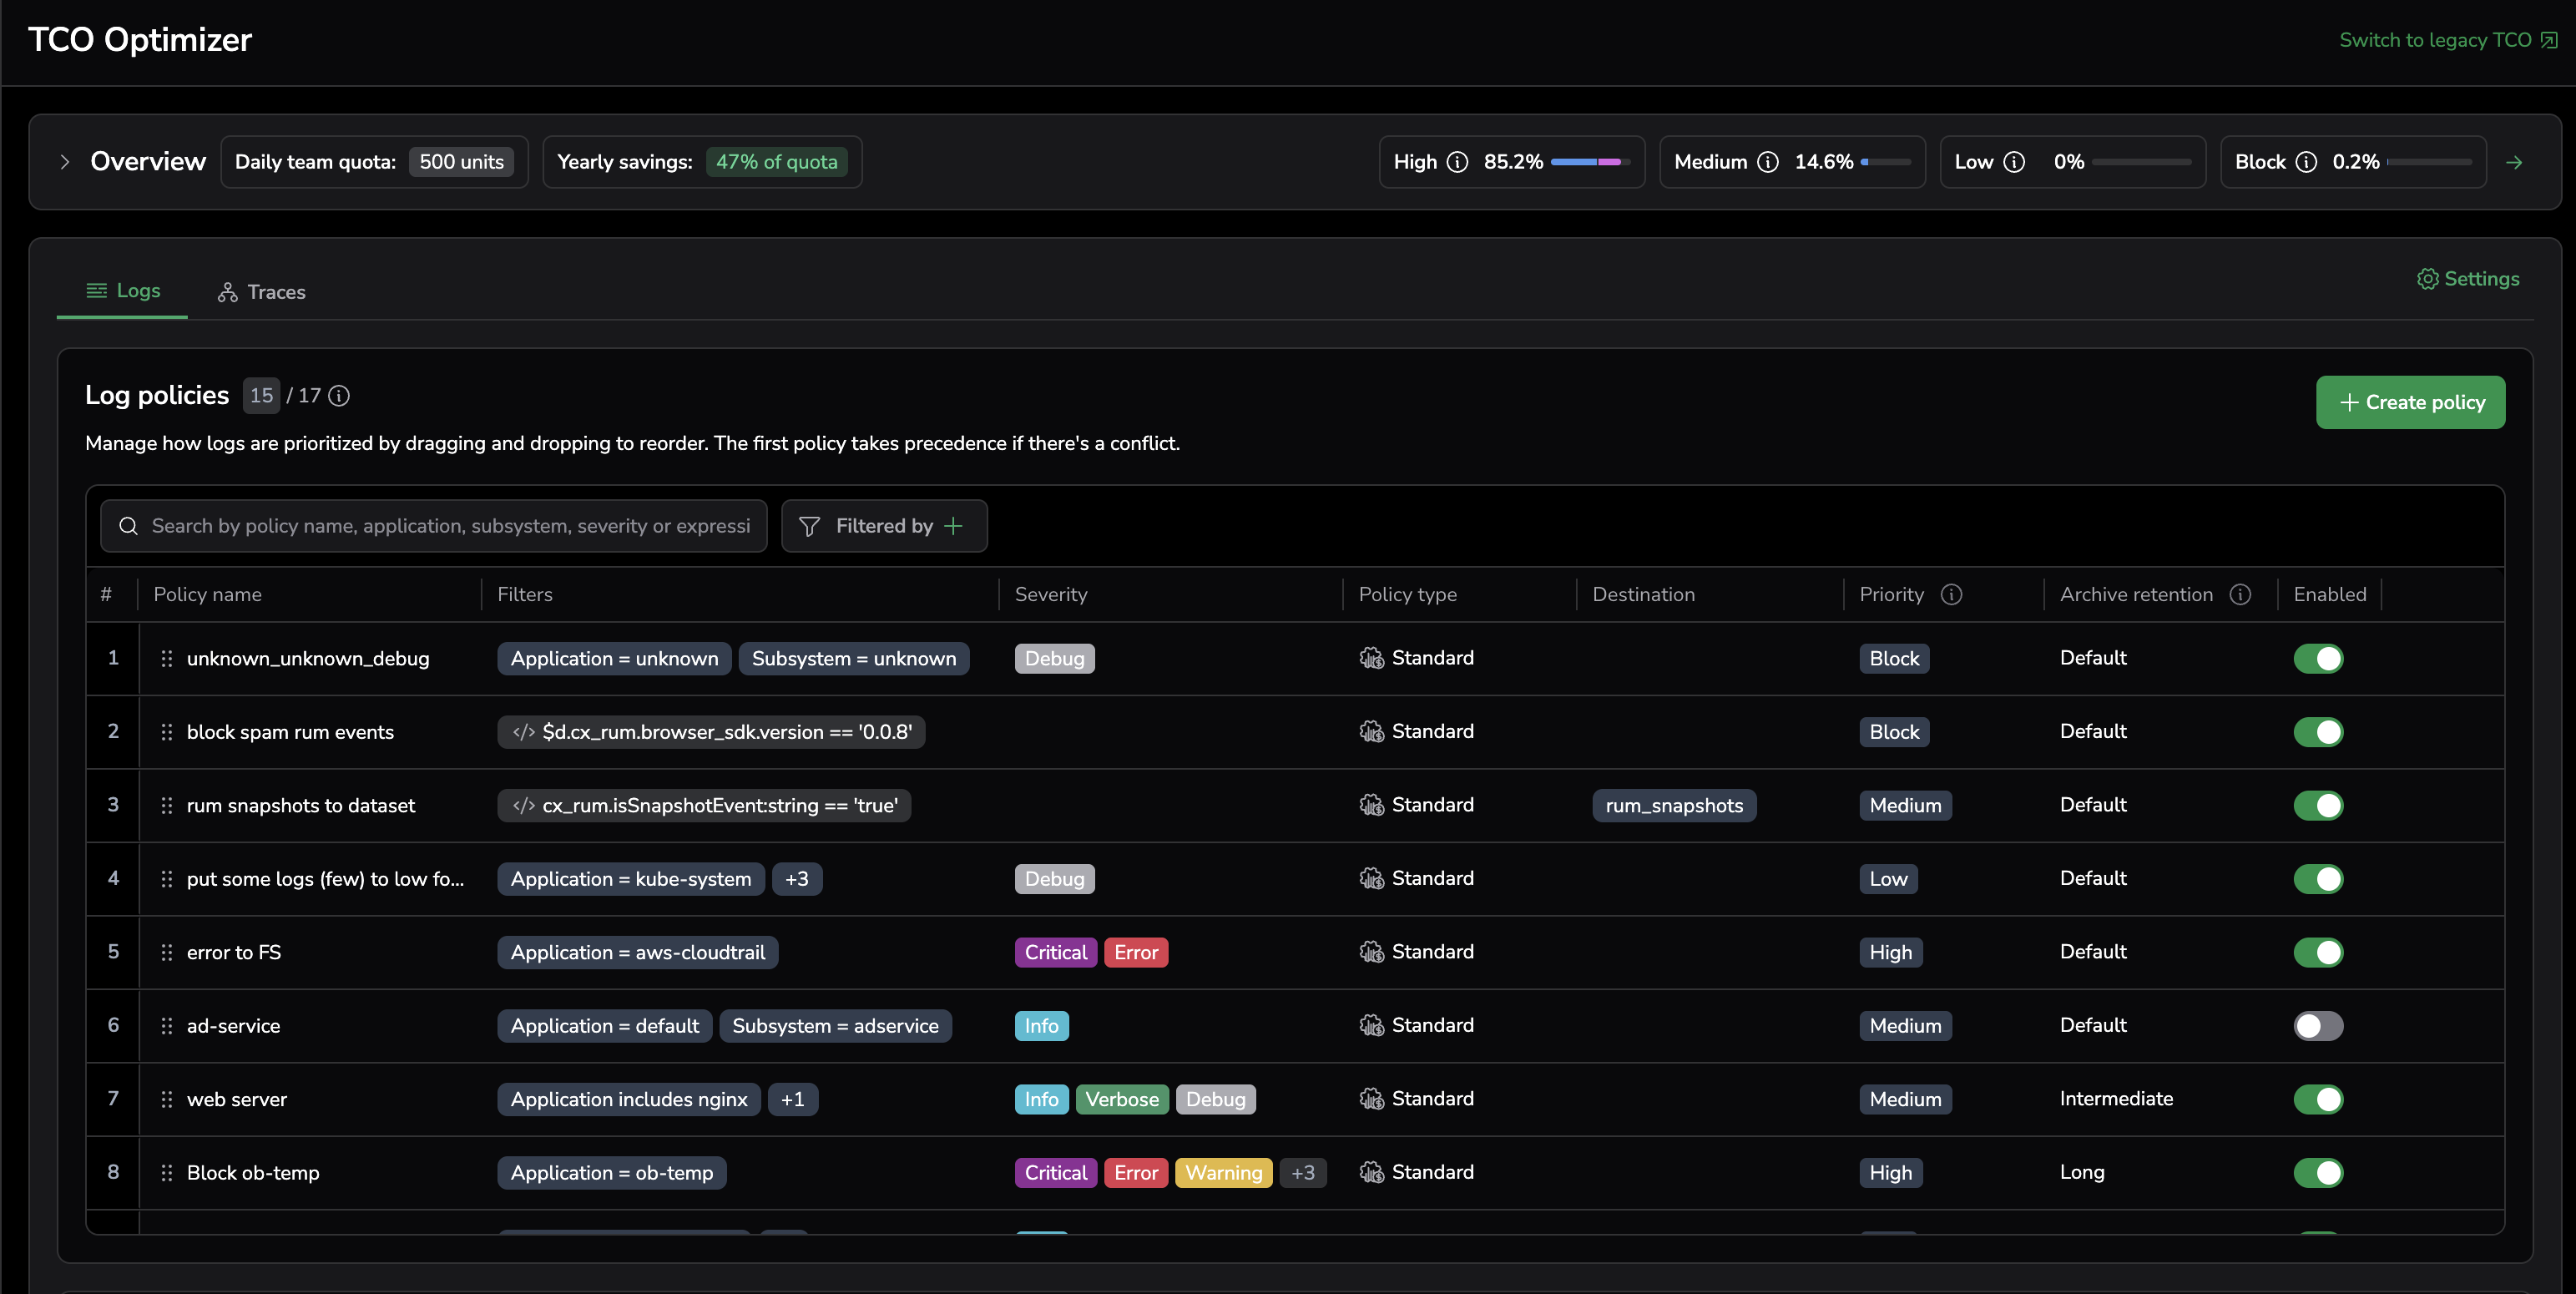
TCO Optimizer
The Total Cost of Ownership (TCO) Optimizer routes logs and traces to the right priority based on their business value. You define policies that match incoming data and route it to an outcome that determines how the data is stored, how it can be queried, and what it costs.
Policies are evaluated in order. The first matching policy applies, and no other policies are evaluated.
How TCO routing works
When a log or trace is ingested, Coralogix evaluates your enabled policies from top to bottom:
- Evaluate the first policy.
- If the event matches, route it to the policy's configured priority and stop.
- If it does not match, evaluate the next policy.
- If no policy matches, route the event to High (Frequent Search).
Note
Data that does not match any policy is routed to High (Frequent Search) by default. To change the default, add a catch-all policy at the bottom of your policy list.
Order matters. Place narrow exception policies above broader catch-all policies.
TCO priority levels explained
Each policy routes matching data to one of four priorities. The priority determines where the data is stored, how it can be queried, and which platform features are available.
High (Frequent Search)
Data is retained in Coralogix hot storage (OpenSearch). This priority is designed for business-critical data that requires fast queries, real-time alerting, and immediate investigation. High (Frequent Search) is the default priority for data that does not match any policy.
Medium (Monitoring)
Raw data is retained in customer-owned storage and remains instantly queryable via DataPrime, with added support for alerting and dashboarding. Use this priority for monitoring and ongoing analysis at scale.
Low (Compliance)
Raw data is retained in customer-owned storage and remains instantly queryable via DataPrime. Use this priority for compliance requirements and long-term retention where frequent querying is not required.
Blocked
Data is dropped at ingestion and not stored. Blocked data incurs ingestion processing cost only — no storage or retention charges. Use Blocked to eliminate storage costs for unwanted data.
Features by priority level
Each priority level provides different capabilities across the platform:
| Feature | High (Frequent Search) | Medium (Monitoring) | Low (Compliance) |
|---|---|---|---|
| AI Evaluators | ✅ | ✅ | |
| Alerts | ✅ | ✅ | |
| APM with Events2Metrics | ✅ | ✅ | |
| APM with Span Metrics | ✅ | ✅ | ✅ |
| Archive | ✅ | ✅ | ✅ |
| Background Queries | ✅ | ✅ | ✅ |
| Custom Dashboards | ✅ | ✅ | |
| Data Enrichment | ✅ | ✅ | |
| Events2Metrics | ✅ | ✅ | |
| Explore | ✅ | ✅ | ✅ |
| Lightning Queries | ✅ | ||
| LiveTail | ✅ | ✅ | ✅ |
| Log Parsing | ✅ | ✅ | ✅ |
| Loggregation | ✅ | ✅ | |
| Real User Monitoring | ✅ | ✅ | |
| Session Replay | ✅ | ✅ | ✅ |
Note
Service Map and Service Catalog for APM are available regardless of priority.
Policies and filters
A TCO policy is defined by:
- A filter that selects which logs or traces the policy applies to
- A priority outcome: High (Frequent Search), Medium (Monitoring), Low (Compliance), or Blocked
- An archive retention setting
Filters and DPXL
Filters are defined using DataPrime Expression Language (DPXL), which matches incoming events on:
- Standard labels such as application and subsystem
- Metadata such as severity and timestamp
- Any field in the event body, including nested fields and custom keys
For common use cases, the policy editor's Builder generates DPXL automatically. To write a filter directly, switch to Expression mode, which provides inline syntax validation, schema-aware autocomplete, and a link to the expression tutorial; invalid expressions are flagged and block saving until resolved.
For the full expression syntax — keypaths ($m, $l, $d), operators, functions, type casting, and limits — see DataPrime expression language (DPXL).
Evaluation order
Policies are evaluated from top to bottom. The first matching policy applies and no subsequent policies are evaluated. Data that does not match any policy goes to High (Frequent Search) by default. Reorder policies in the UI via drag-and-drop.
Create a policy
- Navigate to Data Flow, then TCO Optimizer.
- Select Logs or Traces.
- Select + New policy.
Then configure each section of the policy.
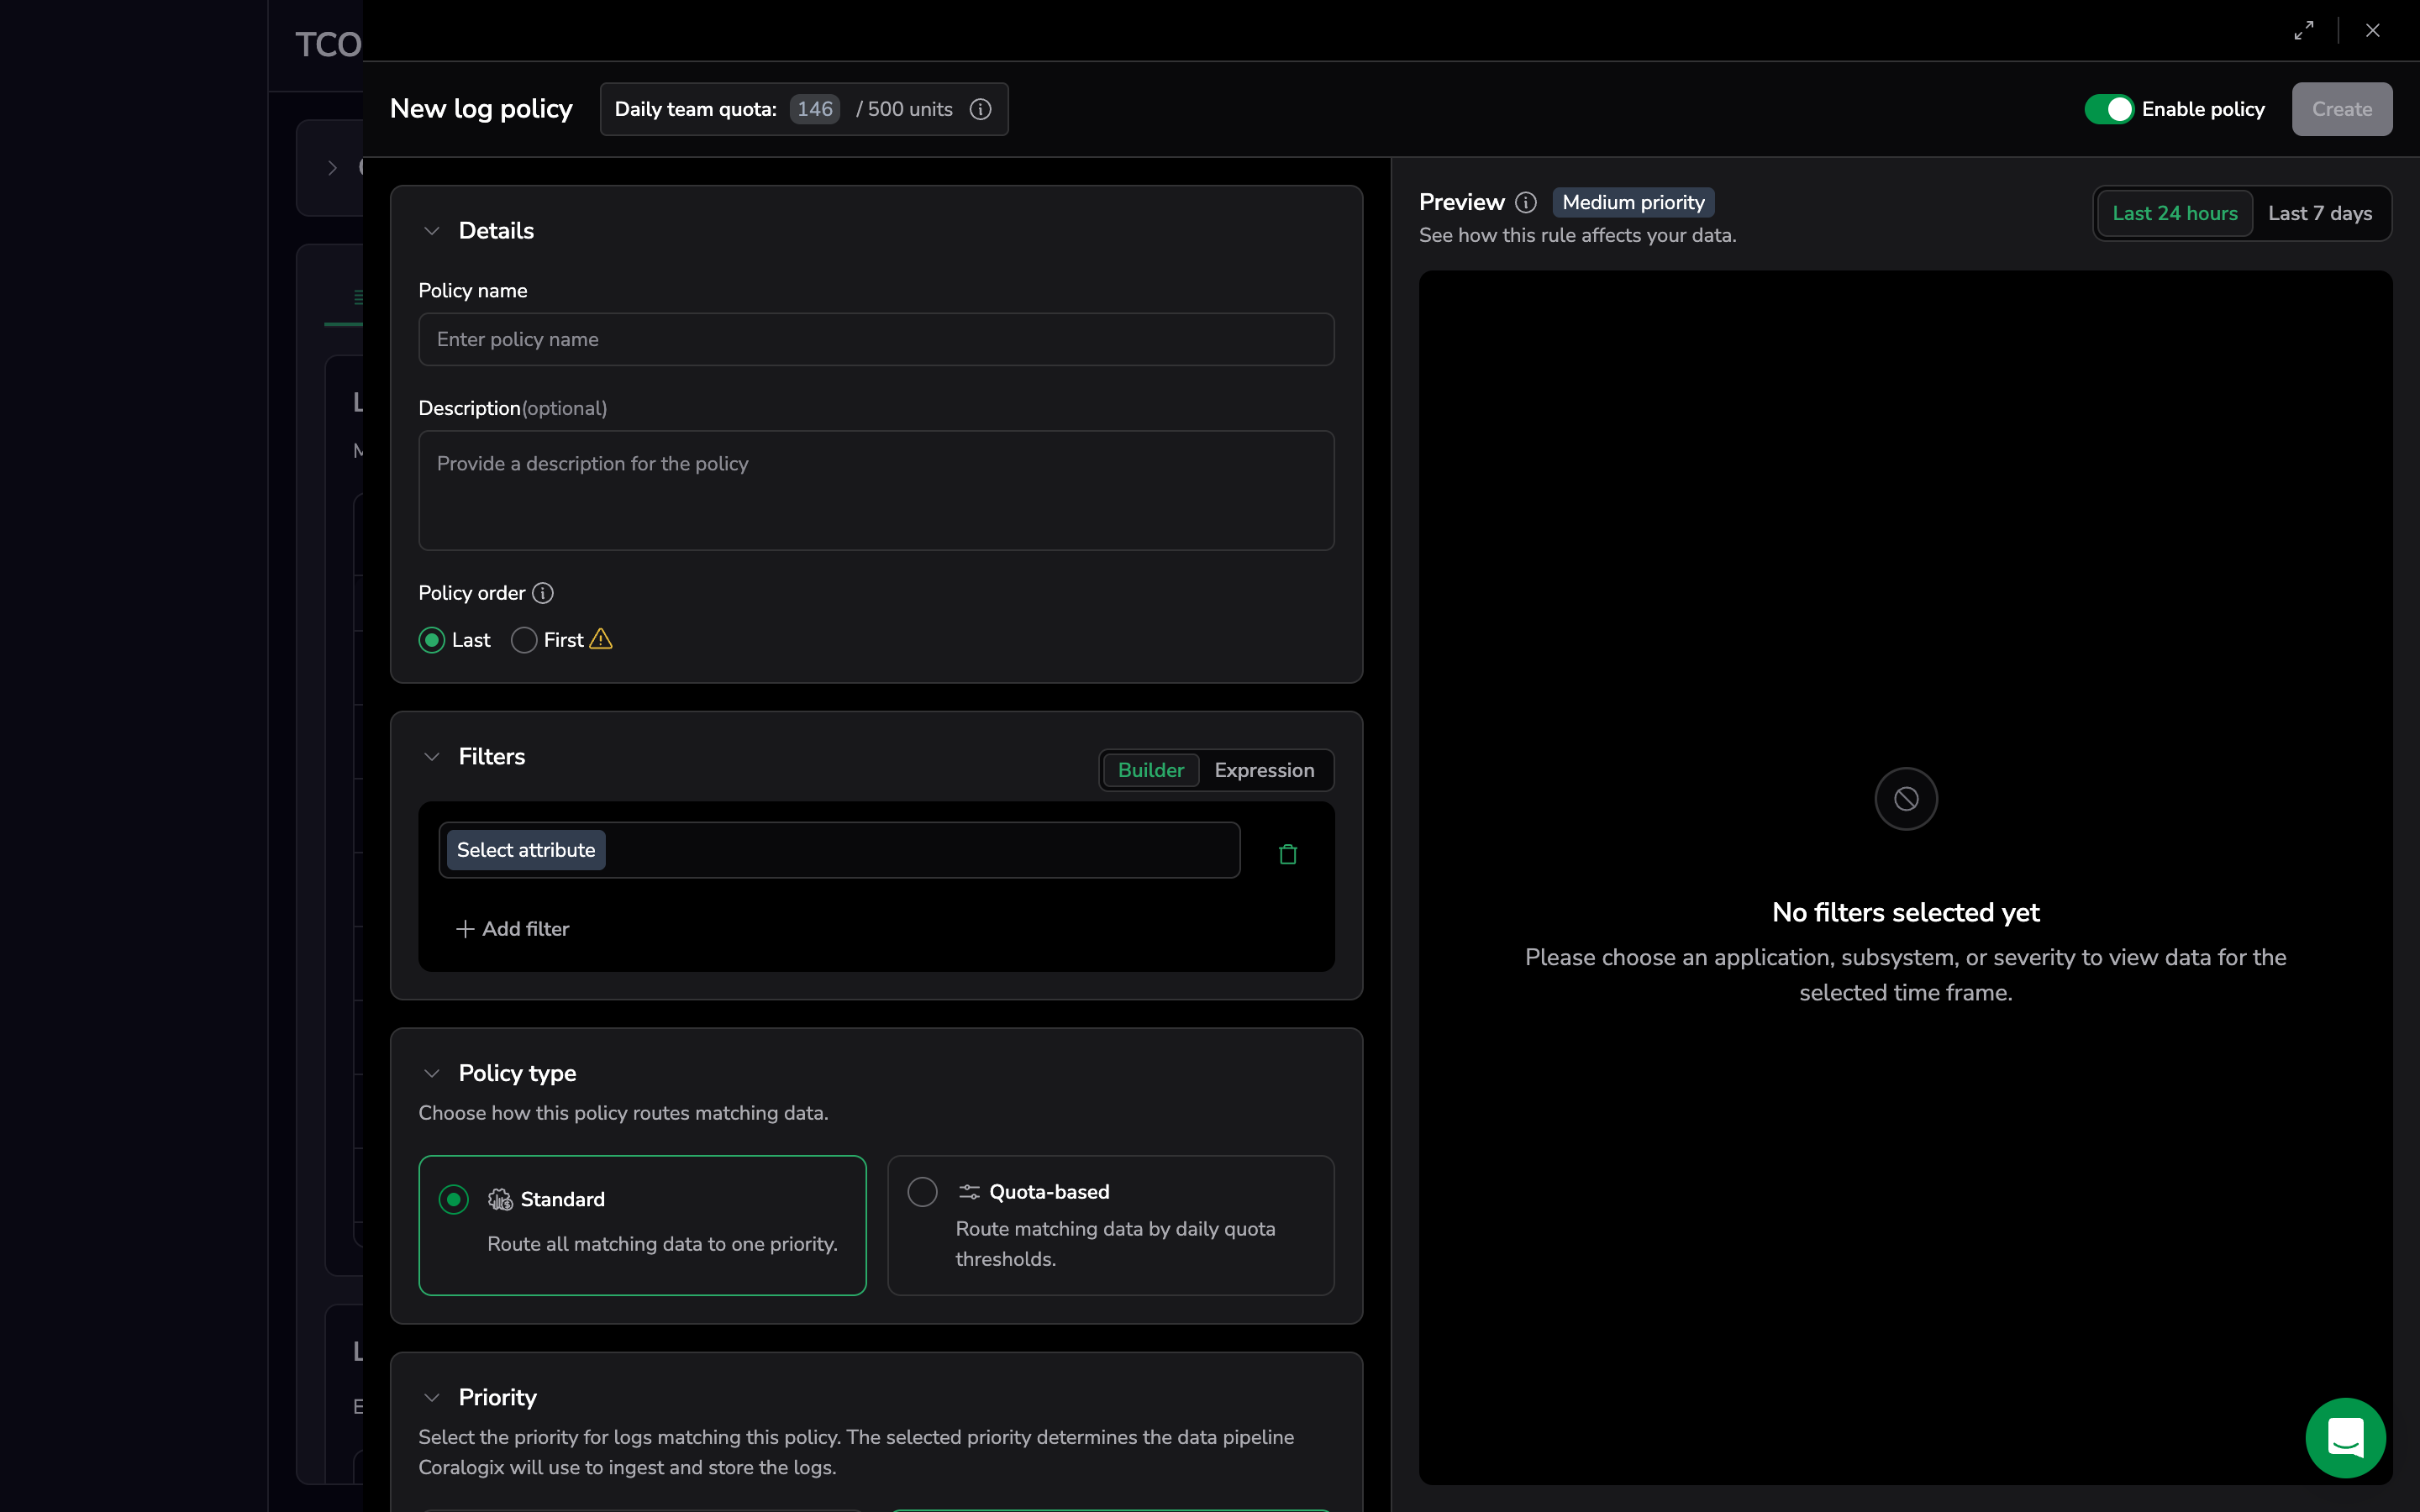
Details
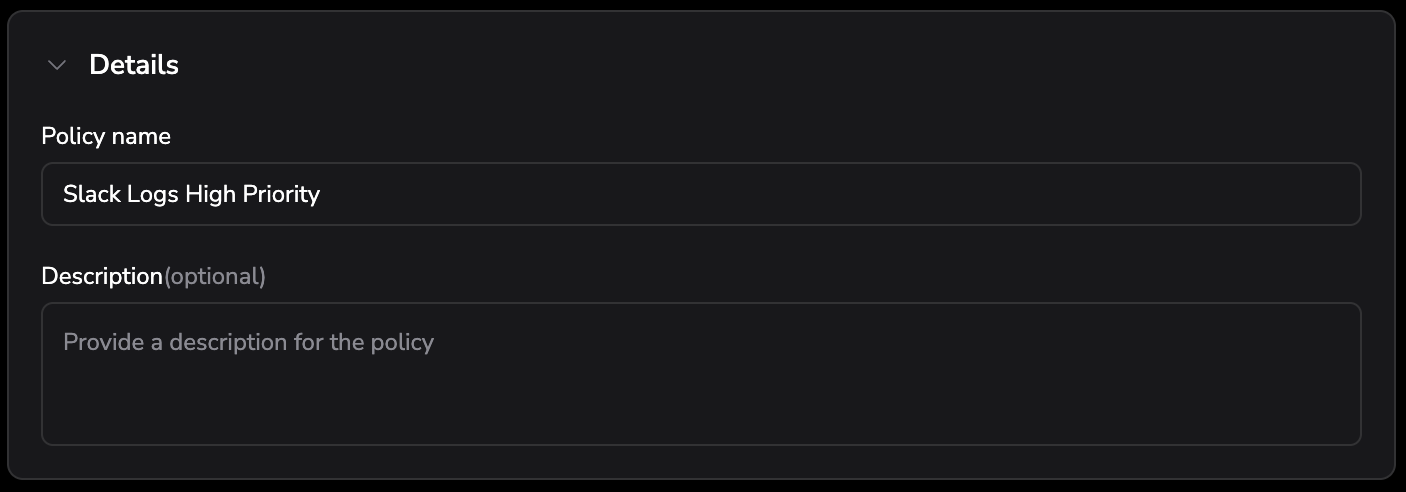
- Policy name (required)
- Description (optional)
- Policy order: First places the policy at the top of the evaluation list — it is evaluated before all existing policies. Last places it at the bottom. Policies are evaluated in order from top to bottom; when a log or trace matches a policy, the system stops and does not evaluate any subsequent policies.
Filters
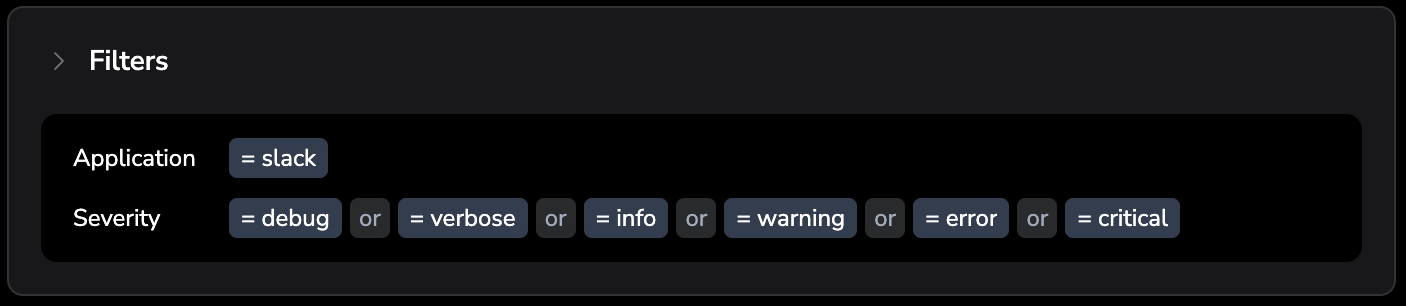
Define which logs or traces the policy applies to:
- Use the Builder to add conditions for application, subsystem, and severity using operators
is,is not,includes, orstarts with. - Or select Expression and enter a DPXL filter directly.
Policy type
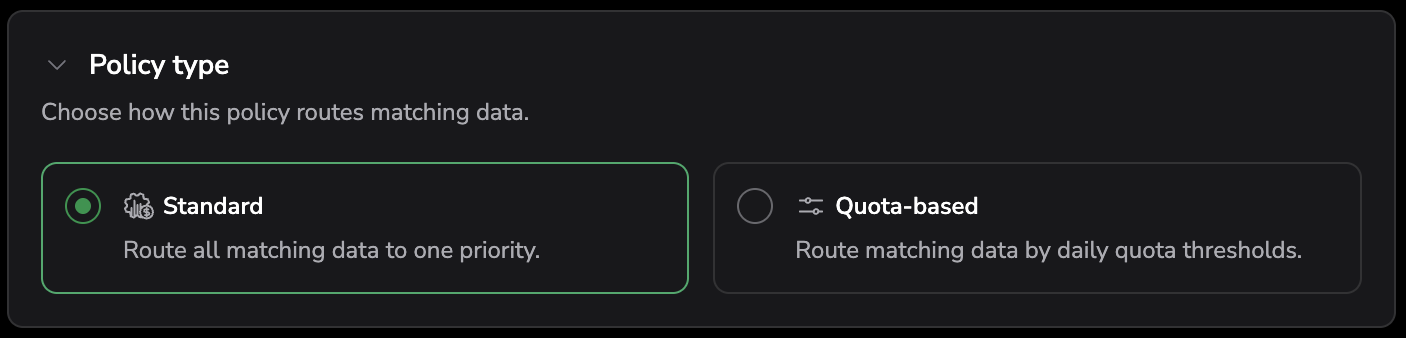
Choose how the policy routes matching data:
- Standard — route all matching data to one priority.
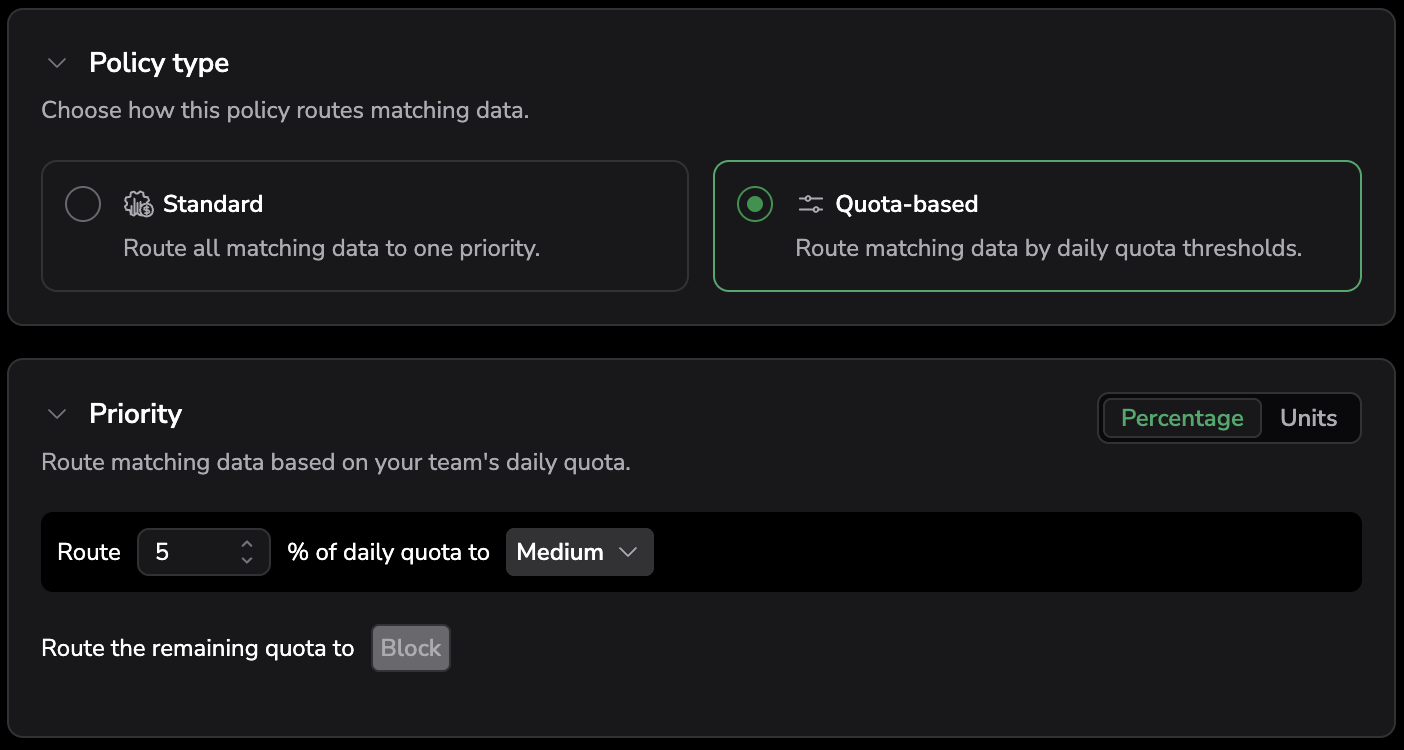
- Quota-based — route matching data by daily quota thresholds.
For a Quota-based policy, the Priority section routes a share of your daily quota to one priority and the remainder to another. Set the share as a Percentage or in Units, choose the priority it routes to, and choose where the remaining quota goes (for example, Block).
Priority
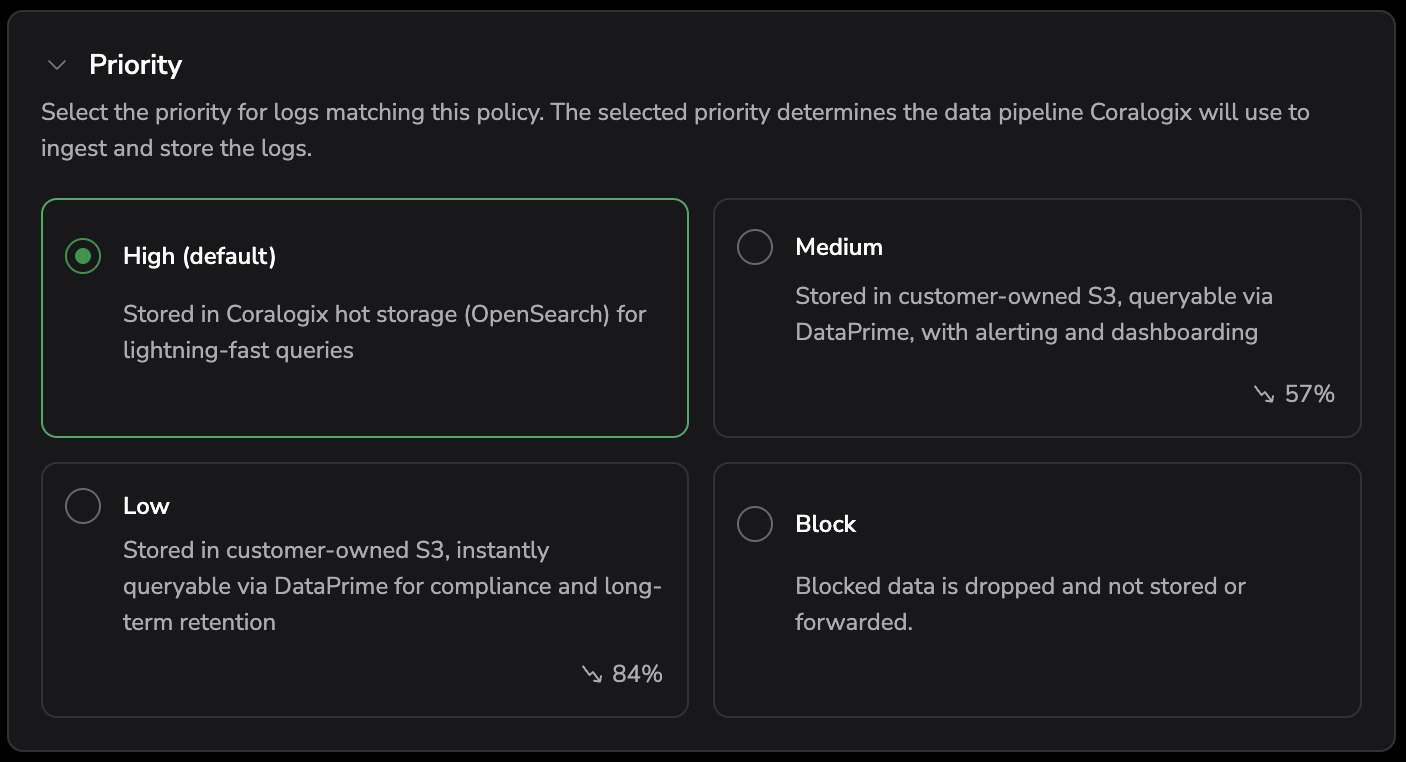
Select the priority for data matching this policy. The selected priority determines the data pipeline Coralogix uses to ingest and store the data:
- High (default) — stored in Coralogix hot storage (OpenSearch) for fast queries.
- Medium — stored in customer-owned S3, queryable via DataPrime, with alerting and dashboarding.
- Low — stored in customer-owned S3, instantly queryable via DataPrime for compliance and long-term retention.
- Block — dropped at ingestion; not stored or forwarded.
As you select a priority, the card displays the estimated Units (U) and the expected change compared to your baseline.
Target dataset
Route matching data to a specific dataset within the default/ dataspace. By default, logs route to default/logs.
- In Target Dataset, the Dataspace is fixed to
default/. From the Dataset dropdown, select the target dataset.
Note
High (Frequent Search) and Block priorities are not available when the target is any dataset other than
default/logs.
When a TCO policy targets a user-defined dataset, the result is a streaming dataset — data is routed in as it's ingested. The same dataspace can also hold summary datasets, which are populated by Background queries v2 writing query results into a dataset for downstream queries and dashboards.
For information about creating and managing user-defined datasets, see User-defined datasets.
Archive retention
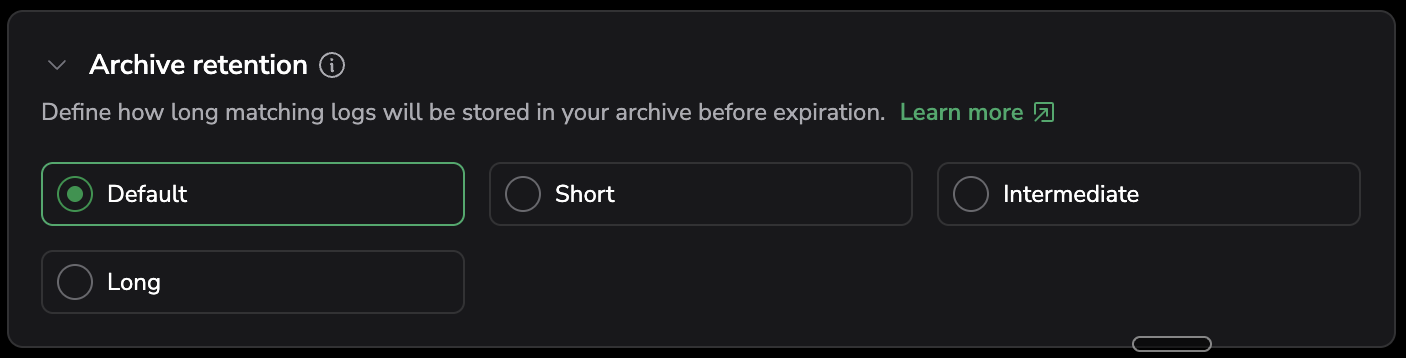
Archive retention assigns a label as a tag on the Parquet files written to your S3 bucket. Use these tags in your cloud storage lifecycle policies to control how long archived data is retained. Coralogix does not manage deletion — retention duration is controlled by your storage provider.
- In Archive retention, choose a label: Default, Short, Intermediate, or Long.
- Enable the policy to take effect immediately.
- Select Create.
Preview panel
While creating or editing a policy, the Preview panel on the right side of the policy form shows how the current filter and priority match real data. Use it to validate routing decisions before saving.
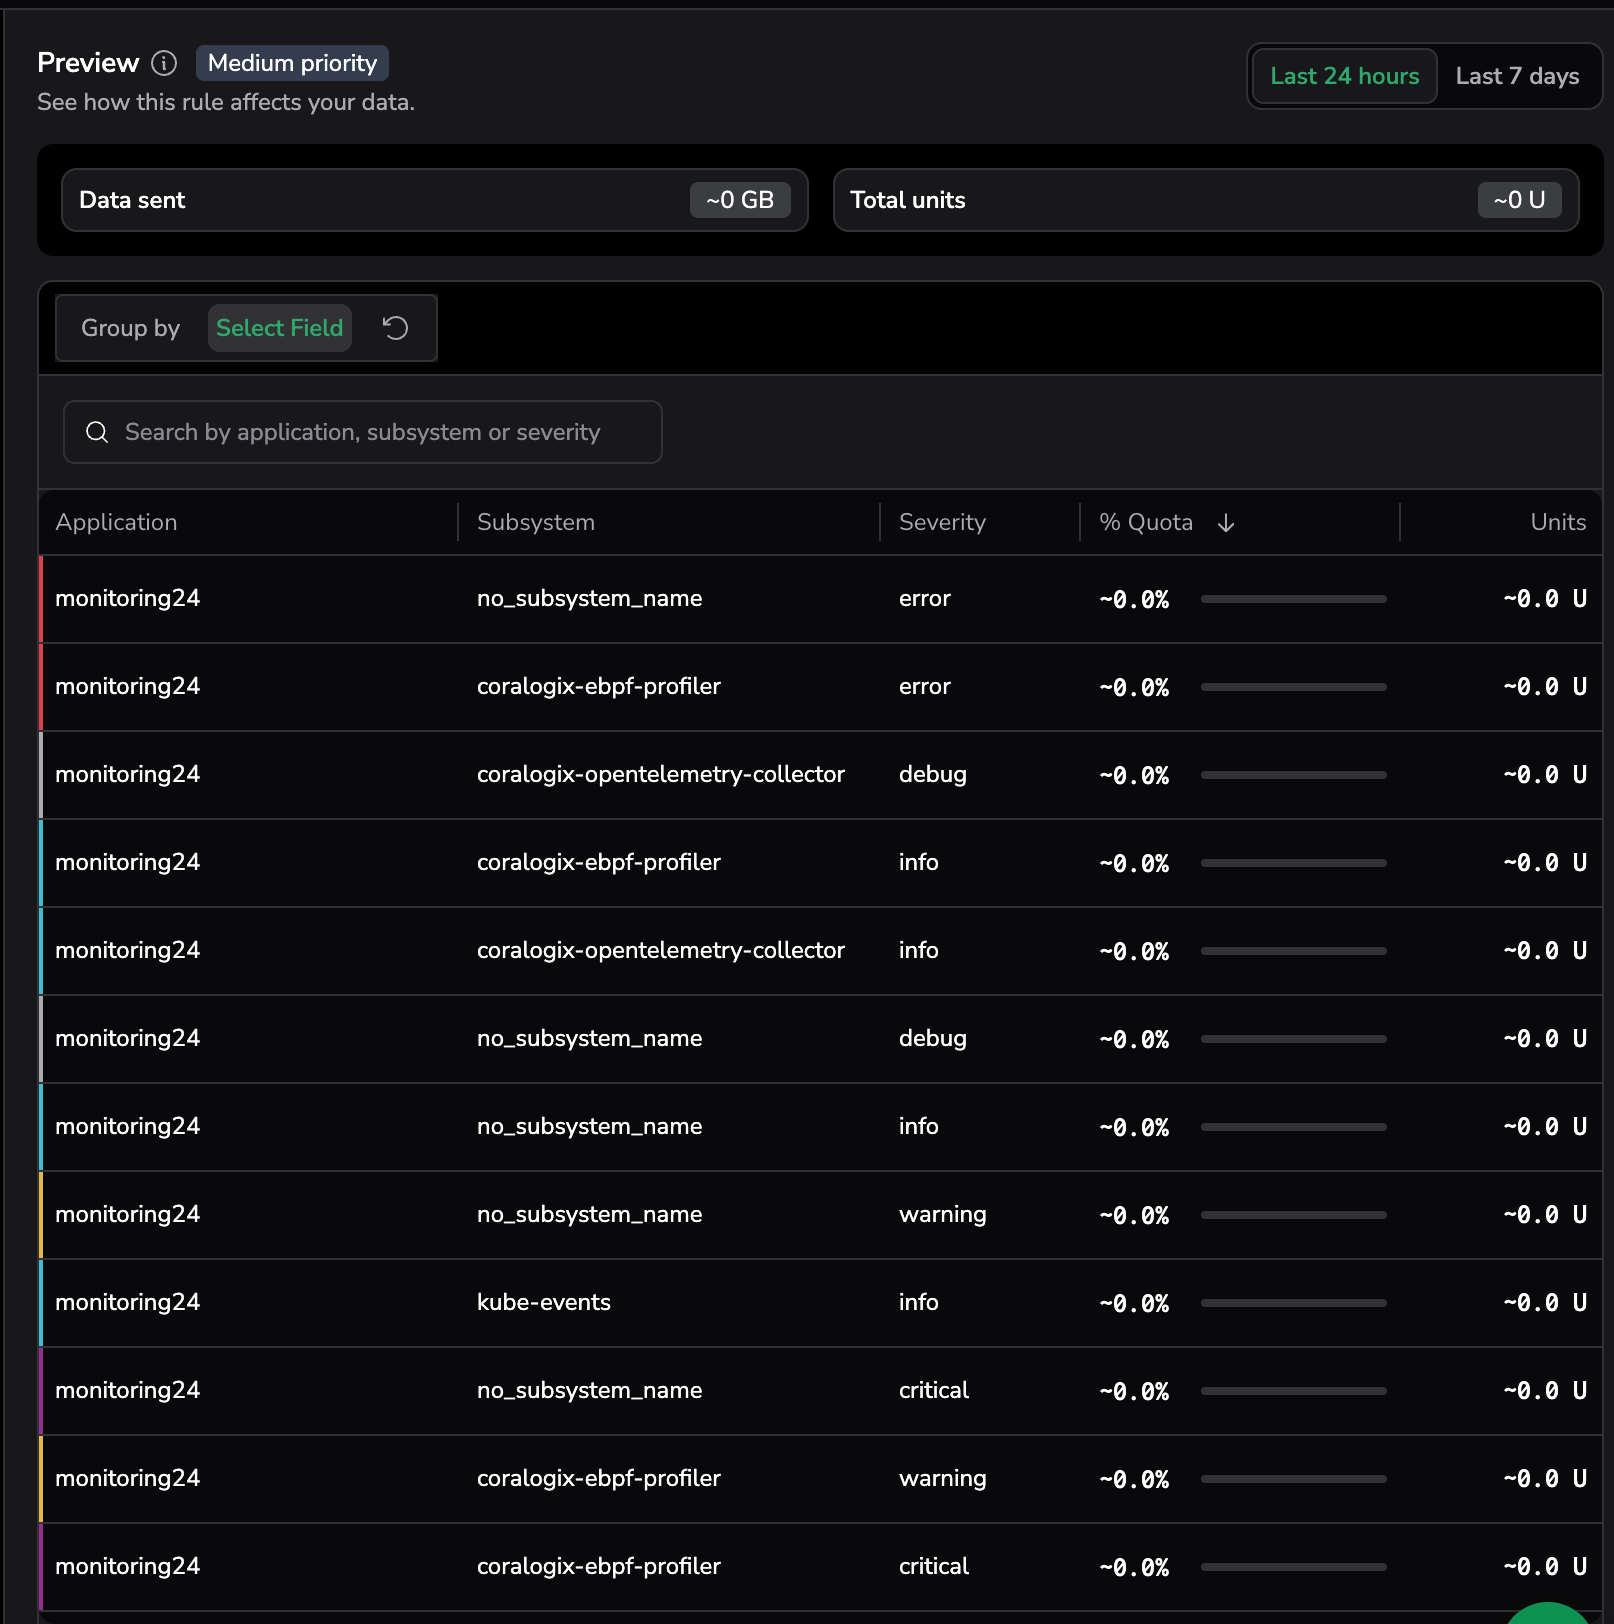
The panel header shows the priority the preview reflects as a chip — for example, Medium priority or Block priority — above the prompt See how this rule affects your data., with a time-range toggle:
- Last 24 hours
- Last 7 days
Switching the time range refetches the preview for the new window.
The counters and the time-series charts behave differently in time:
- Summary counters are a live, same-day estimate computed from your current filter and priority — available immediately while you configure the policy.
- The charts show full history in Builder mode, but in Expression (DPXL) mode they show a Limited Preview state until the day after you create the policy. Expression previews are tracked by policy ID, which doesn't exist until the policy is created, so a DPXL filter's historical trends only start to populate the next day, once tracking begins.
Summary counters
Two counter cards report the aggregate impact of the current filter and priority over the selected window:
- Data sent — total matched volume, shown in GB.
- Total units — total units (U) consumed by the matched data. When the policy action is Block, this is
0— blocked data incurs no unit cost.
The matched data's share of your daily quota appears as the % Quota column in the breakdown grid (below), not as a separate counter.
Time-series charts
The panel includes two stacked time-series charts for the selected range:
- Data sent over time — a stacked bar chart of volume by priority (High, Medium, Low, and Blocked) across the range.
- Units over time — units consumption across the range, with an average reference line.
When the policy filter is in Expression (DPXL) mode, the two charts show a Limited Preview state instead of historical data:
- Data sent over time — Volume history unavailable for expressions. Historical data trends for custom expressions begin after the policy is saved. Use the filter builder for immediate history.
- Units over time — Unit history unavailable for expressions. Tracking unit consumption and priority changes for expressions starts once the policy is active.
In Builder mode, both charts display the full history for the selected range.
Breakdown grid
The breakdown grid breaks the matched data down by combinations of application, subsystem, and severity, color-coding each row by severity. For each row, the grid shows the Application, Subsystem, Severity, % Quota, and Units columns.
- Use the Group by selector (Select Field) to pick which dimensions to include and in what order.
- Use the search box to filter rows by application, subsystem, or severity name.
- Sort by % Quota or Units to surface the largest contributors.
The Breakdown grid is always present—it is not disabled for Expression (DPXL) filters. Whenever an Expression filter narrows the results, an info banner appears above the grid with the title Partial data. and the message Results filtered by DPXL query., alongside a Learn more link to the DPXL query tutorial. The banner confirms the grid reflects the current expression, not the unfiltered ingest.
The grid shows a temporary state in these cases:
- Preview is loading — Loading data…
- No data for the selected range — No data for the selected range.
- Preview failed to load — Data unavailable — retry preview.
Empty and loading states
Before you add any filter conditions to the policy, the panel shows the placeholder No filters selected yet and prompts you to add an application, subsystem, or severity filter to populate the preview for the selected time frame.
While the preview is being computed, the panel shows Analyzing query with a description that Coralogix is scanning logs for the selected range. If the preview can't be loaded, the panel shows Preview unavailable with a prompt to retry.
When the filter is active but returns no matching events for the selected time range, the grid shows Nothing to show here with a suggestion to widen the filter, change the time range, or reset the search.
Edit, disable, or delete a policy
- To edit a policy, select the policy row and modify its filter, priority, or archive retention.
- To disable a policy, toggle the policy off. Disabled policies are skipped during evaluation.
- To reorder policies, drag the policy to a new position in the list.
- To delete a policy, select the policy and choose Delete.
Changes take effect immediately. If a policy causes unexpected routing, disable it to revert to the previous behavior.
Policy order and exception handling
Because the first matching policy applies, use this pattern:
- Put specific exceptions first.
- Put broad defaults last.
Example
Broad policy: all logs from payments-service go to Medium (Monitoring).
Exception: logs from payments-service with ERROR or CRITICAL severity go to High (Frequent Search).
Exception policy (place first):
Broad policy (place below):
Usage overview
Use the Usage overview to understand how your daily quota is consumed across priorities and how routing affects cost.

Hover over any priority in the top bar to open the Usage overview panel.
The panel includes:
Daily team quota
Shows your available daily unit quota. Coralogix uses a unit-based pricing model, where a unit is a universal billing metric per observability pillar.
Yearly savings
Shows the estimated percentage saved by routing data to Medium (Monitoring) and Low (Compliance) instead of High (Frequent Search).
Usage by priority
Shows how ingested data is distributed across priorities. For each priority, you can see how many units are consumed by each data type and how this contributes to your total daily quota.
Units per pillar
Shows unit consumption per observability pillar, broken down by priority.
Use the Usage overview to quickly assess quota consumption, validate the impact of your TCO policies, and identify opportunities for further cost optimization.
Statistics
Statistics show ingested logs or traces organized by key dimensions and their contribution to usage. Use this view to identify high-volume data and turn it into policies.
Use this view to:
- Group by
application,subsystem,severity,affecting policy, andpriority - Expand an application to see its subsystems, then expand a subsystem to see its severity breakdown
- See contribution to % Quota, Data sent, and Units (U) for each combination
- Validate expected impact before saving
Row menu actions
- Add rule — Pre-fills the policy form with the row's values
- Drill into logs — Opens a query filtered to the row's values
- Copy as filter — Copies application, subsystem, and severity chips for reuse
Slice and filter the data
- Group by chips — Choose which fields to include in the breakdown. Drag and drop chips to rearrange them.
- Search — Filter rows by name (supports partial matches).
- Include/exclude values — Use chip menus to add or remove specific values.
- Reset — Clear temporary filters and return to the default settings.
Create a policy from statistics
Turn any selection into a policy without leaving the page:
- Select a row.
- Choose Add rule. The Create policy form opens with the Builder pre-filled.
- Choose a priority: High (Frequent Search), Medium (Monitoring), Low (Compliance), or Blocked.
- (Optional) Set archive retention.
- Review the Preview panel for data sent, % quota, and units impact.
- Toggle Enable policy on to activate immediately.
- Select Create.
The new policy appears in the TCO rules table. Order matters — set Policy order to place it First (highest precedence) or Last.
Understand the "affecting policy" column
When a combination already matches a policy, the Affecting policy column displays the policy currently in effect.
Use it to:
- Avoid creating duplicate policies
- Spot combinations that fall into the default High (Frequent Search) priority (shown as
—ornone) - Decide whether to edit an existing policy or add a higher-precedence one
API and Terraform
TCO policies can also be managed via the Coralogix API or Terraform provider. See the TCO Optimizer HTTP API and the Terraform documentation for details.
Log overrides: end-of-life and migration
The Overrides table for logs is being retired. During the hybrid phase you can migrate overrides to log policies in bulk — using Convert to policy or Delete from the Overrides table — and after the cutoff any remaining overrides become top-ordered policies automatically, preserving current behavior.
For the full timeline, step-by-step migration, API impact, and FAQs, see Deprecation of TCO overrides.
Permissions
To view and manage TCO policies, your role needs the following permissions. Assign them individually, or use the TCOPolicies permission preset, which bundles them and stays up to date as permissions change.
| Permission | Grants |
|---|---|
LOGS.TCO:READPOLICIES | View log TCO policies |
LOGS.TCO:UPDATEPOLICIES | Manage log TCO policies |
SPANS.TCO:READPOLICIES | View tracing TCO policies |
SPANS.TCO:UPDATEPOLICIES | Manage tracing TCO policies |
For details on roles, permissions, and presets, see Create roles and permissions.