LLM Calls
Overview
LLM Calls is a key feature of Coralogix AI observability solution, providing deep insights into every LLM interaction. It captures and analyzes trace data in real-time, offering quality and security evaluations, latency tracking, tool usage monitoring, and cross-product correlation. With visualizations like flame graphs, dependency maps, and Gantt charts, you can quickly identify issues and debug with precision.
Spans and traces
Each call represents an individual LLM span, which is a unit of work reflecting the input/output between a user, an LLM, or a tool. A trace represents the work required to process a request in your LLM application and is made up of one or more spans. The Concepts and Terms document provides a detailed overview of LLM-related terminology used throughout our documentation and UI.
How to use LLM call data
Use the LLM calls to:
- Analyze individual spans in detail for more efficient debugging.
- Pinpoint spans with the highest latency to optimize response times.
- Filter security issues within traces to assess potential vulnerabilities more effectively.
- Track the models used in each trace to compare performance across different models.
- Review user interactions, prompts, and responses within a session to enhance the end-user experience.
Accessing LLM calls
- In the Coralogix UI, navigate to AI Center > Application Catalog.
- Choose an application which calls you want to view.
- Go to LLM Calls.
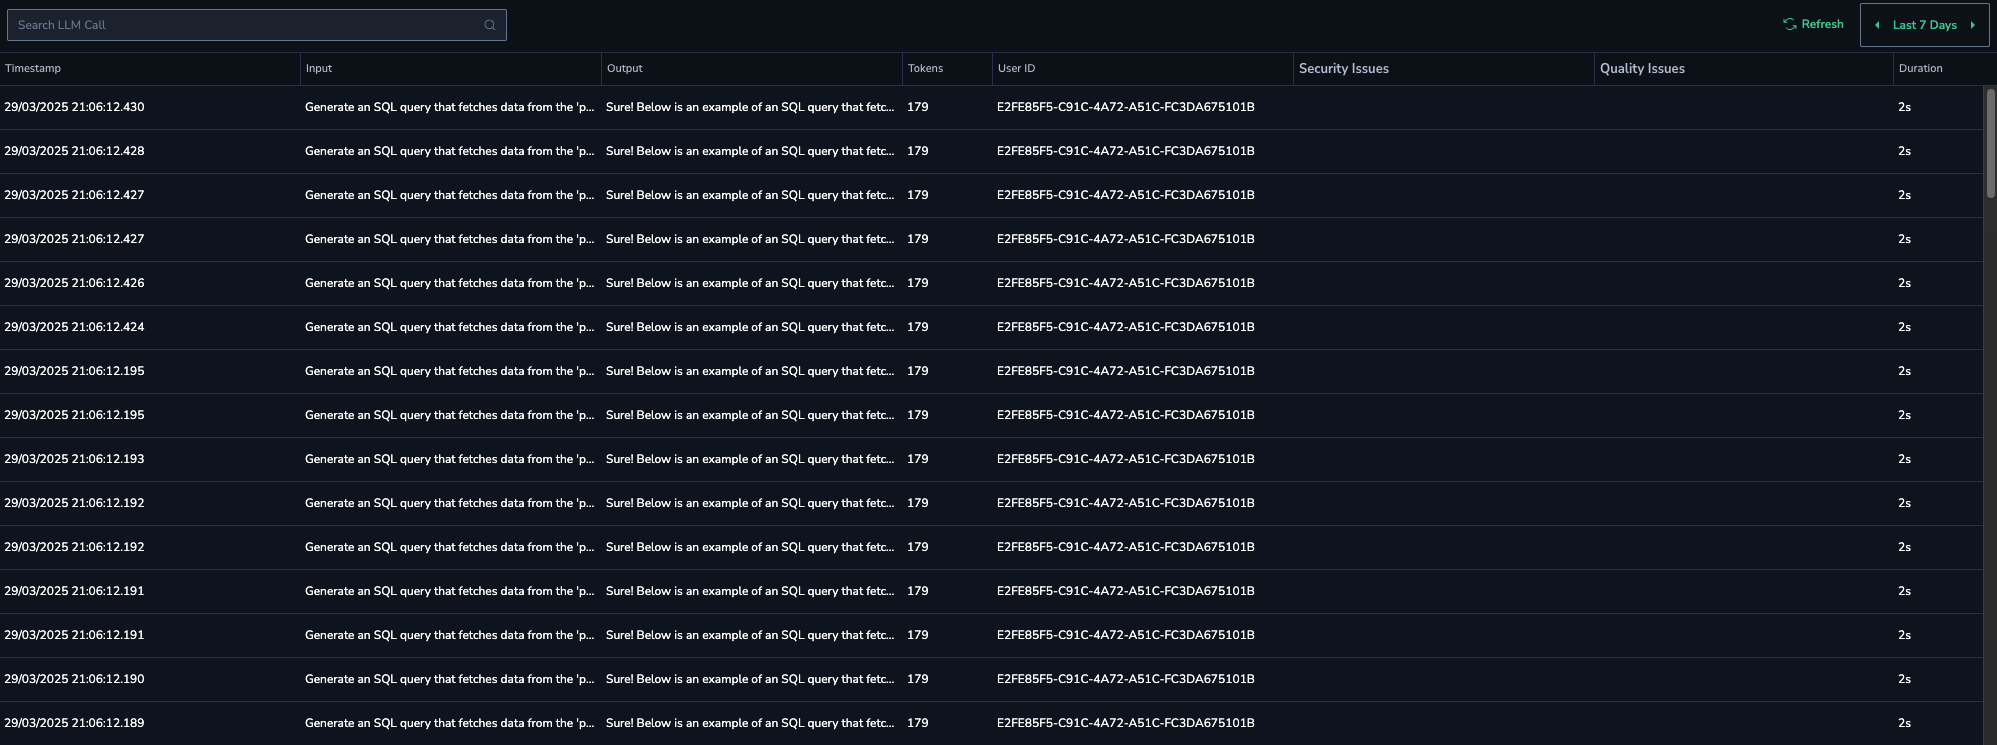
Viewing LLM span attributes
The main LLM Calls grid provides a comprehensive overview of all LLM spans, displaying the following call attributes:
- Timestamp – A digital record that indicates the exact time a call occurred.
- Input – The user input.
- Output – The LLM output.
- Tokens – The total token consumption during the span.
- Cost – The estimated call cost in USD.
- User ID – The ID of the user who made the call. See the End-user IDs section of the OpenID's Safety best practices for details.
- Security evals – High-score security evals detected during the call. Refer to Eval Catalog for the complete list of security evals.
- Quality evals – High-score quality evals detected during the call. Refer to Eval Catalog for the complete list of quality evals.
- Duration – The duration of the call.
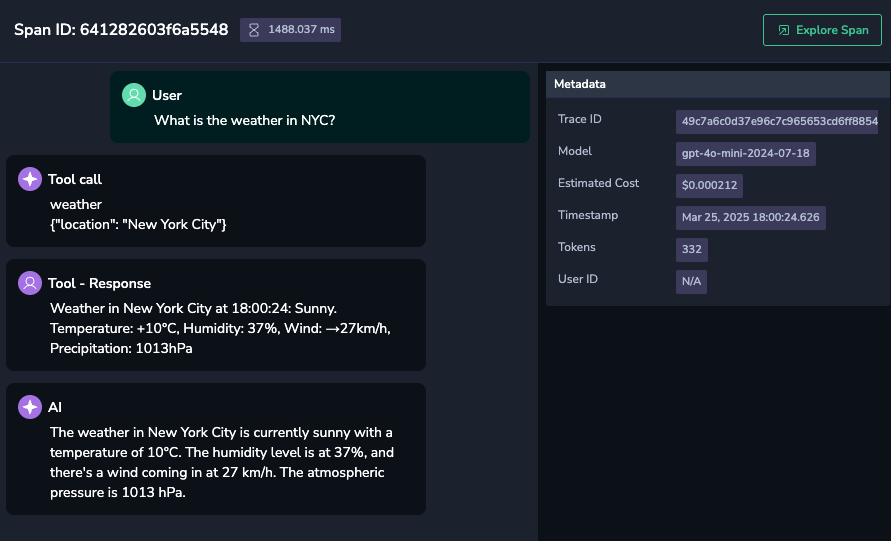
Uncovering span details
Dive deeper into each LLM call to uncover additional details, including the complete chat history, for a comprehensive understanding of the operation.
- In the LLM Calls grid, click on a call row to open a side panel with detailed information about the LLM span.
The call information is organized in several sections:
- Span ID and its duration.
- Conversation segments:
- System Prompt – A predefined instruction or context given to the LLM before generating a response, setting the behavior, tone, or constraints for the output.
- User prompt or response with detected evals, number of their occurrences, and scores.
- Tool Call with its name and parameter details.
- Tool Response.
- AI – The AI model's response delivered as the final output to the user.
- Metadata with the trace ID, models used in the span, estimated cost, etc.
Detected evaluations with scores, categorized as:
- Low – Low severity.
- High – High severity, also visible as issues on the AI Center Overview and Application Overview pages.
These evaluations can be identified in both prompts and responses.
Tools that were invoked in the current span.
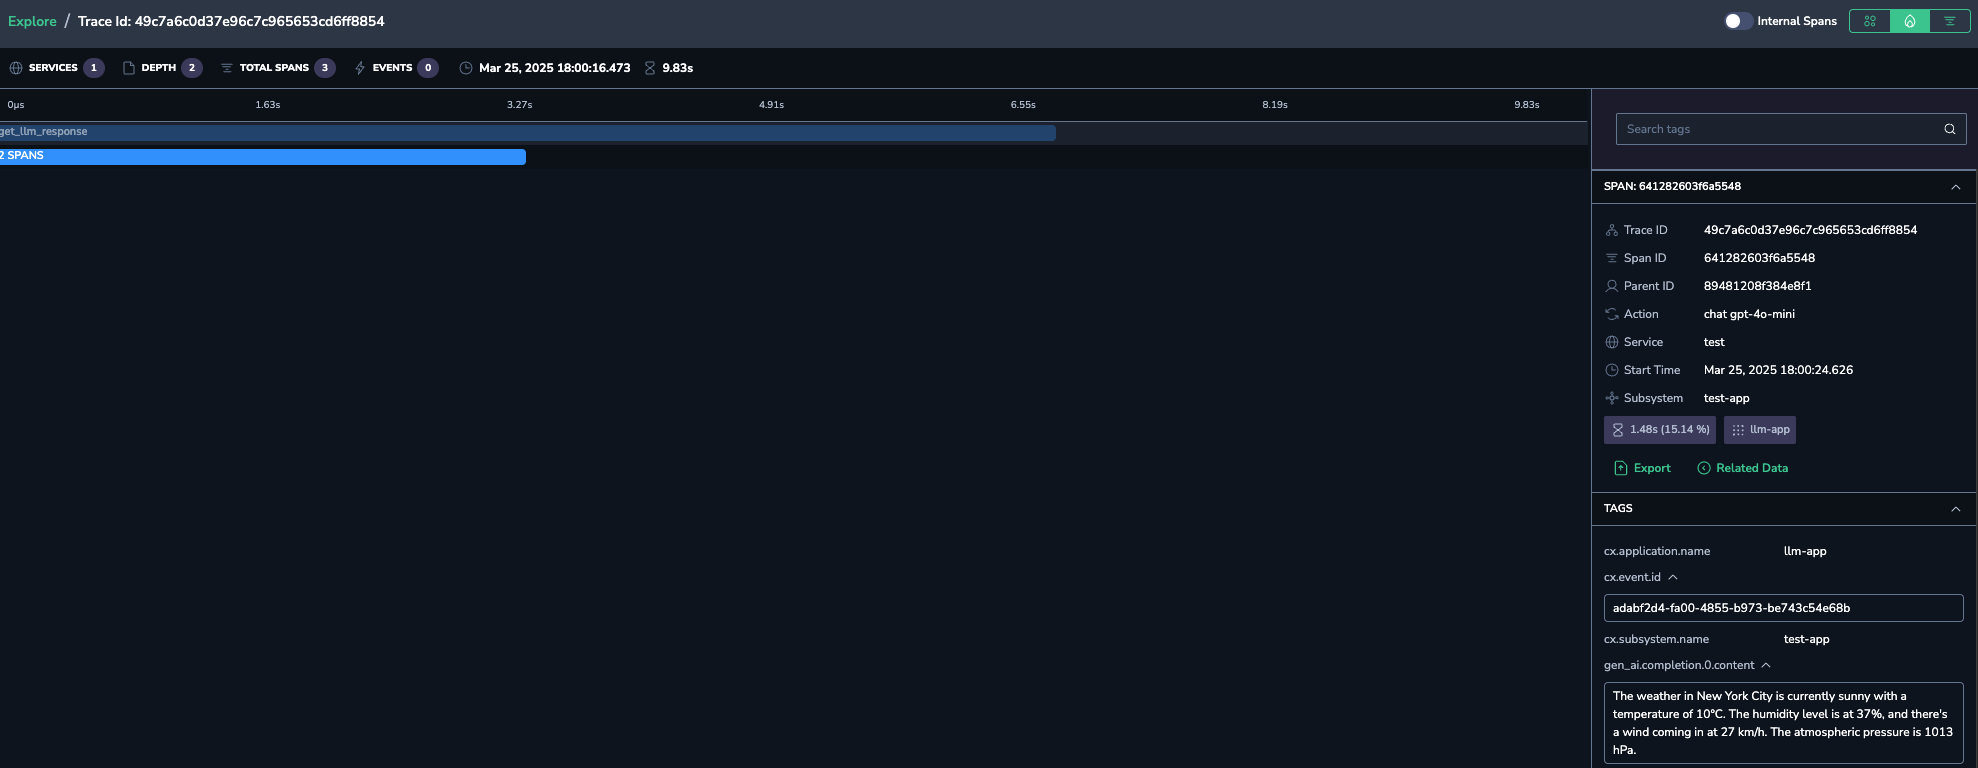
Exploring spans
Explore the AI interactions even further by tracing the flow of a transaction through a system. Tracing provides a detailed view of how a request moves through various components of a system, helping to identify bottlenecks and performance issues and understand the overall system behavior. Trace information is provided via the dedicated Tracing page in the Coralogix UI (Explore > Tracing).
- Click the Explore Span button to view and inspect the call-related trace on the Tracing page of the Coralogix UI.
- Switch between the different trace visualizations (Gannt, flame, etc.) to explore varied views of the span data.
- Additionally, in the span drill-down of the relevant trace, view LLM attributes (such as prompts, responses, etc.) presented as tags.