Service Level Objectives (SLOs)
Overview
A Service Level Objective (SLO) is a measurable target that defines the acceptable performance or reliability level for a service, often expressed as a percentage (e.g., 99% uptime or 95% request latency below a threshold). It represents an agreement between service providers and users on what "good enough" looks like.
Why are SLOs essential for APM?
In APM (Application Performance Monitoring), SLOs help teams prioritize and measure the health of their services in a user-focused way. They enable:
- Proactive issue management: Highlight potential problems before they affect user experience.
- Data-driven decisions: Align engineering efforts with user expectations by focusing on what matters.
- Efficiency: Avoid over-investing in unnecessary reliability, balancing business needs and operational costs.
- Accountability: Provide clear, measurable goals to monitor and improve service performance.
Creating an SLO
To begin tracking SLOs, add a new SLO to the system.
- From the SLO tab of a Service Catalog drill-down or the main Service Catalog tab, click + Add New SLO.
- From the Service dropdown, select the service or services to which the SLO will be applied.
- Select the SLO type: Error or Latency.
- Enter a name and optional description for the SLO.
Select the filters and threshold for your SLO.

Select the percentage and the period for which the SLO is valid. For example, 90% for 7 days means that the SLO is valid as long as the error rate over seven days is below 90%.
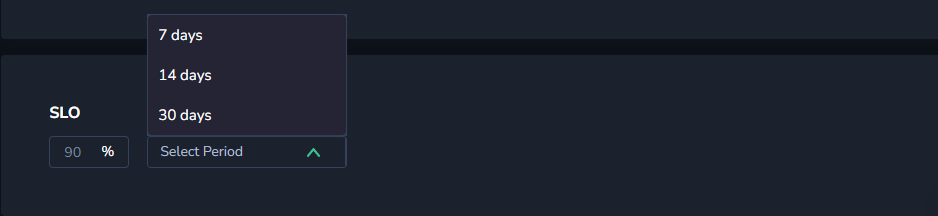
Click Add New to finish.
SLOs view
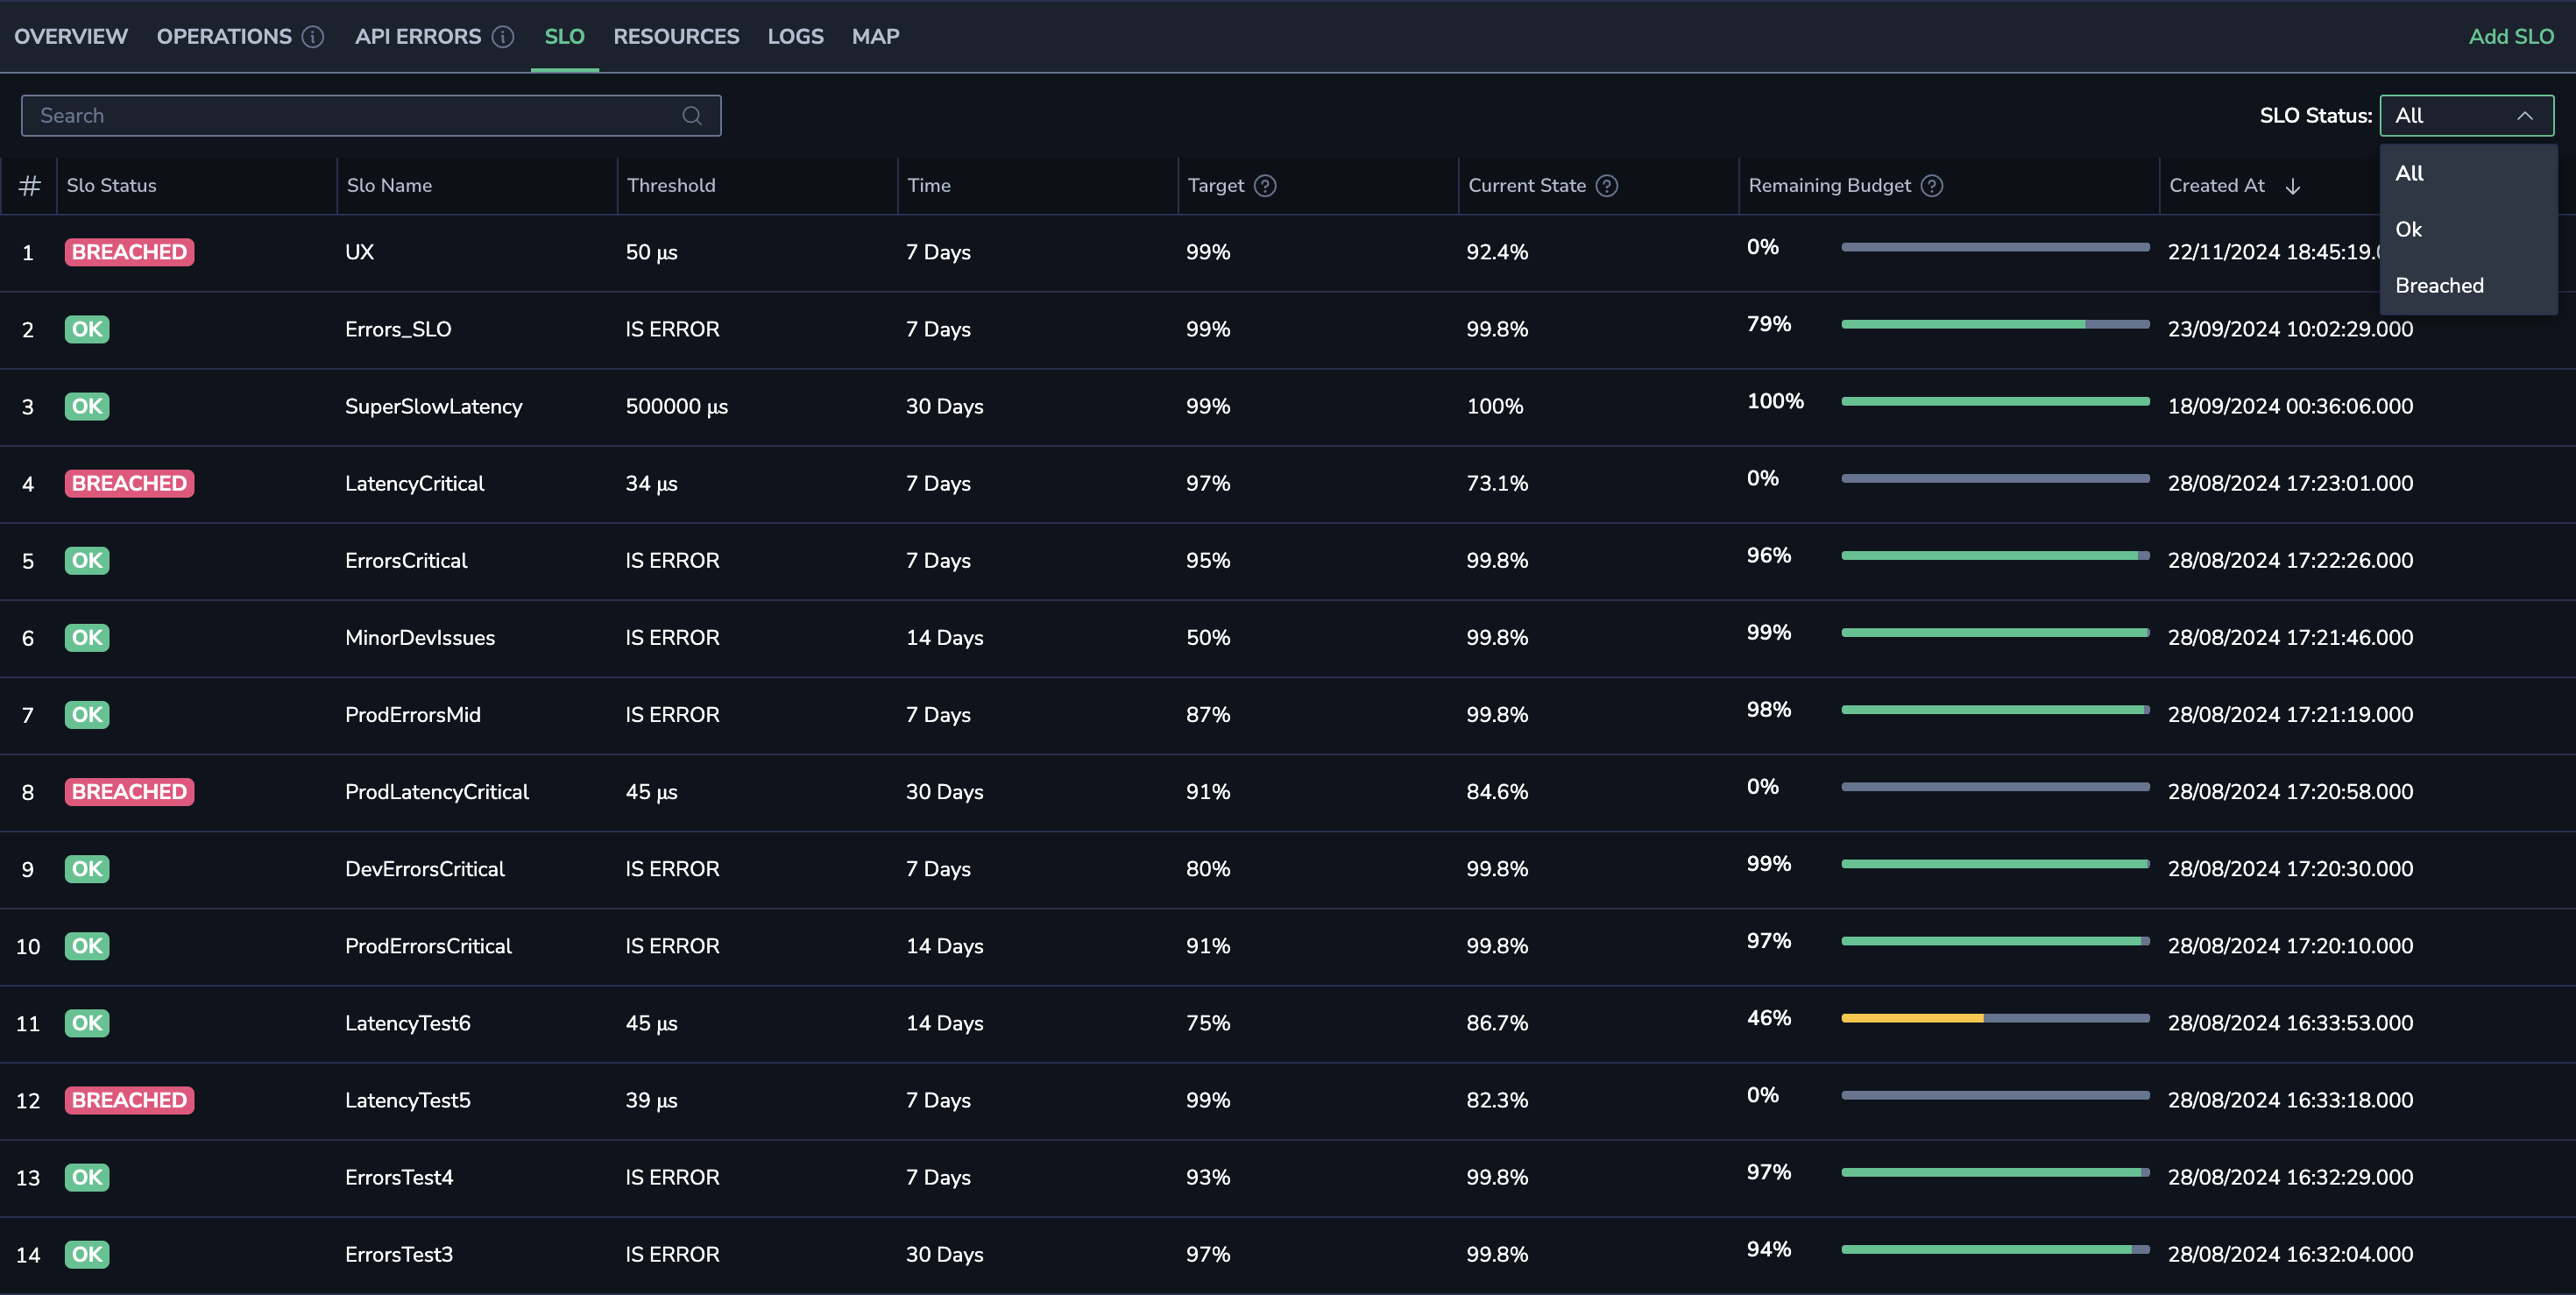
In the SLO tab of each service, you will find a list of your defined SLOs. Each row represents a single SLO, displaying its definition and status. The following columns are key to understanding the detailed status of your SLOs:
- SLO Status: Displays whether the SLO is in an "OK" or "Breached" state based on its current state and remaining errors budget.
- SLO Name: The name of the SLO as provided during its creation.
- Threshold: Specifies the allowable limit for each of the measured events. For SLOs on errors, the threshold will be
Is Error. For SLOs on latency, the threshold will be the maximum allowed duration. - Time: The defined evaluation period for the SLO, such as 7 days, 30 days.
- Target: Displays the predefined SLO target.
- Current State: Displays the real-time SLO status based on actual calculations.
- Remaining Budget: Displays the percentage of the allowable error or latency threshold remaining, along with a visual consumption bar. Your error budget is the allowable number of errors or latency threshold violations. The remaining budget shows the percentage left from this budget, with a visual bar indicator reflecting the budget consumption.
Error budget consumption bar
A color bar is used for visualization of the error budget consumption. This bar provides an at-a-glance overview of the current state of your error budget, helping you quickly assess the health of your SLOs.
By combining these metrics and visual indicators, the SLOs tab offers a comprehensive view of your service-level objectives, empowering you to monitor and manage them effectively.
- Green: 75%-100% of the allowed budget remaining.
- Yellow: 25%-75% of the allowed budget remaining.
- Orange: 0%-25% of the allowed budget remaining.
SLO drill-down
Click on each of the SLOs to get real time tracking of SLO events (spans) that affects your remaining SLO budget.
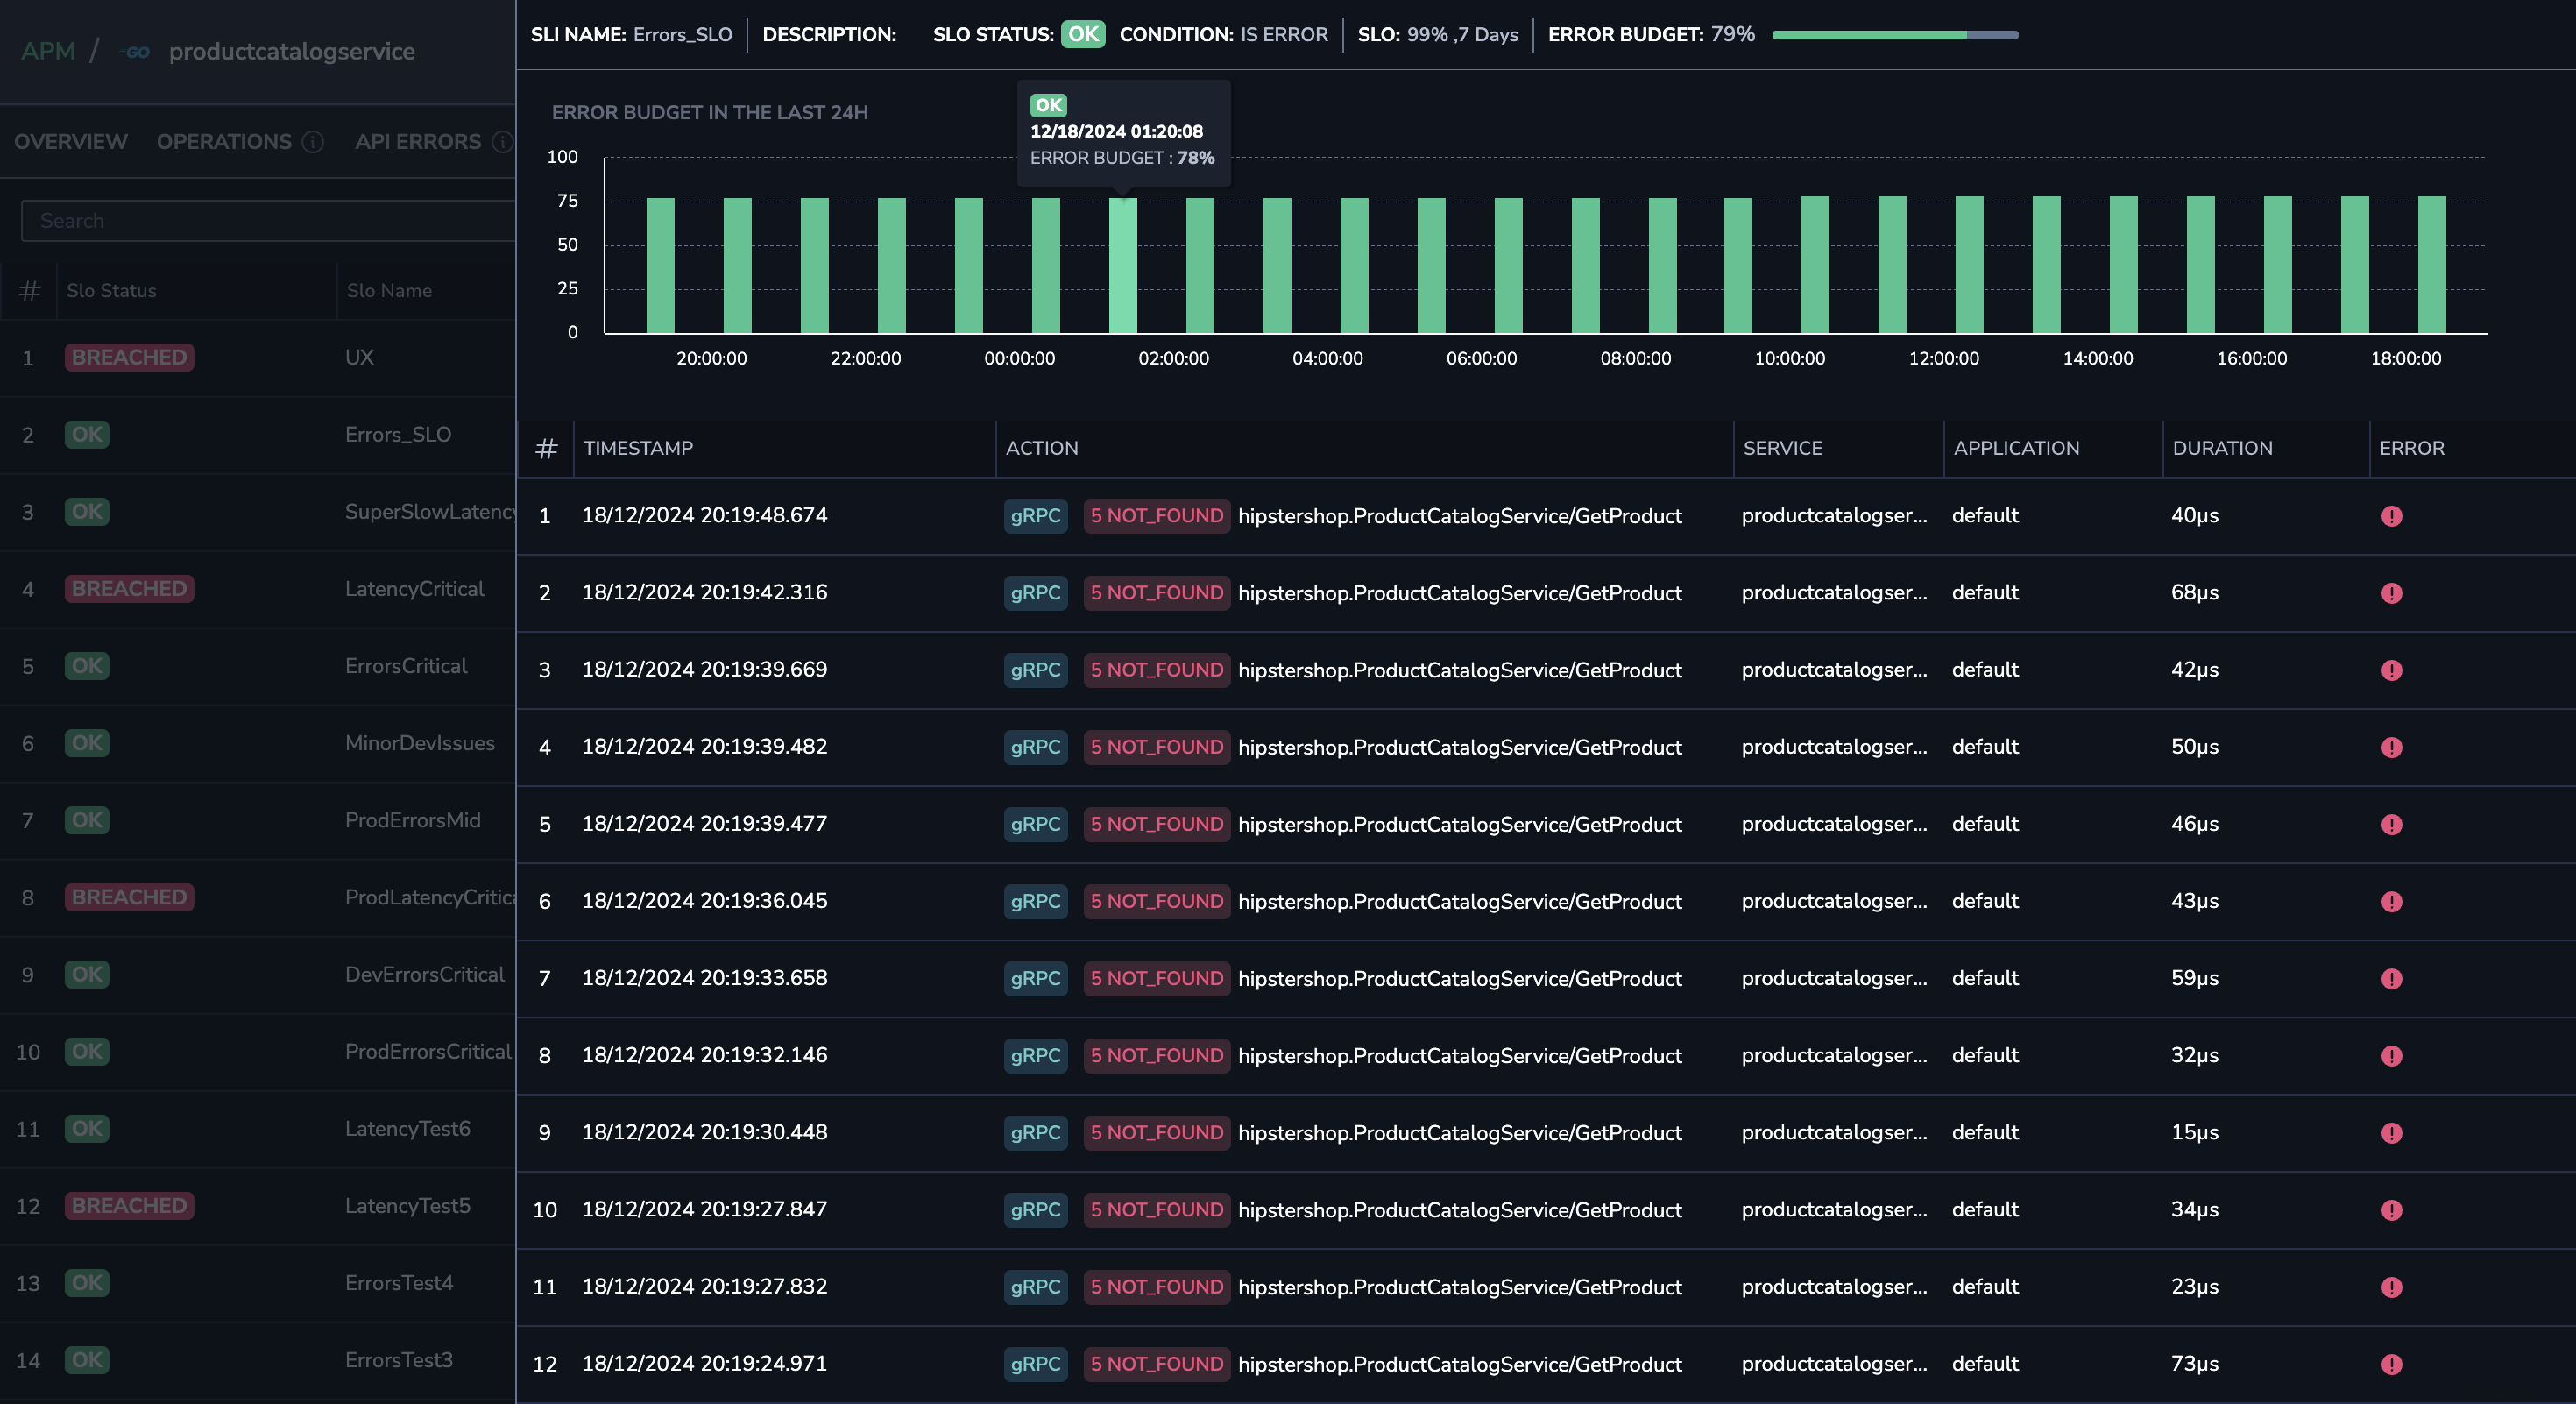
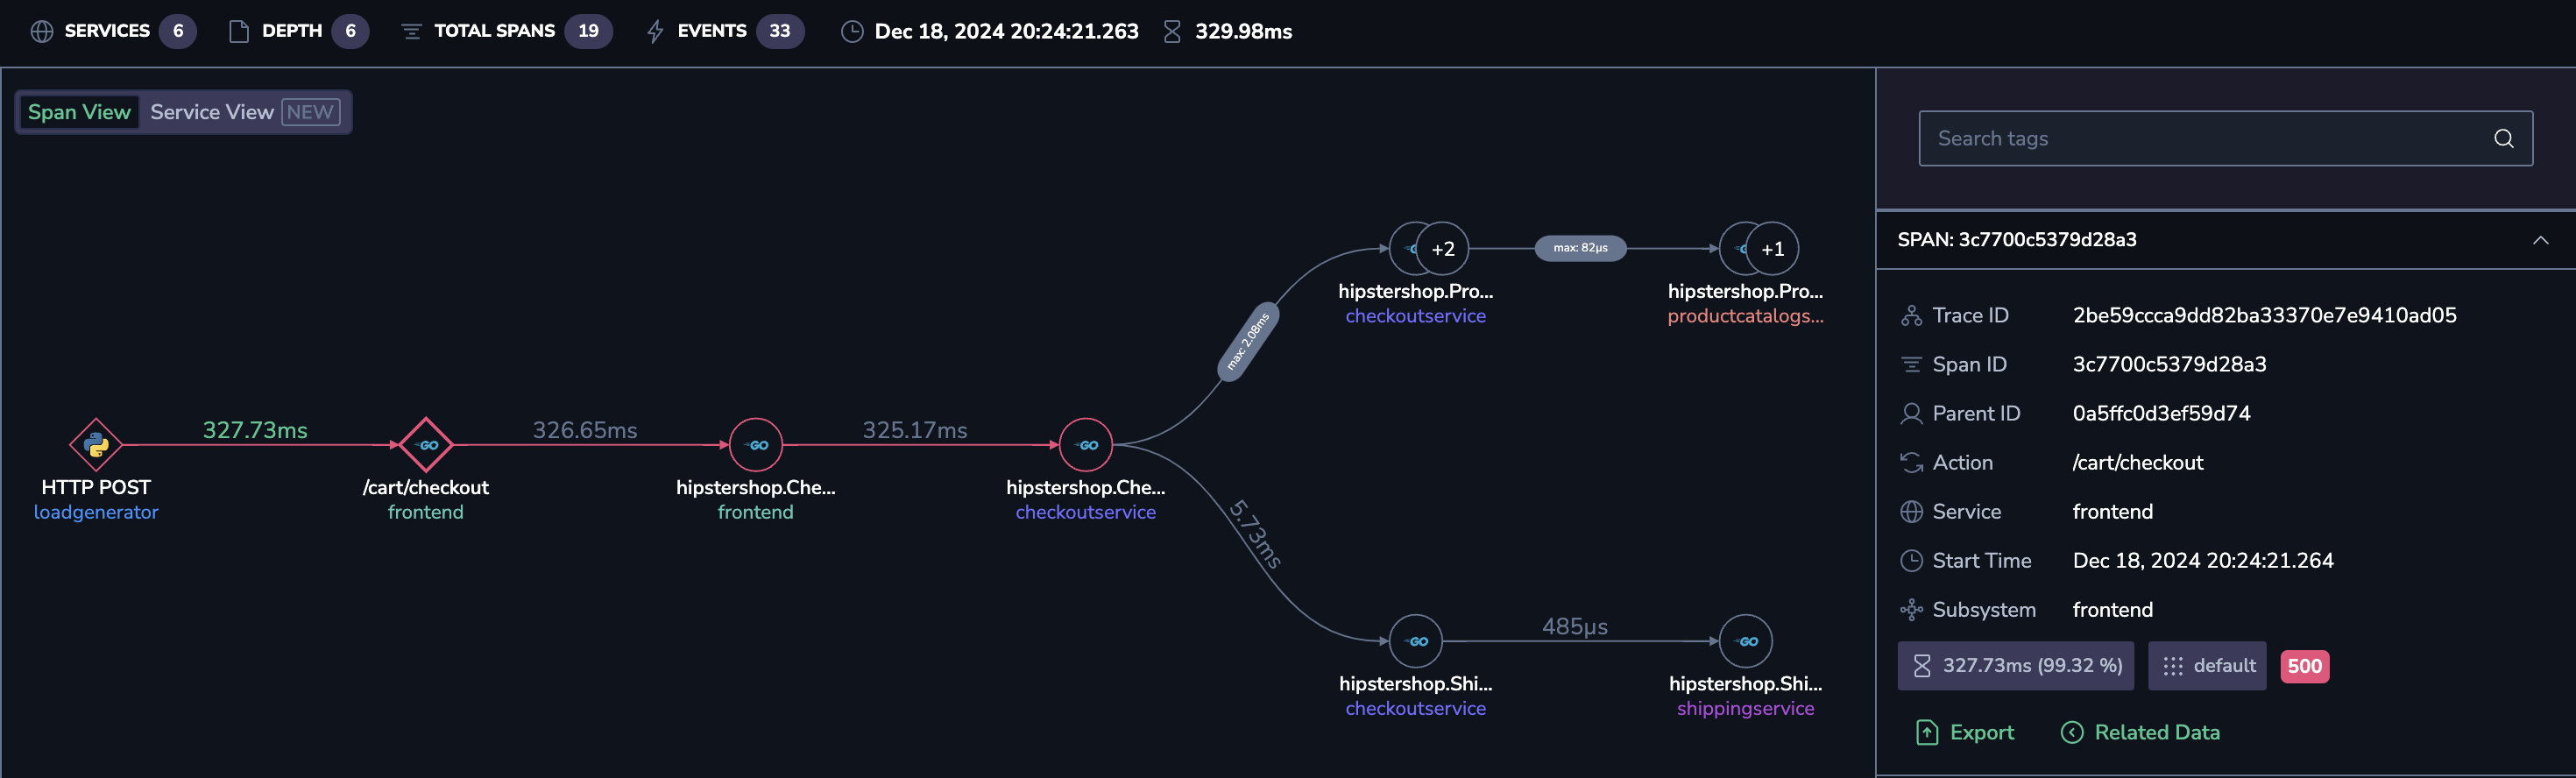
Click on these events to view an example of the traces where the threshold violation occurred.
Note
- Only team admins can add new SLOs.
- New SLOs take at least seven days for their computation window to complete.
- Until completed, the SLO will display incomplete data.
SLO calculation example
- SLO target: 99%. The target is set to ensure that 99% of requests meet the defined success criteria over a 7-day period.
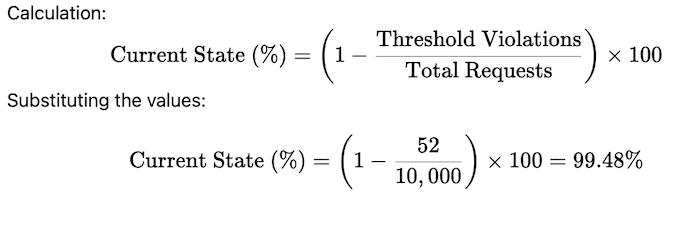
- Current state: 99.48%. Based on the data for the last 7 days:
- Total Requests: 10,000
- Threshold Violations: 52
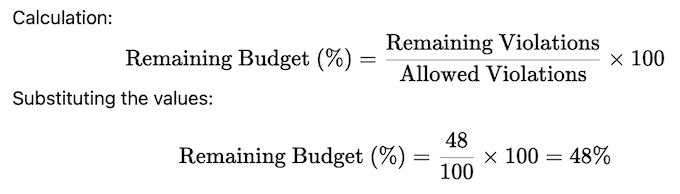
Remaining budget: 48%
The error budget defines the allowable number of threshold violations within the 7-day period.
- Allowed Violations: 100 (1% of 10,000 requests)
- Remaining Violations: 48 (100 - 52 violations)
Additional resources
| Coralogix Academy | SLO/SLI Management in Coralogix APM |
| API | SLO Management API |
| Terraform | Terraform registry |
Support
Need help?
Our customer success team is available 24/7 to walk you through your setup and answer any questions that may come up.
Feel free to reach out to us via our in-app chat or by sending us an email to support@coralogix.com.