Welcome to Continuous Profiling
Applications often behave unpredictably in production due to factors like unexpected user requests, configuration changes, security constraints, traffic spikes, and edge cases. These variations can cause excessive CPU and memory usage, increasing costs and degrading user experience. While external metrics such as CPU load, memory consumption, request volume, and latency provide some visibility, they do not reveal what is happening inside the code.
Continuous Profiling bridges this gap by offering real-time insights into code execution, helping identify resource-heavy and time-consuming operations. By continuously analyzing performance in any environment—especially in production, where real-world conditions are challenging to replicate—profiling enables developers to detect inefficiencies, optimize code, reduce infrastructure expenses, and enhance application performance. The image below displays the main Profiling Explore screen.
What is Continuous Profiling?
Continuous Profiling is a method for analyzing how software behaves over time by collecting data on its execution. This includes measuring function execution times, memory and CPU usage, and other system resource consumption along with relevant metadata.
Leveraging OpenTelemetry’s profile signal, Continuous Profiling enables teams to correlate resource inefficiencies or performance issues beyond a specific service or pod, offering granular insights into application behavior.
Why use it?
Traditional profiling tools are often used during development to optimize performance, but they come with challenges that make them impractical in production:
- High resource consumption and performance impact due to instrumentation
- The need for service restarts, causing disruptions
- Limited visibility into third-party libraries
In contrast, Continuous Profiling runs in the background with minimal overhead, delivering real-time insights without requiring issue replication in test environments. This helps SREs, DevOps teams, and developers better understand how code impacts performance and infrastructure costs.
With Continuous Profiling, teams can:
- Capture code-level performance data automatically, without manual instrumentation
- Detect inefficient code paths by storing, querying, and analyzing profiling data over time
- Pinpoint performance bottlenecks down to the exact function or line of code causing inefficiencies
- Gain deep visibility into application runtime behavior
Continuous Profiling with Coralogix
Coralogix Continuous Profiling agent is a lightweight, always-on tool that delivers deep visibility into code execution with minimal system overhead. It identifies which functions consume the most CPU time, enabling developers to enhance performance and lower infrastructure costs.
The feature integrates into Coralogix’s Application Performance Monitoring (APM), complementing Infrastructure Explorer, Distributed Tracing, and Real User Monitoring, among other features.
Supported runtimes and languages
Coralogix Continuous Profiling works across various programming languages, including:
- C/C++
- Rust
- Zig
- Go
- Java
- Python
- Ruby
- PHP
- Node.js / V8
- Perl
- .NET
By providing continuous, low-overhead profiling, this approach enables teams to optimize performance proactively without disrupting services.
Beyond tracing
The key distinction between tracing and profiling is that tracing identifies which service-level requests are slow, while profiling reveals why they are slow at the code level. Tracing helps track request latency across services, showing how requests flow through different components. Profiling goes deeper, providing visibility into resource usage at the code level.
Tracing captures when a method starts and stops, offering insights into request execution time. However, it doesn’t measure how much CPU or memory a request consumes. This is where continuous profiling adds value—it periodically samples system resource usage at runtime, capturing 20 stack traces per second (20 Hz) and reporting collected data every 5 seconds. This allows teams to analyze performance continuously without replicating issues in test environments.
Example: Debugging slow responses
Imagine a service called book-catalog-api, responsible for retrieving book details from a database. Users report slow response times when searching for books or fetching metadata. To optimize performance, the development team uses Coralogix’s APM and Distributed Tracing to investigate.
Tracing might reveal that a request takes longer than expected due to multiple database queries. However, if a trace shows a delay without obvious bottlenecks—such as missing spans or unexplained latency—profiling provides deeper insights. By analyzing stack traces and resource usage, continuous profiling can uncover issues like CPU-intensive operations, memory inefficiencies, or inefficient loops in the code.
By combining tracing and profiling, teams gain both high-level visibility into request flows and granular insights into resource consumption, enabling more effective performance optimizations.
| APM | Continuous Profiling | |
|---|---|---|
| Scope of visibility | Tracks service-level interactions and third-party API calls | Provides in-depth analysis of all code execution, including methods |
| Measurement focus | Monitors request patterns, error rates, and latency | Evaluates CPU resource usage |
| Visualization (Flame/icicle graphs) | Displays time spent on execution paths across multiple services, highlighting latency and errors | Shows a detailed breakdown of resource consumption per minute, categorized by method |
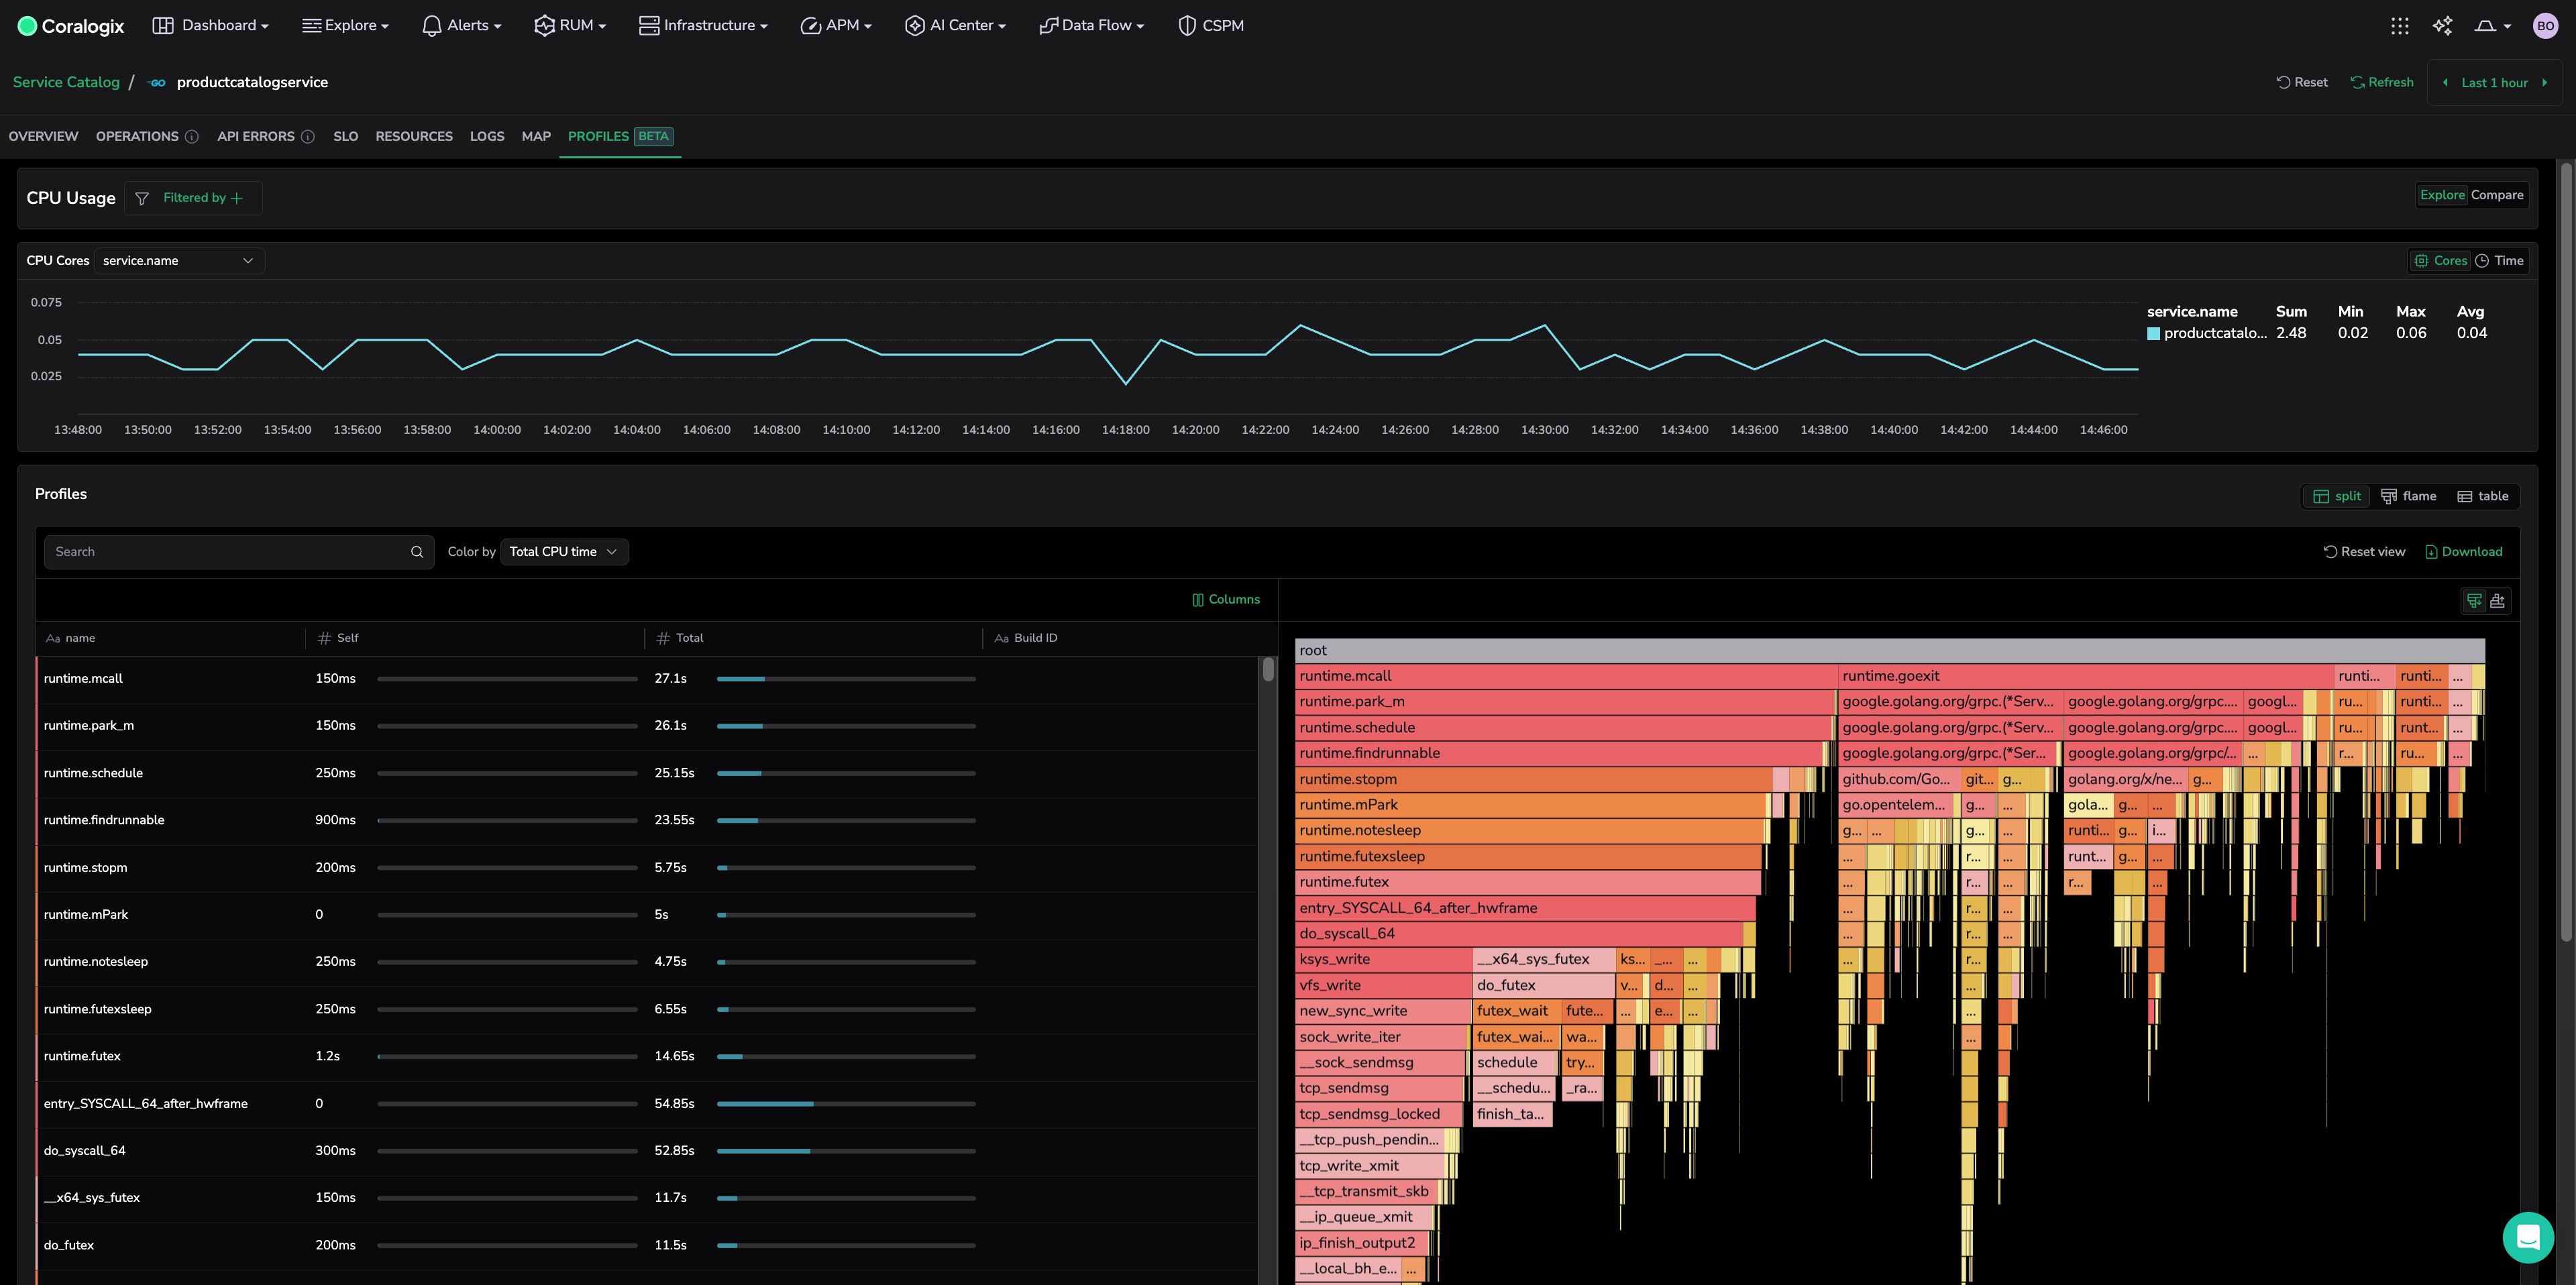
Visualizing profiles to monitor CPU consumption
Within the APM Service Catalog drill-down, users can seamlessly view the profiles for a particular service. The Profiles UI provides a detailed view of resource consumption, highlighting which methods contribute most to performance issues. Different profile types are available depending on the runtime and programming language. Initially, the focus is on CPU time, which represents the time spent executing CPU-intensive tasks.
What you'll find
This article set includes:
- Set up Continuous Profiling with Kubernetes
- Profiles catalog
- Upload debug symbols
- Supported languages
- Monitor CPU consumption
- Compare profiles
- Permissions
Next steps
Get started by setting up Continuous Profiling with Kubernetes.