Ask Olly about a span or trace
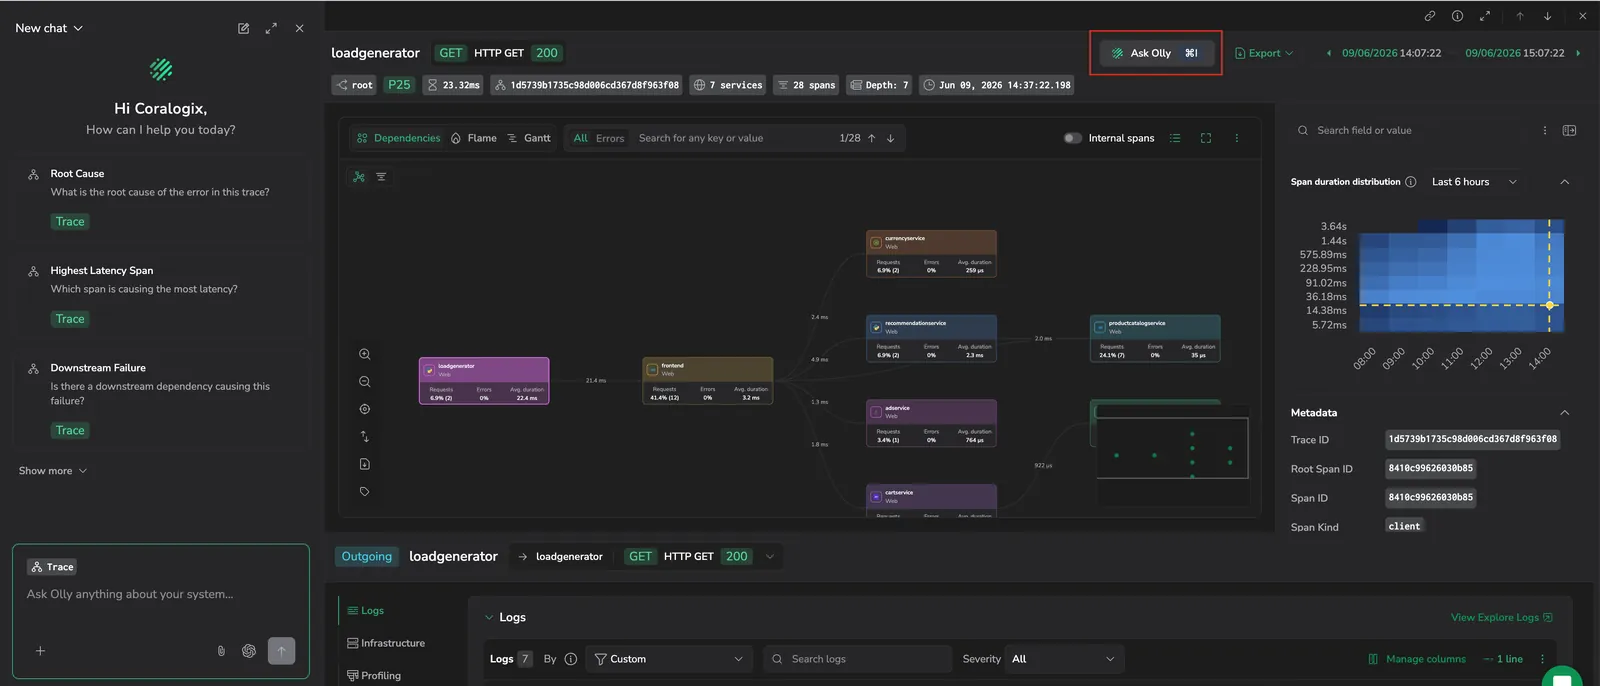
Start an Olly investigation directly from a trace drilldown. Olly carries the trace ID and the fields of the span you have selected as context, so it can answer questions about the exact request you're looking at — no need to paste a trace ID or describe what you've already seen.
The Ask Olly drawer works the same way wherever you open the trace drilldown — from Explore Tracing, from a service in APM, or from a session, page view, or error in RUM. The drawer carries the same trace context and surfaces the same 5 suggested queries in every entry point.
What you need
- Olly turned on for your account. If the Ask Olly button shows a lock icon, contact your team admin or see Enable Olly.
Open Ask Olly from the trace drilldown
In the spans table, select the row for the span you want to investigate.
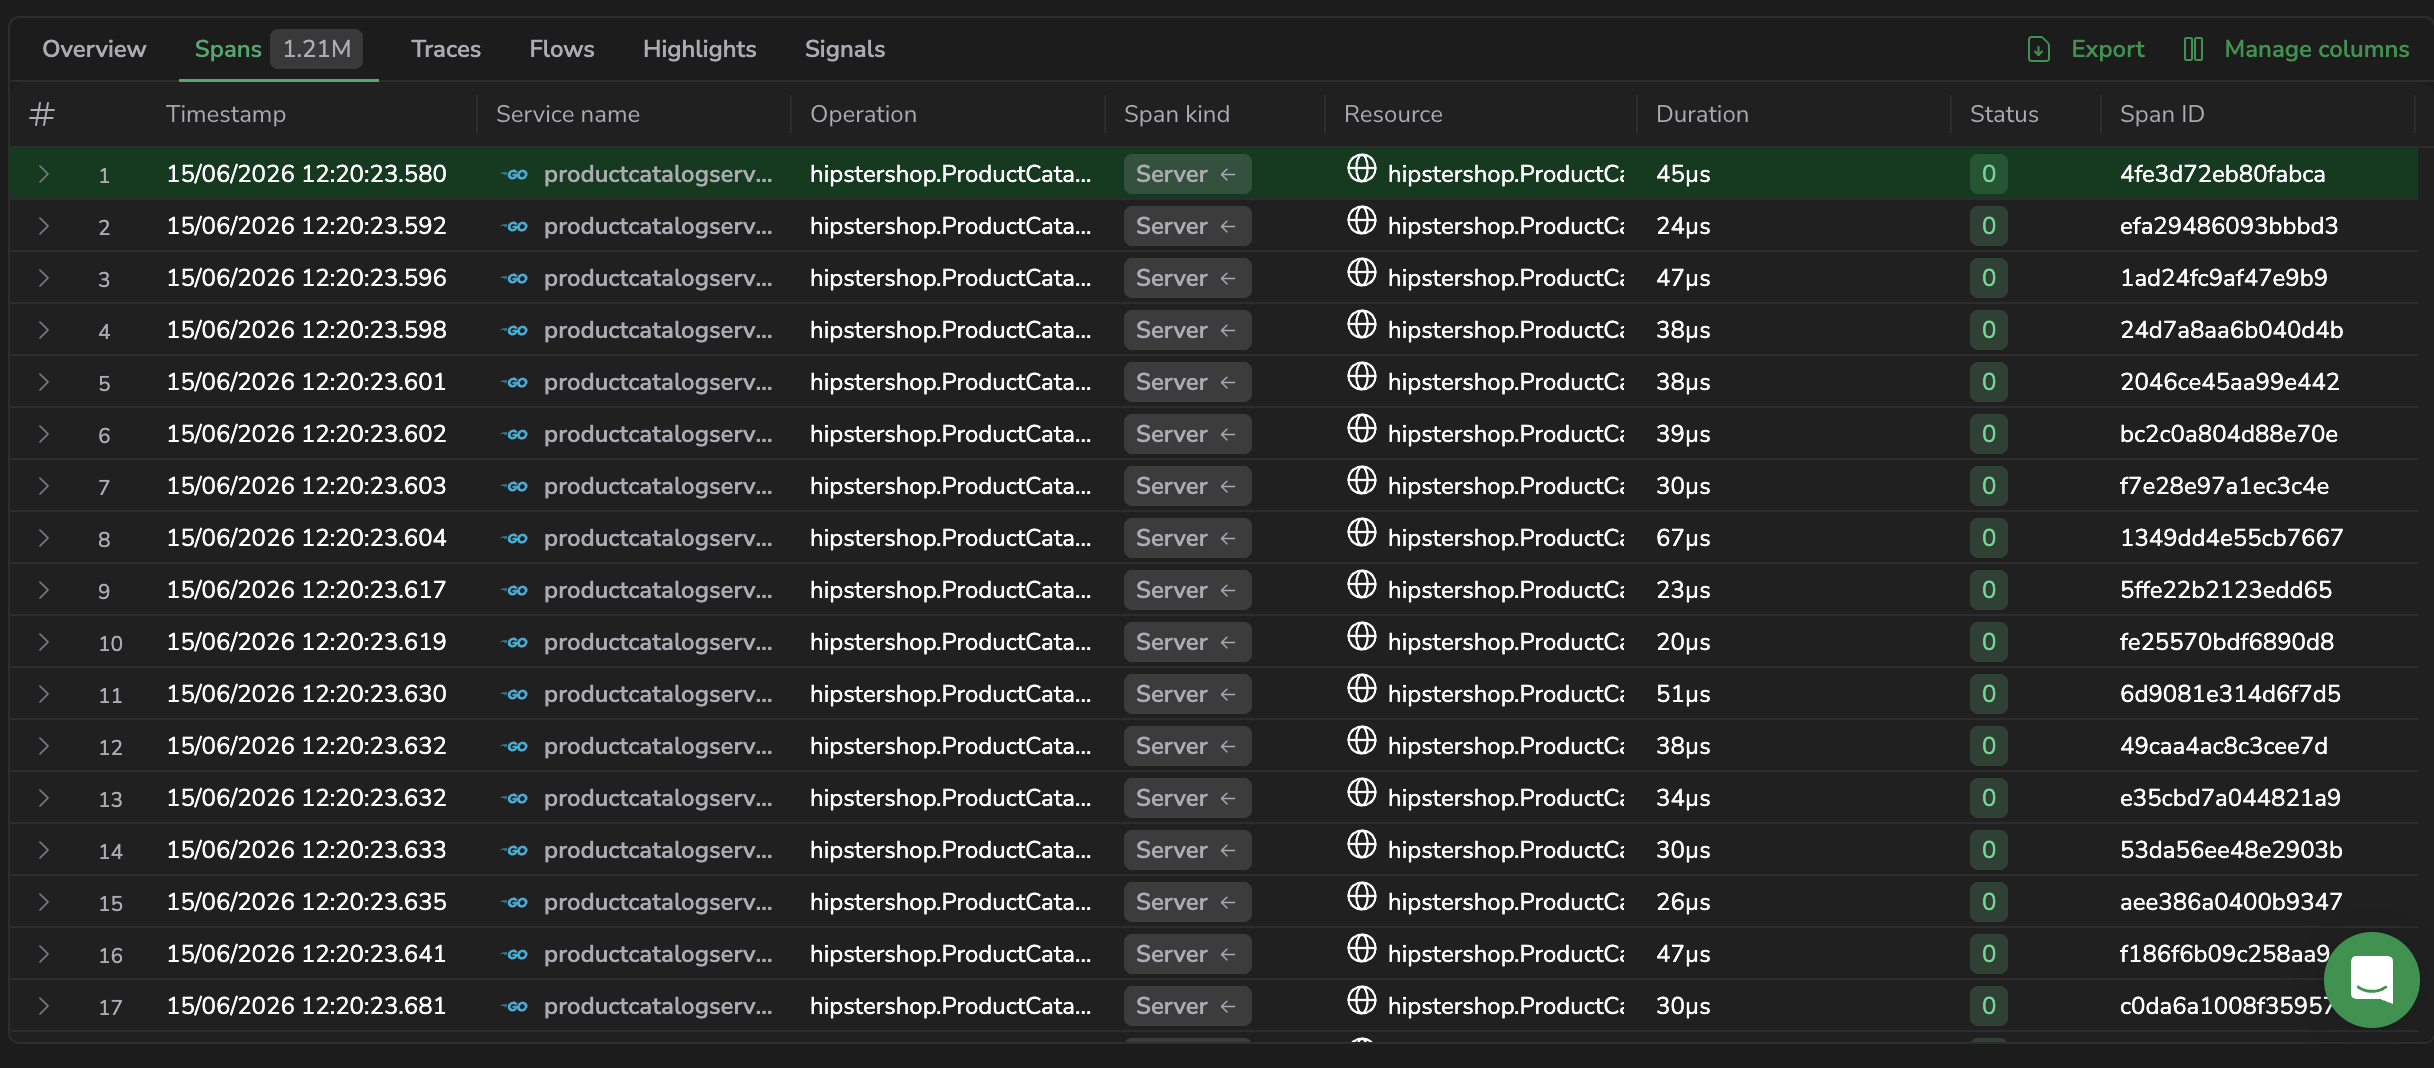
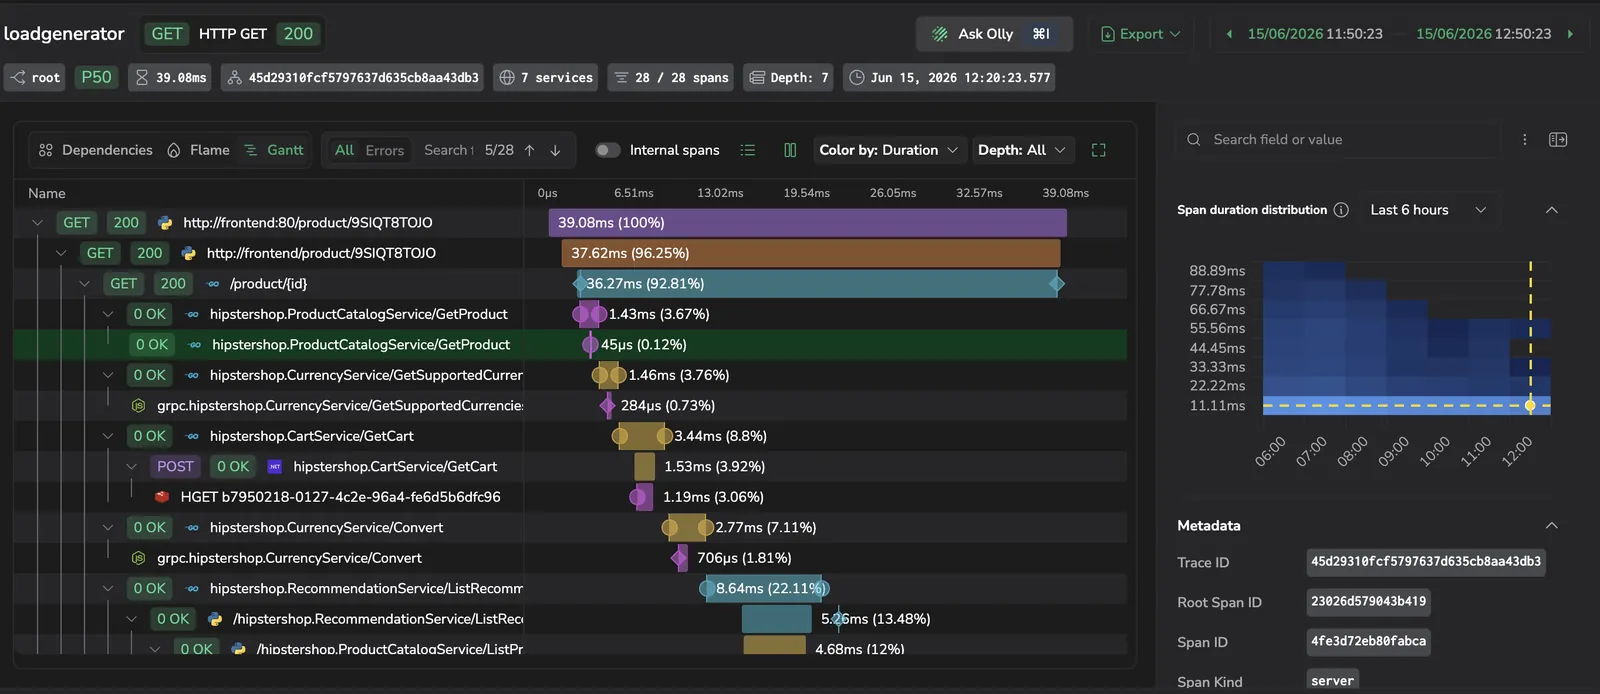
The trace drilldown opens with that span in focus. The Ask Olly button sits in the drilldown header, next to Export.
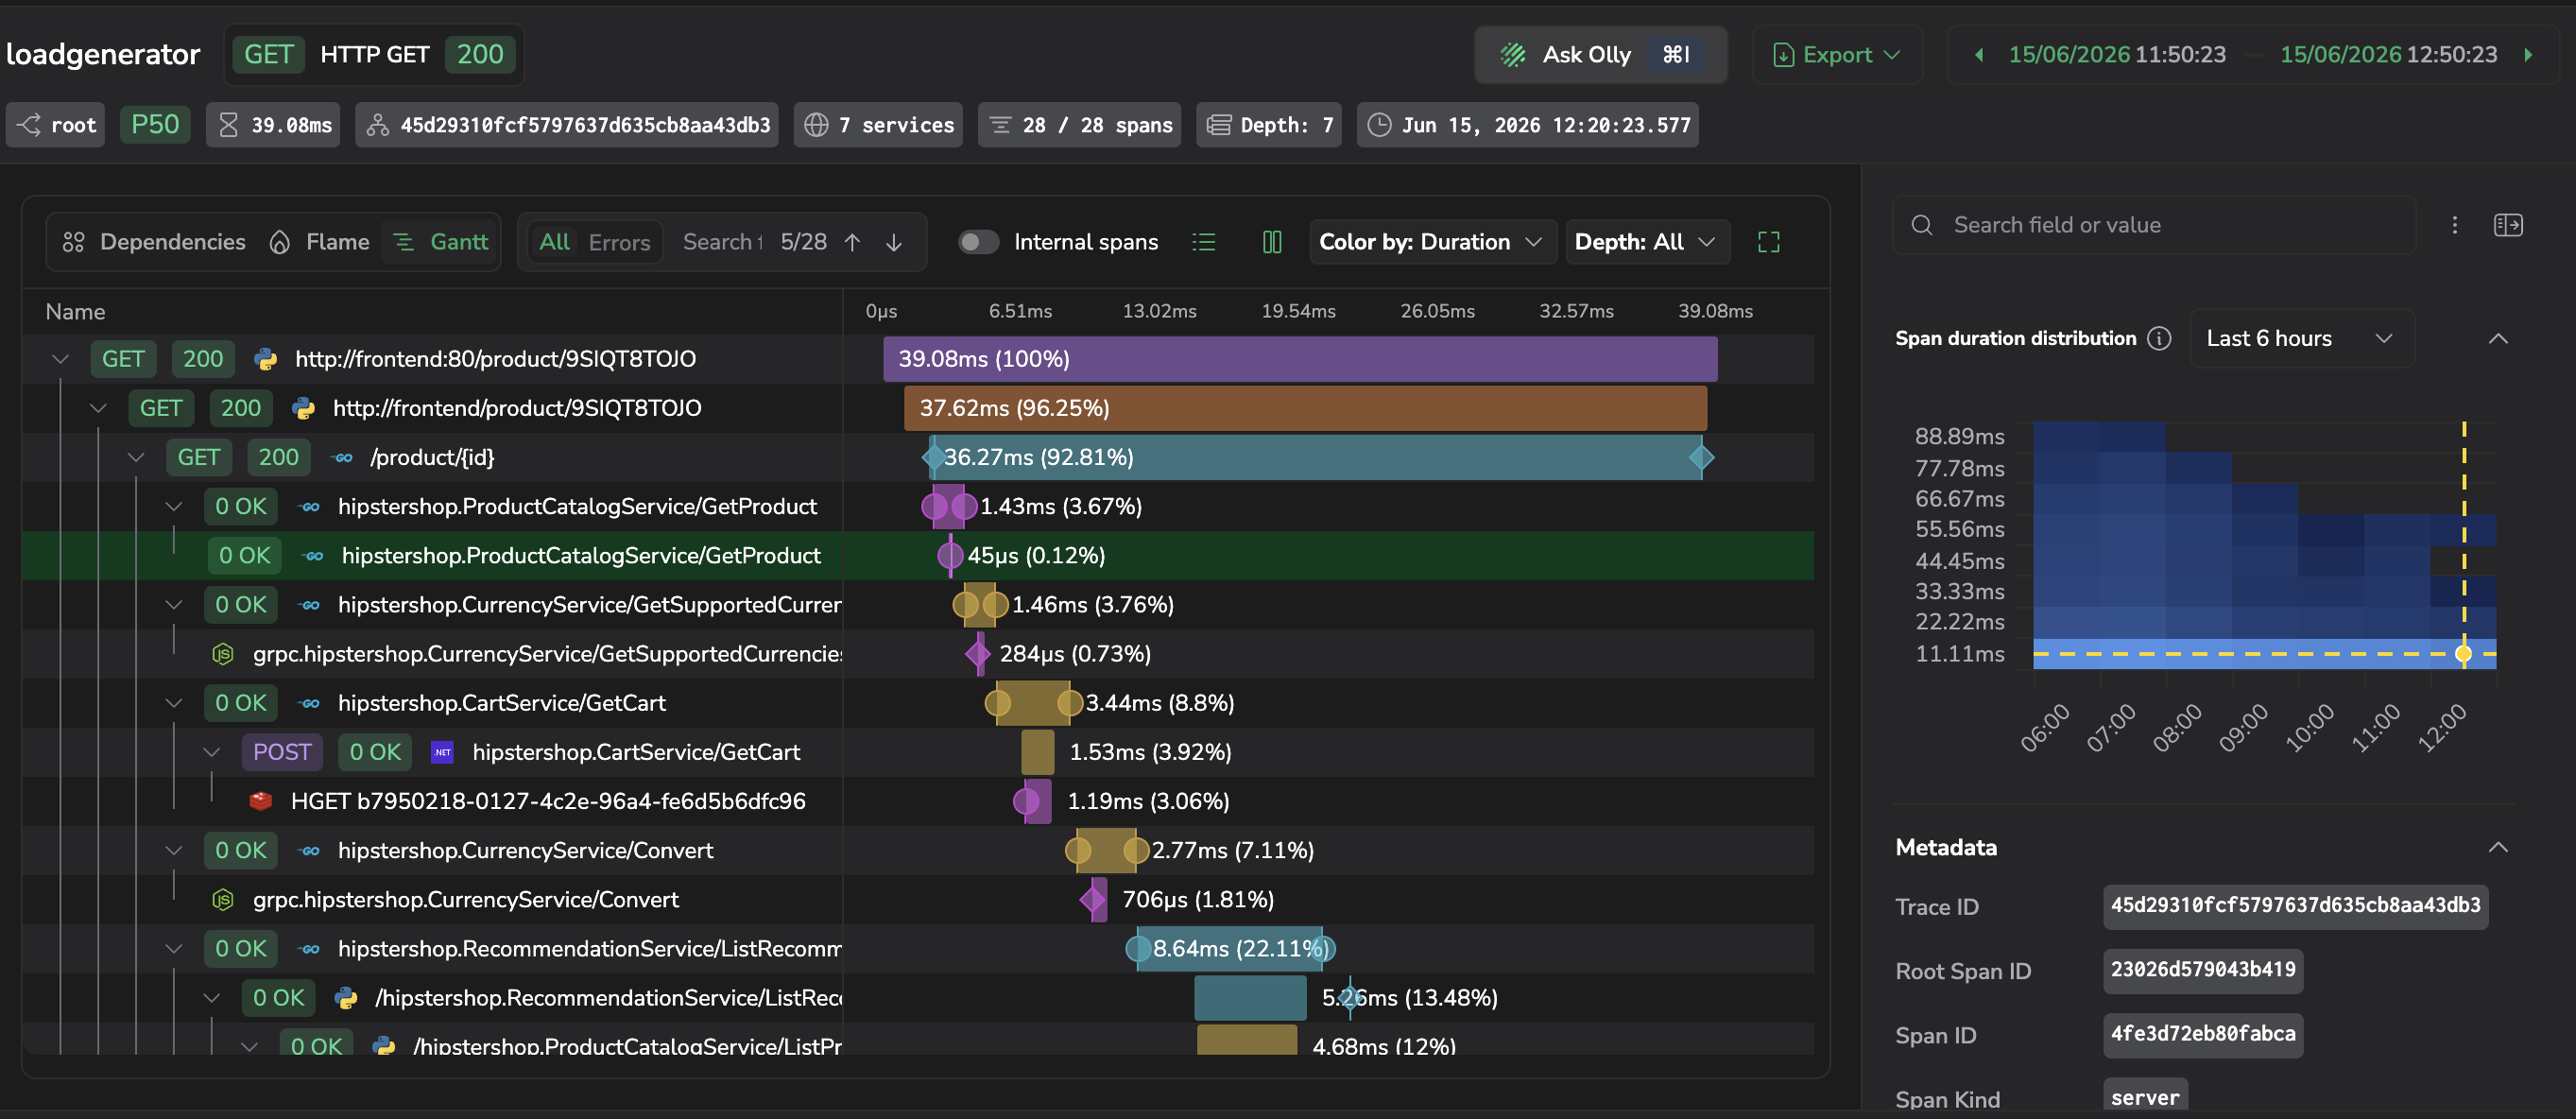
Select Ask Olly, or use the keyboard shortcut
Cmd+I/Ctrl+I. The drawer opens with a Trace context chip already attached.

The chip carries:
- The trace ID.
- The selected span's operation, service, application, subsystem, duration, start time, and parent span ID.
The chip stays attached as you switch spans inside the drilldown. Close the drilldown to clear it.
Select a suggested query
The drawer surfaces 5 common trace-investigation queries. Select one to run it against the current trace — no typing required. The first 3 appear by default. Select Show more to reveal the remaining 2.
| Query | What it identifies | When to use it |
|---|---|---|
| Root Cause — "What is the root cause of the error in this trace?" | The deepest failing span, prioritizing uncaught exceptions, OTel ERROR status, and HTTP/gRPC error codes. | A span shows red or the trace failed and you want the originating error, not a downstream symptom. |
| Highest Latency Span — "Which span is causing the most latency?" | The span contributing the most to total trace duration, compared against historical p95 for similar spans. | The trace is slow and you need to know which operation to optimize. |
| Downstream Failure — "Is there a downstream dependency causing this failure?" | Cascading timeouts, retry loops, and unavailable downstream services across the trace. | One service in the trace is failing and you suspect an upstream call (database, queue, third-party API). |
| Deployment Cause — "Was this caused by a recent deployment?" | Recent version changes on the involved services and whether latency or error rates regressed after deploy. | The trace looks worse than usual and a release went out recently. |
| Next Debug Step — "What should I check next to debug this?" | The most useful next signal — logs, span events, profiling, infrastructure metrics, or a linked trace — based on what data exists for this trace. | You're not sure where to look next or you want to confirm you haven't missed an obvious next step. |
Pick a query for the question you're answering
flowchart LR
    A[What are you<br>investigating?] --> B{Symptom}
    B -->|Error or failure| C[Root Cause]
    B -->|Slow trace| D[Highest Latency Span]
    B -->|One service failing| E[Downstream Failure]
    B -->|Just after a release| F[Deployment Cause]
    B -->|Not sure where to start| G[Next Debug Step]
Ask a custom question
You can type any question into the composer. The trace context stays attached, so Olly answers in the scope of the current trace and span. Examples that work well:
- "Why is the
S3.GetObjectspan the slowest in this trace?" - "Compare this trace's latency to the average for
checkout-serviceover the last 24 hours." - "Summarize the error chain in three sentences."
Olly's answer renders in the drawer alongside the trace. From the answer you can open correlated logs, events, profiling, or infrastructure data for any span Olly references.
Change the span in focus
Select a different span in the Gantt chart while the drawer is open. The Trace chip updates to carry the newly selected span's fields, so your next question targets that span without having to reopen the drawer.
When Ask Olly is unavailable
If your team admin hasn't turned on AI for the account, the Ask Olly button shows a lock icon and stays inactive. Point your admin to Enable Olly — turning on AI activates the button for everyone with Olly access.
Related resources
- Trace drilldown overview — what each area of the drilldown shows.
- Headers and quick actions — other shortcuts available from the drilldown header.
- Span related data — open logs, events, profiling, and infra for a span Olly references.
- Olly overview — how Olly works across logs, metrics, traces, and alerts.