Getting Started with Kubernetes Monitoring
Getting started
To use Infrastructure Explorer, begin by setting up the Kubernetes Complete Observability Integration. This integration collects logs, metrics, metadata, and traces across your Kubernetes environment.
To get started:
Set up the integration in Coralogix
- Access Data Flow > Integrations.
- From the Integrations section, select Kubernetes Complete Observability.
On the Kubernetes Complete Observability integration page, click + Setup Collector to create a new integration. For existing integrations, click the arrow icon on the right to upgrade to the new version.

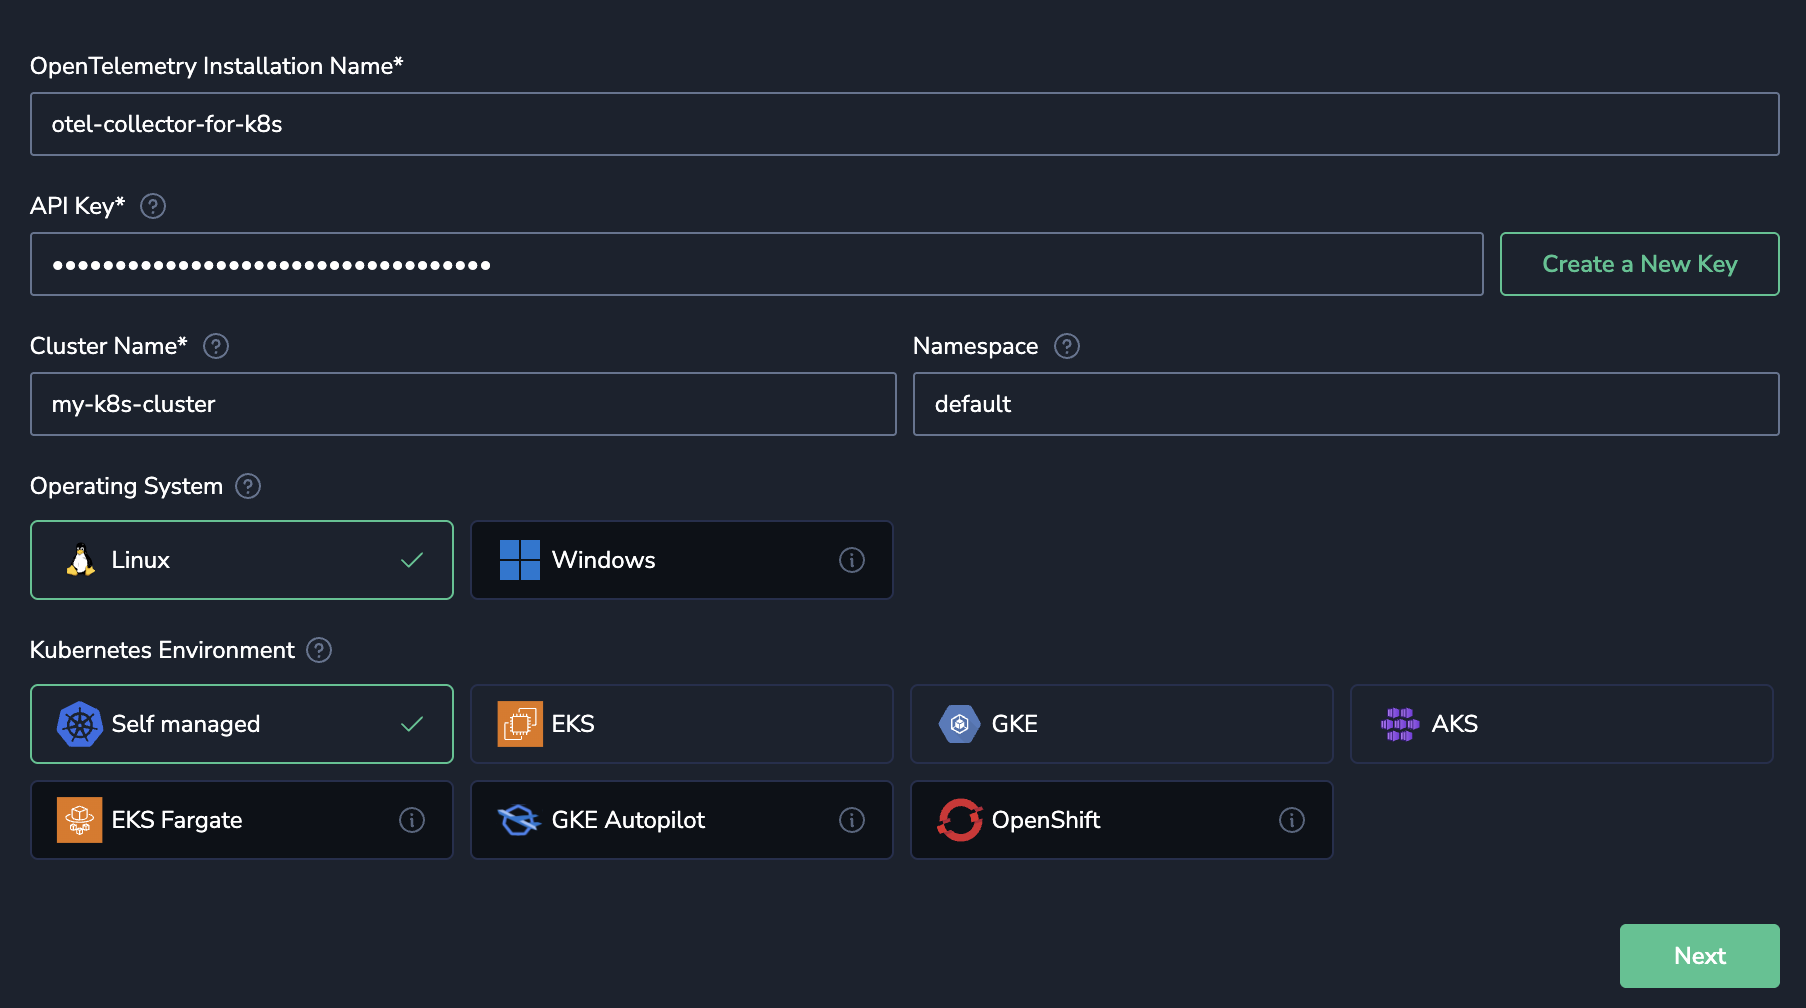
Provide a name to identify this integration (especially useful if you have multiple clusters).
- Enter a Send-Your-Data API key or click Create a New Key to generate a new dedicated API key.
- Enter your Kubernetes cluster name in the Cluster Name field.
- Enter your Kubernetes namespace in the Namespace field. If left empty, the namespace from your current kubectl context will be used.
- Select the operating system and environment that your Kubernetes workloads are deployed on.
Click Next.
For a full walkthrough, see the Kubernetes Complete Observability configuration guide.
Enable observability features
Once you're under the Observability Features section of the setup wizard, enable the following toggles to activate the necessary features for Infrastructure Explorer:
- Host metrics: Collects host-level CPU, memory, disk, and network usage
- Process Metrics: Enables host process collection using the
processpreset - Kubelet metrics: Collects node, pod, container, and volume metrics via the
kubeletstatsreceiver - Cluster metrics: Pulls cluster-wide metrics from the Kubernetes API server
- Kubernetes extra metrics: Captures additional Kubernetes component metrics
- Scrape all: Enables extended metric coverage
- Collector metrics: Monitors internal performance metrics from the OpenTelemetry Collector

Key toggle: Resource Catalog / Infra Explorer
Under Additional Features, enable this toggle to activate Infrastructure Explorer’s core functionality, including:
- Live infrastructure metadata
- Resource relationships (e.g., pod-to-node)
- Ownership and tag-based filtering
- Searchable inventory of Kubernetes and cloud entities
Note
Once enabled, navigate to Infrastructure > Infrastructure Explorer in Coralogix to begin using it.
For full installation and Helm deployment steps, refer to the Kubernetes Complete Observability.
For advanced enrichment and filtering options, see Kubernetes Enrichment Options.