SLO alerts
Service Level Objectives help teams define what reliability means for their services. But knowing whether you're meeting your SLOs isn't enough — you need to be alerted when you're at risk of breaching them. SLO alerts notify you when your error budget is at risk, either because too much has been consumed or because it is being spent too fast.
Overview
SLO alerts provide actionable, reliability-centered monitoring, shifting focus away from individual incidents to the user experience as a whole. Instead of reacting to every spike or dip, you can prioritize based on real impact to service goals.
SLO alerts support event-based, time window, and APM SLOs.
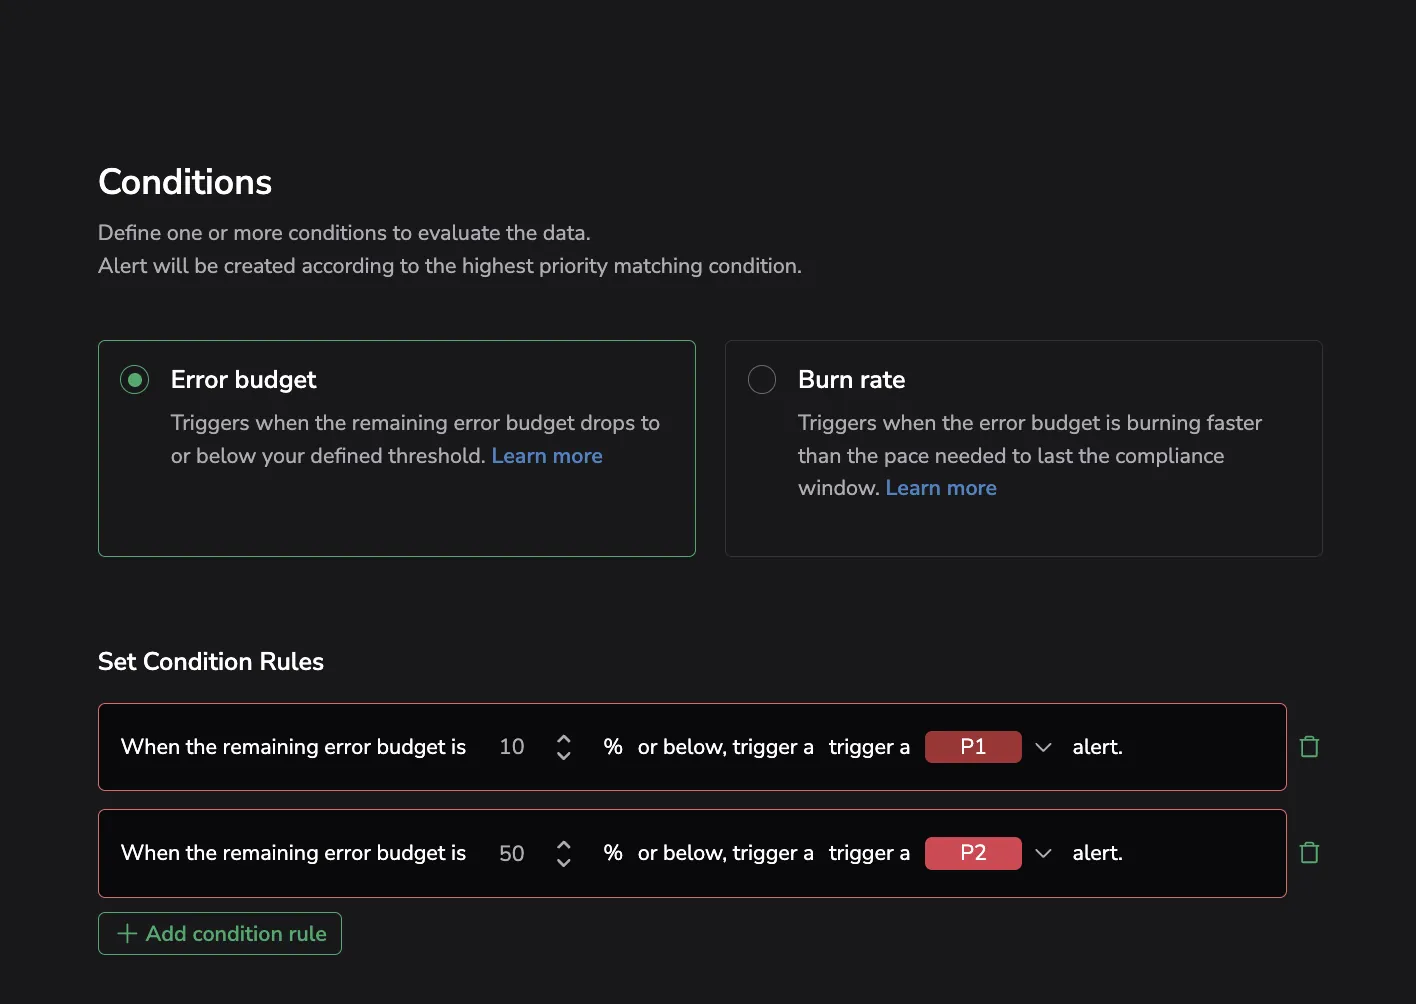
When creating or editing an SLO alert, choose between two condition types:
- Error budget: Fires when the remaining error budget drops to or below a percentage you define. This is a snapshot alert: it answers "how much budget is left?"
- Burn rate: Fires when the error budget is being consumed faster than the rate needed to survive the full compliance window. This is a velocity alert: it answers "how fast are we spending?"
flowchart TD
    A["SLO alert"] --> B["Error budget"]
    A --> C["Burn rate"]
    C --> D["Single Mode"]
    C --> E["Dual Mode"]

    class A entry
Alerts API v2 and v3
SLO alerts require support from Alerts API v2 or v3. While both versions are supported, we recommend using API v3 to take advantage of enhanced alert management capabilities.
To create SLO alerts via API or Terraform, Alerts API v3 is required.
In addition, API v3 introduces significant improvements to alert management, including support for:
SLO alerts may be created in the Coralogix platform with support from Alerts API v2.
This version lacks programmatic support for SLO creation via API and Terraform.
It also lacks support for new alert management features, including:
To migrate from Alerts API v2 to v3, follow this guide.
Track error budget usage
Your error budget represents how much unreliability you can tolerate before breaching your SLO. Monitoring it gives you a clear picture of how much room you have left to absorb incidents. This enables you to make smarter decisions about whether to ship a risky release, investigate performance regressions, or prioritize reliability improvements over new features.
Detect and react to burn rate spikes
Burn rate shows how quickly you're using up your error budget. By tracking this rate, you can differentiate between high-impact, fast-burning incidents that require immediate attention and slow-burning degradations that may need longer-term investigation. This empowers you to respond with the appropriate urgency based on the actual risk to your SLO.
Reduce alert noise and fatigue
Traditional alerting systems often overwhelm with alerts that may not reflect real user impact. SLO-based alerting focuses on the experience that actually matters to users, drastically cutting down false positives and alert fatigue. You can prioritize fewer, higher-quality alerts that signal true reliability threats.
Getting started
Create SLO alerts using one of the following methods:
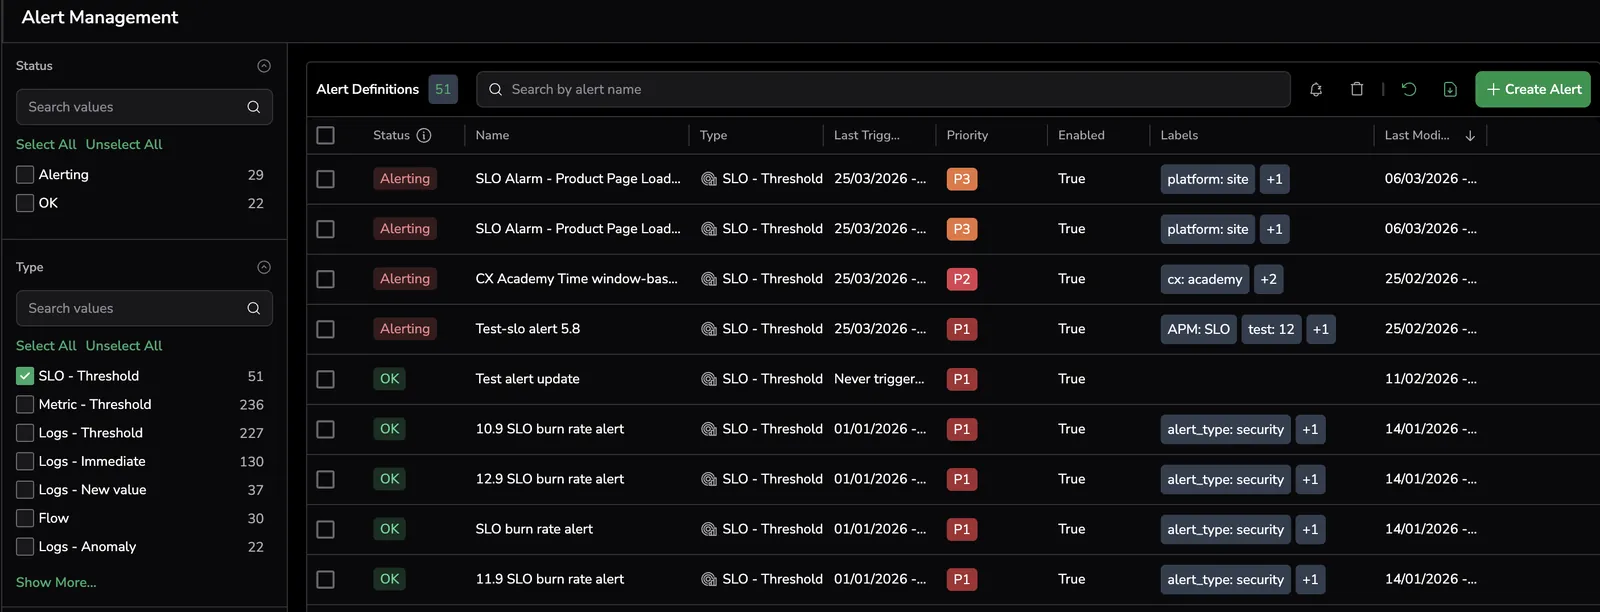
- Navigate to Alerts, then Alert Management. Select + Create Alert, and then SLO as your alert type.
- When saving a newly-created SLO, select Save & create alert.
- In the SLO Center, hover over an SLO in the SLO grid, select the menu at the beginning of the row, and then Create alert.
Once created, the SLO alert is displayed in the Alert Management page under Alert Definitions. Group by the SLO - Threshold type to view all SLO alerts.
Select SLO and define alert details
Use the SLO drop-down box to select an existing SLO or create a new one. If needed, select View SLO to navigate to the SLO details page in the SLO Center.
Define the alert details.
Labels help you filter alerts in Incidents and organize views. You can create a new label or select an existing one. To nest a label, use the key:value format (e.g., env:prod).
Error budget alert
Error budget alerts fire when the remaining error budget percentage is equal to or below a defined threshold. This is a snapshot alert — it answers the question "how much budget is left?" and triggers when that number crosses a threshold you set.
Example condition:
When the remaining error budget is 10% or below, trigger a P1 alert.
Add a budget threshold
Set when the alert should trigger based on error budget usage, and assign its priority (P1 to P5). For example, trigger a P1 alert at 10% consumption for urgent action, or a P3 alert at 50% for early warning.
- You can define up to five unique thresholds for each alert.
- Avoid using the same percentage value or assigning the same priority level more than once within a single alert configuration.
Burn rate alert
Burn rate alerts fire when the error budget is being consumed faster than the rate needed to survive the full compliance window. This is a velocity alert — it answers "how fast are we spending?" rather than how much is left.
Example condition:
The error budget is burning 2x faster than it should to last through the compliance window.
Choose detection modes
Under Choose Detection Modes, select one of the following:
- Single Mode: Monitors the burn rate over the evaluation window you define. Fires when the budget is depleting faster than the sustainable pace to last the compliance window.
- Dual Mode: Adds a rapid quality signal on top of the slow burn check. Detects sudden collapses in service quality evaluated over a fixed 10-minute window. Both signals share the same multiplier you configure below.
Single mode
In Single Mode, the alert evaluates the burn rate over a single evaluation window.
Burn rate window
Define how far back to measure whether the budget is burning too fast. Set the number of hours to evaluate (for example, "Evaluate the last 6 hours").
Set condition rules
Each condition rule defines a burn rate multiplier and priority:
- A multiplier of 1 fires when the burn rate is exactly at the pace that would exhaust the budget by end of the compliance window.
- A multiplier of 2 fires when it is burning twice as fast.
For example: "The error budget is burning 2 times faster than it should to last through the compliance window, trigger a P1 alert."
Dual mode
Dual Mode adds a Quality drop window on top of the burn rate window. A single alert configuration can now catch both:
- Gradual erosion: Burn rate trending too fast across the evaluation window you define.
- Sudden collapse: Service quality dropping sharply within the last 10 minutes.
Burn rate window
Same as Single Mode — define how far back to measure whether the budget is burning too fast.
Quality drop window
Detects a sudden collapse in service quality. Always evaluated over the last 10 minutes. The threshold is derived from the multiplier you set below.
Set condition rules
In Dual Mode, condition rules include both signals. For example: "The error budget is burning 2 times faster than it should to last through the compliance window. Also triggers if quality of service drops sharply within the last 10 minutes. Trigger a P1 alert."
The same multiplier also drives the quality drop check over the last 10 minutes.
Define burn rate thresholds
Define how many times faster than normal the error budget is burning and assign it a priority (P1 to P5). For example, send a P1 alert if the burn rate is > 1.5x normal usage.
- You can add multiple condition rules with different multipliers and priority levels.
- Condition rule parameters must be unique.
Note
Avoid using the same priority level more than once within a single alert configuration.
Notifications
As part of the notification settings setup, the following outbound webhooks are supported:
Supported fields for webhook configuration can be found here.
Schedule
Define an alert schedule by specifying the exact days and time ranges during which the alert should be active.
View triggered alert events in Incidents
Triggered SLO-based alert events are aggregated into Incidents, providing a centralized way to track, investigate, and resolve critical issues across your system. Each incident aggregates related alerts, giving you a high-level view of what went wrong, when, and where. From within the Incidents view, you can dive into the relevant SLO permutation to understand the root cause faster.
Alert evaluation timing
Sampling for burn rate alerts begins only after the duration of the longer time window specified in the alert configuration. For example, if the long window is 6 hours, alert evaluation will start 6 hours after creation. This delay ensures meaningful evaluation of sustained burn conditions.
Next steps
Review the required roles and actions for SLOs in Permissions.