SLO management API
Use the SLO Management API to manage your SLOs (service level objectives) programmatically. You can create, retrieve, update, and delete SLOs and their associated alerts. This API is ideal for teams that prefer programmatic access to SLO management.
Prerequisites
Before using the SLO Management API, ensure the following prerequisites are met:
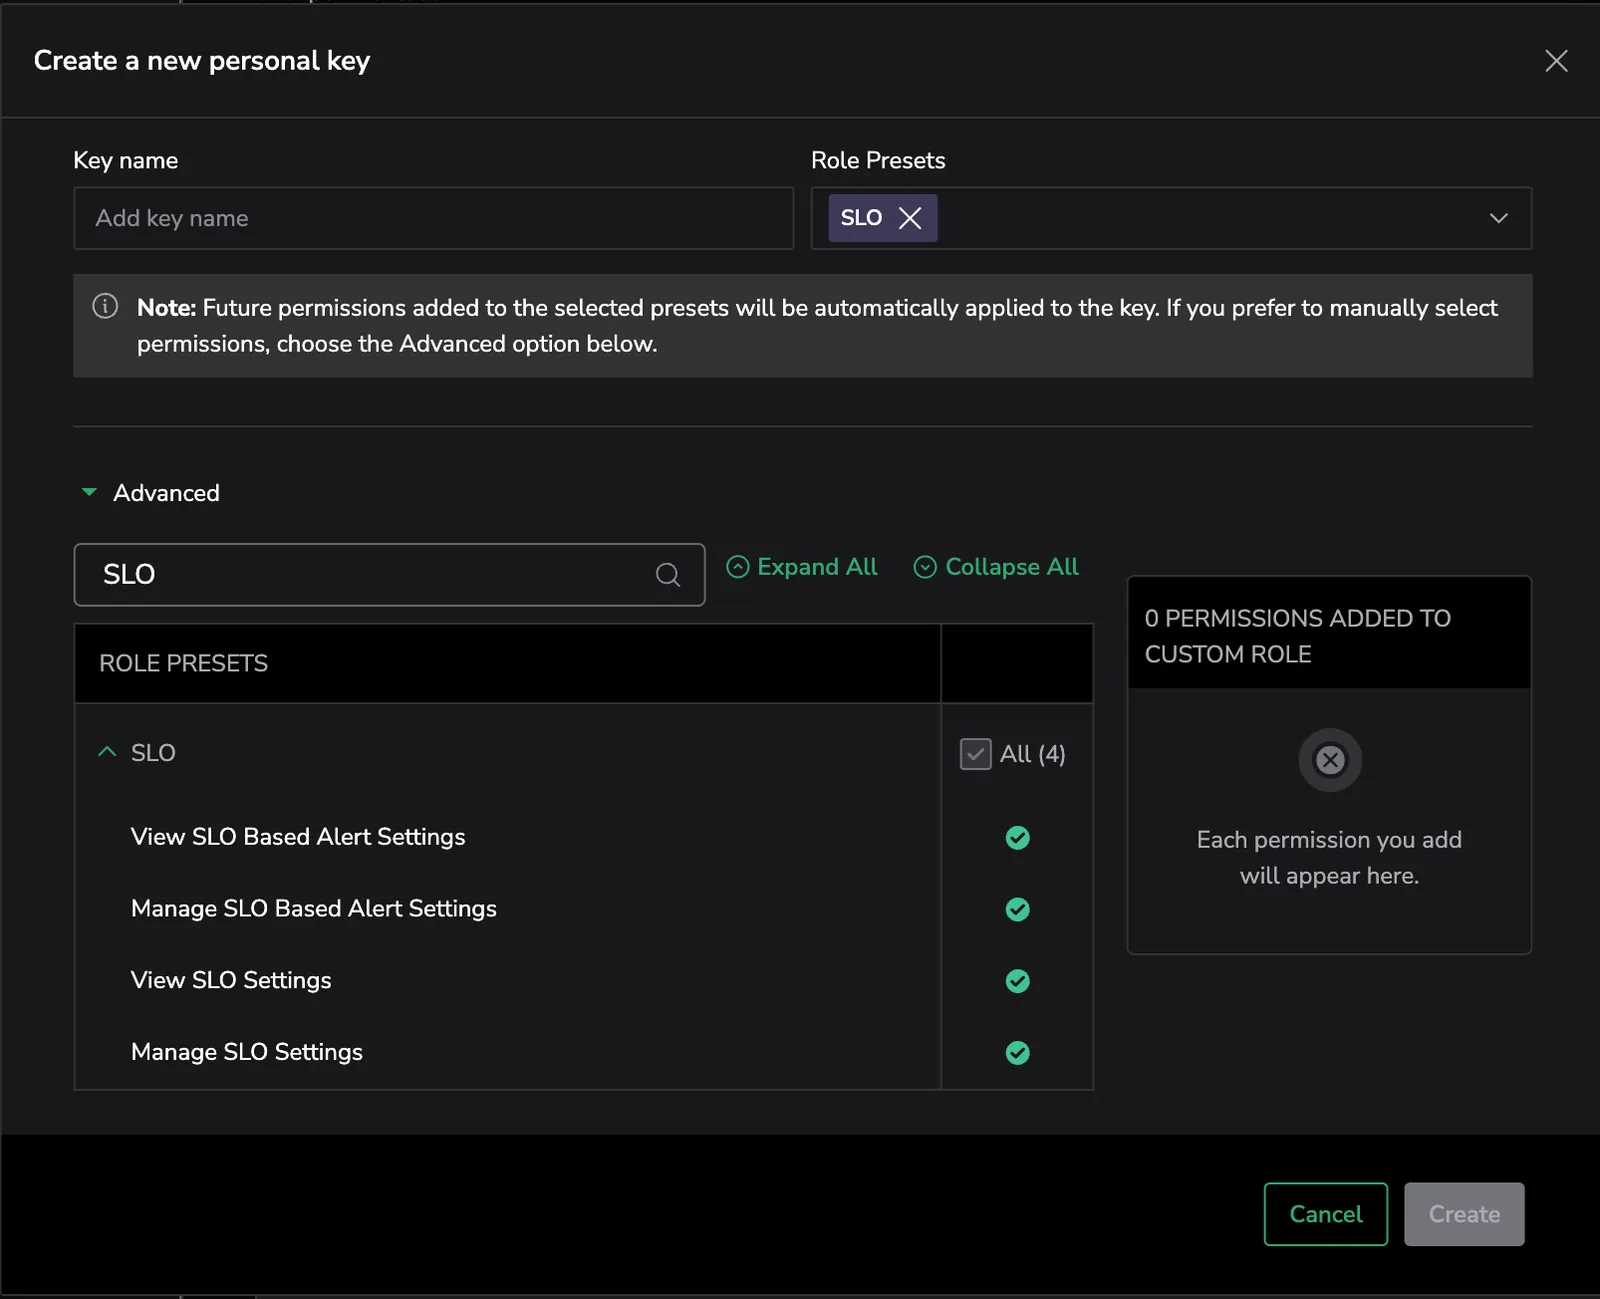
- You must have a personal or team API key. We recommend using the SLO permission preset, which is automatically updated with the necessary scopes. Alternatively, you can manually assign individual permissions as needed:
| Action | Description |
|---|---|
ALERTS:SLOMGMTREADCONFIG | View SLO Based Alert Settings |
ALERTS:SLOMGMTUPDATECONFIG | Manage SLO Based Alert Settings |
SLO-MGMT.SLO:READCONFIG | View SLO Settings |
SLO-MGMT.SLO:UPDATECONFIG | Manage SLO Settings |
To assign the SLO permission preset to an API key, navigate to API Keys and click on + PERSONAL KEY or + TEAM KEY. Then, select the SLO permission preset from the Role Presets dropdown.
Authentication
Include your API key in the Authorization header:
Example:
grpcurl -H "Authorization: Bearer <cx_api_key>"
curl -H "Authorization: Bearer <cx_api_key>"
API specification
This section provides example requests and responses for the Create, List, Delete, and Edit SLO methods and Create and List SLO alert methods, using both curl (HTTP) and grpcurl (gRPC) formats.
Visit our SLO Management OpenAPI documentation to see the full specification of the HTTP API methods and parameters.
Create SLO
Creates a new SLO for the specified service. Use it to define the parameters of the SLO, including target percentage, filters, and service level indicators (SLIs).
- In SLI expressions, an aggregation function (such as
sum,avg, orcount) is required. This ensures that SLOs evaluate meaningful permutations based on the specified label dimensions. - When querying SLO metrics, you usually don’t need to add a range selector; the query uses an appropriate time window automatically. If you do include a range selector (e.g., [1h]) for a specific need, that exact time window will be used and not overridden. Add a range only when you require a custom time window.
Event-Based SLO
Learn more about Event-Based SLOs in our documentation here.
- HTTP
- gRPC
Example request:
curl -X POST https://api.eu2.coralogix.com/mgmt/openapi/4/v1/slo/slos \
  -H "Authorization: Bearer <cx_api_key>" \
  -H "Content-Type: application/json" \
  -d '{
    "name": "API Availability SLO",
    "description": "Monitors the availability of our critical API endpoints",
    "creator": "[email protected]",
    "labels": {
      "entityIdentifier": "foo bar"
    },
    "targetThresholdPercentage": 99.95,
    "sloTimeFrame": "SLO_TIME_FRAME_28_DAYS",
    "requestBasedMetricSli": {
      "goodEvents": {
        "query": "sum(rate(http_requests_total{status=~\"2..\"})) by(service_name)"
      },
      "totalEvents": {
        "query": "sum(rate(http_requests_total)) by(service_name)"
      }
    }
  }'
Example response:
{
"slo": {
"id": "<SLO_ID>",
"name": "API Availability SLO",
"description": "Monitors the availability of our critical API endpoints",
"labels": {
"entityIdentifier": "foo bar"
},
"revision": {
"revision": 1,
"updateTime": "2024-03-20T10:00:00Z"
},
"grouping": {
"labels": ["service_name"]
},
"createTime": "2024-03-20T10:00:00Z",
"updateTime": "2024-03-20T10:00:00Z",
"targetThresholdPercentage": 99.95,
"sloTimeFrame": "SLO_TIME_FRAME_28_DAYS",
"requestBasedMetricSli": {
"goodEvents": {
"query": "sum(rate(http_requests_total{status=~\"2..\"})) by(service_name)"
},
"totalEvents": {
"query": "sum(rate(http_requests_total)) by(service_name)"
}
}
}
}
Example request:
grpcurl -H "Authorization: Bearer <cx_api_key>" -d @ api.eu2.coralogix.com:443 com.coralogixapis.slo.v1.SlosService/CreateSlo <<EOF
{
  "slo": {
    "name": "API Availability SLO",
    "description": "Monitors the availability of our critical API endpoints",
    "creator": "[email protected]",
    "target_threshold_percentage": 99.95,
    "slo_time_frame": "SLO_TIME_FRAME_28_DAYS",
    "request_based_metric_sli": {
      "good_events": {
        "query": "sum(rate(http_requests_total{status=~\"2..\"})) by(service_name)"
      },
      "total_events": {
        "query": "sum(rate(http_requests_total)) by(service_name)"
      }
    }
  }
}
EOF
Example response:
{
"slo": {
"id": "<SLO_ID>",
"name": "API Availability SLO",
"description": "Monitors the availability of our critical API endpoints",
"revision": {
"revision": 1,
"update_time": "2024-03-20T10:00:00Z"
},
"grouping": {
"labels": ["service_name"]
},
"create_time": "2024-03-20T10:00:00Z",
"update_time": "2024-03-20T10:00:00Z",
"target_threshold_percentage": 99.95,
"window": {
"slo_time_frame": "SLO_TIME_FRAME_28_DAYS"
},
"request_based_metric_sli": {
"good_events": {
"query": "sum(rate(http_requests_total{status=~\"2..\"})) by(service_name)"
},
"total_events": {
"query": "sum(rate(http_requests_total)) by(service_name)"
}
}
}
}
Time Window SLO
Learn more about time window SLOs in our documentation here.
- HTTP
- gRPC
Example request:
curl -X POST https://api.eu2.coralogix.com/mgmt/openapi/4/v1/slo/slos \
  -H "Authorization: Bearer <cx_api_key>" \
  -H "Content-Type: application/json" \
  -d '{
      "name": "API Availability SLO",
      "description": "Monitors the availability of our critical API endpoints",
      "creator": "[email protected]",
      "targetThresholdPercentage": 99.95,
      "sloTimeFrame": "SLO_TIME_FRAME_28_DAYS",
      "windowBasedMetricSli": {
        "query": {
          "query": "avg(product_latency_by_country) by (country) < 500"
        },
        "window": "WINDOW_SLO_WINDOW_1_MINUTE",
        "comparisonOperator": "COMPARISON_OPERATOR_GREATER_THAN",
        "threshold": 65
      }
    }'
Example response:
{
"slo": {
"id": "<SLO_ID>",
"name": "API Availability SLO",
"description": "Monitors the availability of our critical API endpoints",
"labels": {},
"revision": {
"revision": 1,
"updateTime": "2025-08-06T09:25:30.980Z"
},
"grouping": {
"labels": [
"country"
]
},
"createTime": "2025-08-06T09:25:30.980Z",
"updateTime": "2025-08-06T09:25:31.010Z",
"targetThresholdPercentage": 99.95,
"sloTimeFrame": "SLO_TIME_FRAME_28_DAYS",
"windowBasedMetricSli": {
"query": {
"query": "avg(product_latency_by_country) by (country) < 500"
},
"window": "WINDOW_SLO_WINDOW_1_MINUTE",
"comparisonOperator": "COMPARISON_OPERATOR_GREATER_THAN",
"threshold": 65
}
}
}
Example request:
grpcurl -H "Authorization: Bearer <cx_api_key>" -d @ api.eu2.coralogix.com:443 com.coralogixapis.slo.v1.SlosService/CreateSlo <<EOF
{
  "slo": {
    "name": "API Availability SLO",
    "description": "Monitors the availability of our critical API endpoints",
    "creator": "[email protected]",
    "target_threshold_percentage": 99.95,
    "slo_time_frame": "SLO_TIME_FRAME_28_DAYS",
    "window_based_metric_sli": {
      "query": {
        "query": "histogram_quantile(0.95, sum(increase(duration_ms_bucket)) by (service_name, le))"
      },
      "window": "WINDOW_SLO_WINDOW_1_MINUTE",
      "comparison_operator": "COMPARISON_OPERATOR_GREATER_THAN",
      "threshold": 65
    }
  }
}
EOF
Example response:
{
"slo": {
"id": "<SLO_ID>",
"name": "API Availability SLO",
"description": "Monitors the availability of our critical API endpoints",
"revision": {
"revision": 1,
"update_time": "2024-03-20T10:00:00Z"
},
"grouping": {
"labels": ["service_name"]
},
"create_time": "2024-03-20T10:00:00Z",
"update_time": "2024-03-20T10:00:00Z",
"target_threshold_percentage": 99.95,
"window": {
"slo_time_frame": "SLO_TIME_FRAME_28_DAYS"
},
"window_based_metric_sli": {
"query": {
"query": "histogram_quantile(0.95, sum(increase(duration_ms_bucket)) by (service_name, le))"
},
"window": "WINDOW_SLO_WINDOW_1_MINUTE",
"comparison_operator": "COMPARISON_OPERATOR_GREATER_THAN",
"threshold": 65
}
}
}
APM SLO
APM SLOs are managed through the dedicated com.coralogixapis.slo.v1.ApmSloService. The SLO type is fixed to Errors or Latency, and Coralogix generates the underlying PromQL queries from your inputs (services, filters, grouping keys, threshold, time frame).
The metric_source field selects which APM metric pipeline backs the SLO:
APM_SOURCE_SPAN_METRICS— OpenTelemetry span metrics (calls_total,duration_ms_bucket, etc.).APM_SOURCE_E2M— Coralogix Events-to-Metrics (cx_service_catalog_duration_update_cx_*).
The HTTP API for APM SLOs is exposed at /4/v1/slo/apm-slos through the OpenAPI gateway. HTTP requests use camelCase field names (for example, targetThresholdPercentage); gRPC requests use snake_case (target_threshold_percentage). See the SLO Management OpenAPI documentation for the full HTTP specification.
Error APM SLO
Tracks the percentage of requests completed without errors. Use the errorConfig (HTTP) / error_config (gRPC) SLI type.
- HTTP
- gRPC
Example request:
curl -X POST https://api.eu2.coralogix.com/mgmt/openapi/4/v1/slo/apm-slos \
  -H "Authorization: Bearer <cx_api_key>" \
  -H "Content-Type: application/json" \
  -d '{
    "apmSlo": {
      "name": "Checkout Service Error Rate",
      "description": "Error rate monitoring for the checkout API",
      "targetThresholdPercentage": 99.5,
      "window": { "sloTimeFrame": "SLO_TIME_FRAME_28_DAYS" },
      "apmSli": {
        "services": ["checkout-service"],
        "filters": [{ "key": "environment", "values": ["production"] }],
        "groupingKeys": ["environment", "region"],
        "sliType": { "errorConfig": {} }
      },
      "labels": { "team": "checkout" }
    },
    "metricSource": "APM_SOURCE_SPAN_METRICS"
  }'
Example response:
{
  "slo": {
    "slo": {
      "id": "<SLO_ID>",
      "name": "Checkout Service Error Rate",
      "description": "Error rate monitoring for the checkout API",
      "targetThresholdPercentage": 99.5,
      "productType": "SLO_PRODUCT_TYPE_APM",
      "window": { "sloTimeFrame": "SLO_TIME_FRAME_28_DAYS" },
      "createTime": "2026-04-29T10:28:00Z",
      "updateTime": "2026-04-29T10:28:00Z"
    }
  }
}
Example request:
grpcurl -H "Authorization: Bearer <cx_api_key>" -d @ api.eu2.coralogix.com:443 com.coralogixapis.slo.v1.ApmSloService/CreateApmSlo <<EOF
{
  "apm_slo": {
    "name": "Checkout Service Error Rate",
    "description": "Error rate monitoring for the checkout API",
    "target_threshold_percentage": 99.5,
    "window": { "slo_time_frame": "SLO_TIME_FRAME_28_DAYS" },
    "apm_sli": {
      "services": ["checkout-service"],
      "filters": [{ "key": "environment", "values": ["production"] }],
      "grouping_keys": ["environment", "region"],
      "sli_type": { "error_config": {} }
    },
    "labels": { "team": "checkout" }
  },
  "metric_source": "APM_SOURCE_SPAN_METRICS"
}
EOF
Example response:
{
  "slo": {
    "slo": {
      "id": "<SLO_ID>",
      "name": "Checkout Service Error Rate",
      "description": "Error rate monitoring for the checkout API",
      "target_threshold_percentage": 99.5,
      "product_type": "SLO_PRODUCT_TYPE_APM",
      "window": { "slo_time_frame": "SLO_TIME_FRAME_28_DAYS" },
      "create_time": "2026-04-29T10:28:00Z",
      "update_time": "2026-04-29T10:28:00Z"
    }
  }
}
Latency APM SLO
Tracks the percentage of requests that meet a latency threshold. Use the latencyConfig (HTTP) / latency_config (gRPC) SLI type with a quantile (for example, P95, P99) or average aggregation.
- HTTP
- gRPC
Example request:
curl -X POST https://api.eu2.coralogix.com/mgmt/openapi/4/v1/slo/apm-slos \
  -H "Authorization: Bearer <cx_api_key>" \
  -H "Content-Type: application/json" \
  -d '{
    "apmSlo": {
      "name": "API Gateway P95 Latency",
      "targetThresholdPercentage": 99.0,
      "window": { "sloTimeFrame": "SLO_TIME_FRAME_7_DAYS" },
      "apmSli": {
        "services": ["api-gateway"],
        "sliType": {
          "latencyConfig": {
            "timeWindow": "WINDOW_SLO_WINDOW_5_MINUTES",
            "threshold": 200.0,
            "quantile": { "percentile": 0.95 }
          }
        }
      }
    },
    "metricSource": "APM_SOURCE_SPAN_METRICS"
  }'
Example response:
{
  "slo": {
    "slo": {
      "id": "<SLO_ID>",
      "name": "API Gateway P95 Latency",
      "targetThresholdPercentage": 99.0,
      "productType": "SLO_PRODUCT_TYPE_APM",
      "window": { "sloTimeFrame": "SLO_TIME_FRAME_7_DAYS" },
      "createTime": "2026-04-29T10:28:00Z",
      "updateTime": "2026-04-29T10:28:00Z"
    }
  }
}
Example request:
grpcurl -H "Authorization: Bearer <cx_api_key>" -d @ api.eu2.coralogix.com:443 com.coralogixapis.slo.v1.ApmSloService/CreateApmSlo <<EOF
{
  "apm_slo": {
    "name": "API Gateway P95 Latency",
    "target_threshold_percentage": 99.0,
    "window": { "slo_time_frame": "SLO_TIME_FRAME_7_DAYS" },
    "apm_sli": {
      "services": ["api-gateway"],
      "sli_type": {
        "latency_config": {
          "time_window": "WINDOW_SLO_WINDOW_5_MINUTES",
          "threshold": 200.0,
          "quantile": { "percentile": 0.95 }
        }
      }
    }
  },
  "metric_source": "APM_SOURCE_SPAN_METRICS"
}
EOF
Example response:
{
  "slo": {
    "slo": {
      "id": "<SLO_ID>",
      "name": "API Gateway P95 Latency",
      "target_threshold_percentage": 99.0,
      "product_type": "SLO_PRODUCT_TYPE_APM",
      "window": { "slo_time_frame": "SLO_TIME_FRAME_7_DAYS" },
      "create_time": "2026-04-29T10:28:00Z",
      "update_time": "2026-04-29T10:28:00Z"
    }
  }
}
APM SLO field reference
| Field | Type | Description |
|---|---|---|
apm_slo.name | string | SLO name. |
apm_slo.description | string | Optional description. |
apm_slo.target_threshold_percentage | float | Target success rate (for example, 99.5). |
apm_slo.window.slo_time_frame | enum | Rolling evaluation window: SLO_TIME_FRAME_7_DAYS, _14_DAYS, _21_DAYS, or _28_DAYS. |
apm_slo.apm_sli.services | string[] | Service names monitored by the SLO. Currently one service per SLO. |
apm_slo.apm_sli.filters | object[] | Optional label filters (key, values). |
apm_slo.apm_sli.grouping_keys | string[] | Labels to break down results by. |
apm_slo.apm_sli.sli_type.error_config | object | Empty object selects the error SLI type. |
apm_slo.apm_sli.sli_type.latency_config.time_window | enum | WINDOW_SLO_WINDOW_1_MINUTE or WINDOW_SLO_WINDOW_5_MINUTES. |
apm_slo.apm_sli.sli_type.latency_config.threshold | float | Latency threshold in milliseconds. |
apm_slo.apm_sli.sli_type.latency_config.quantile.percentile | float | Percentile between 0 and 1 (for example, 0.95 for P95). |
apm_slo.apm_sli.sli_type.latency_config.average | object | Empty object selects average aggregation instead of quantile. |
apm_slo.labels | map | Optional metadata labels. |
metric_source | enum | APM_SOURCE_SPAN_METRICS or APM_SOURCE_E2M. |
List SLOs
Retrieves all SLOs from the service catalog. You can apply optional filters to refine the SLO data returned.
To list only APM SLOs, filter by product_type set to SLO_PRODUCT_TYPE_APM. The response includes the full apm_source_config for each APM SLO.
- HTTP
- gRPC
Example request
curl -X GET https://api.eu2.coralogix.com/mgmt/openapi/4/v1/slo/slos \
  -H "Authorization: Bearer <cx_api_key>"
Example response:
{
"slos": [
{
"id": "<SLO_ID>",
"name": "Frontend service error rate",
"description": "frontend error",
"labels": {},
"revision": {
"revision": 1,
"updateTime": "2025-06-15T19:37:58.437Z"
},
"grouping": {
"labels": []
},
"createTime": "2025-06-15T19:37:58.437Z",
"updateTime": "2025-06-15T19:37:58.628Z",
"targetThresholdPercentage": 99,
"sloTimeFrame": "SLO_TIME_FRAME_7_DAYS",
"requestBasedMetricSli": {
"goodEvents": {
"query": "sum(calls_total_total{status_code!=\"STATUS_CODE_ERROR\", service_name=\"frontend\"})"
},
"totalEvents": {
"query": "sum(calls_total_total{service_name=\"frontend\"})"
}
}
},
{
"id": "<SLO_ID>",
"name": "SLO Service Errors",
"description": "This SLO tracks error events in requests, internal operations or outgoing calls.",
"labels": {
"Metric": "Error"
},
"revision": {
"revision": 1,
"updateTime": "2025-06-17T18:00:42.454Z"
},
"grouping": {
"labels": [
"k8s_node_name",
"service_name"
]
},
"createTime": "2025-06-17T18:00:42.454Z",
"updateTime": "2025-06-17T18:00:42.469Z",
"targetThresholdPercentage": 94,
"sloTimeFrame": "SLO_TIME_FRAME_7_DAYS",
"requestBasedMetricSli": {
"goodEvents": {
"query": "sum(calls_total_total{status_code!='STATUS_CODE_ERROR'}) by (service_name, k8s_node_name)"
},
"totalEvents": {
"query": "sum(calls_total_total) by (service_name, k8s_node_name)"
}
}
}
]
}
Example request:
grpcurl -H "Authorization: Bearer <cx_api_key>" -d @ api.eu2.coralogix.com:443 com.coralogixapis.slo.v1.SlosService/ListSlos <<EOF
{
  "filters": {
    "filters": [
      {
        "field": {
          "const_filter": "SLO_CONST_FILTER_FIELD_USER_NAME"
        },
        "predicate": {
          "is": {
            "is": ["[email protected]"]
          }
        }
      },
      {
        "field": {
          "label_name": "environment"
        },
        "predicate": {
          "is": {
            "is": ["production", "staging"]
          }
        }
      },
      {
        "field": {
          "label_name": "service"
        },
        "predicate": {
          "is": {
            "is": ["api-gateway"]
          }
        }
      }
    ]
  }
}
EOF
Example response:
{
"slos": [
{
"id": "<SLO_ID>",
"name": "API Latency SLO",
"description": "Monitors the latency of our critical API endpoints",
"labels": {
"environment": "staging",
"service": "api-gateway",
"team": "platform"
},
"revision": {
"revision": 1,
"update_time": "2024-03-20T11:00:00Z"
},
"grouping": {
"labels": ["environment", "service"]
},
"create_time": "2024-03-20T11:00:00Z",
"update_time": "2024-03-20T11:00:00Z",
"target_threshold_percentage": 99.9,
"window": {
"slo_time_frame": "SLO_TIME_FRAME_28_DAYS"
},
"request_based_metric_sli": {
"good_events": {
"query": "sum(rate(http_requests_total{status=~\"2..\"})) by(service_name)"
},
"total_events": {
"query": "sum(rate(http_requests_total)) by(service_name)"
}
}
}
]
}
Example request — list APM SLOs only:
Filter by product_type to return only APM SLOs. The response includes the full apm_source_config for each result.
grpcurl -H "Authorization: Bearer <cx_api_key>" -d @ api.eu2.coralogix.com:443 com.coralogixapis.slo.v1.SlosService/ListSlos <<EOF
{
  "filters": {
    "filters": [
      {
        "field": {
          "product_type": true
        },
        "predicate": {
          "is": {
            "product_type_values": {
              "values": ["SLO_PRODUCT_TYPE_APM"]
            }
          }
        }
      }
    ]
  }
}
EOF
The Delete and Edit SLO methods automatically delete or edit the related SLO alerts. We strongly recommend listing the related SLO alerts before executing these methods.
Delete SLO
Delete one or more SLOs by specifying their SLO IDs. When you delete an SLO, all associated alerts are also removed, and their IDs are returned in the affected_slo_alert_ids array.
- HTTP
- gRPC
Example request:
curl -X DELETE https://api.eu2.coralogix.com/mgmt/openapi/4/v1/slo/slos/<SLO_ID> \
  -H "Authorization: Bearer <cx_api_key>"
Example response:
{
    "effectedSloAlertIds": [
        "<SLO_ALERT_ID>"
    ]
}
Example request:
grpcurl -H "Authorization: Bearer <cx_api_key>" -d @ api.eu2.coralogix.com:443 com.coralogixapis.slo.v1.SlosService/DeleteSlo <<EOF
{
  "id": "<SLO_ID>"
}
EOF
Example response:
{
  "affected_slo_alert_ids": ["<SLO_ALERT_ID>", "<SLO_ALERT_ID>"]
}
Edit SLO
Edit an SLO by its ID. The response includes all associated alerts and identifies which alerts will become invalid due to the SLO update. Any alerts impacted by the changes must be either removed or updated to align with the new SLO configuration.
The edit operation also validates affected alerts and returns a list of invalidated SLO alerts. The request will not succeed until all invalid alerts are either automatically updated or manually resolved by the user.
Custom SLOs use SlosService/ReplaceSlo. APM SLOs use ApmSloService/ReplaceApmSlo with the same apm_slo payload as CreateApmSlo, plus the SLO id. Both endpoints return effected_slo_alert_ids for any alerts impacted by the change.
Edit APM SLO
- HTTP
- gRPC
Example request:
curl -X PUT https://api.eu2.coralogix.com/mgmt/openapi/4/v1/slo/apm-slos \
  -H "Authorization: Bearer <cx_api_key>" \
  -H "Content-Type: application/json" \
  -d '{
    "id": "<SLO_ID>",
    "apmSlo": {
      "name": "Checkout Service Error Rate",
      "targetThresholdPercentage": 99.9,
      "window": { "sloTimeFrame": "SLO_TIME_FRAME_14_DAYS" },
      "apmSli": {
        "services": ["checkout-service"],
        "filters": [{ "key": "environment", "values": ["production"] }],
        "groupingKeys": ["environment", "region"],
        "sliType": { "errorConfig": {} }
      }
    },
    "metricSource": "APM_SOURCE_SPAN_METRICS"
  }'
Example response:
{
  "slo": {
    "slo": {
      "id": "<SLO_ID>",
      "name": "Checkout Service Error Rate",
      "targetThresholdPercentage": 99.9,
      "productType": "SLO_PRODUCT_TYPE_APM"
    }
  },
  "effectedSloAlertIds": ["<SLO_ALERT_ID>"]
}
Example request:
grpcurl -H "Authorization: Bearer <cx_api_key>" -d @ api.eu2.coralogix.com:443 com.coralogixapis.slo.v1.ApmSloService/ReplaceApmSlo <<EOF
{
  "id": "<SLO_ID>",
  "apm_slo": {
    "name": "Checkout Service Error Rate",
    "target_threshold_percentage": 99.9,
    "window": { "slo_time_frame": "SLO_TIME_FRAME_14_DAYS" },
    "apm_sli": {
      "services": ["checkout-service"],
      "filters": [{ "key": "environment", "values": ["production"] }],
      "grouping_keys": ["environment", "region"],
      "sli_type": { "error_config": {} }
    }
  },
  "metric_source": "APM_SOURCE_SPAN_METRICS"
}
EOF
Example response:
{
  "slo": {
    "slo": {
      "id": "<SLO_ID>",
      "name": "Checkout Service Error Rate",
      "target_threshold_percentage": 99.9,
      "product_type": "SLO_PRODUCT_TYPE_APM"
    }
  },
  "effected_slo_alert_ids": ["<SLO_ALERT_ID>"]
}
Edit custom SLO
- HTTP
- gRPC
Example request:
curl -X PUT https://api.eu2.coralogix.com/mgmt/openapi/4/v1/slo/slos \
  -H "Authorization: Bearer <cx_api_key>" \
  -H "Content-Type: application/json" \
  -d '{
      "id": "<SLO_ID>",
      "name": "Service Call Success Rate",
      "description": "Tracks the success rate of service calls by measuring non-error responses across all services and Kubernetes nodes",
      "creator": "[email protected]",
      "labels": {
          "sampleLabel": "Kubernetes"
      },
      "revision": {
          "revision": 1,
          "updateTime": "1970-01-01T00:08:06.000000435Z"
      },
      "grouping": {
          "labels": [
              "k8s_node_name",
              "service_name"
          ]
      },
      "targetThresholdPercentage": 99,
      "sloTimeFrame": "SLO_TIME_FRAME_21_DAYS",
      "requestBasedMetricSli": {
          "goodEvents": {
              "query": "sum(calls_total_total{status_code!='STATUS_CODE_ERROR'}) by (service_name, k8s_node_name)"
          },
          "totalEvents": {
              "query": "sum(calls_total_total) by (service_name, k8s_node_name)"
          }
        }
      }
Example response:
{
"slo": {
"id": "<SLO_ID>",
"name": "Service Call Success Rate",
"description": "Tracks the success rate of service calls by measuring non-error responses across all services and Kubernetes nodes",
"labels": {
"sampleLabel": "Kubernetes"
},
"revision": {
"revision": 1,
"updateTime": "2025-08-06T20:37:50.431Z"
},
"grouping": {
"labels": [
"k8s_node_name",
"service_name"
]
},
"createTime": "2025-08-06T20:37:50.431Z",
"updateTime": "2025-08-06T20:50:42.757Z",
"targetThresholdPercentage": 99,
"sloTimeFrame": "SLO_TIME_FRAME_21_DAYS",
"requestBasedMetricSli": {
"goodEvents": {
"query": "sum(calls_total_total{status_code!=\'STATUS_CODE_ERROR\'}) by (service_name, k8s_node_name)"
},
"totalEvents": {
"query": "sum(calls_total_total) by (service_name, k8s_node_name)"
}
}
},
"effectedSloAlertIds": [
"<SLO_ALERT_ID>"
]
}
Example request:
grpcurl -H "Authorization: Bearer <cx_api_key>" -d @ api.eu2.coralogix.com:443 com.coralogixapis.slo.v1.SlosService/ReplaceSlo <<EOF
{
  "slo": {
    "id": "<SLO_ID>",
    "name": "Uptime SLO",
    "description": "Uptime SLO description",
    "creator": "Corporation Inc.",
    "labels": {
      "sample_label": "Payments service"
    },
    "revision": {
      "revision": 327,
      "updateTime": "1970-01-01T00:08:06.000000435Z"
    },
    "grouping": {
      "labels": [
        "grouping_label_1",
        "grouping_label_2"
      ]
    },
    "targetThresholdPercentage": 749.21533,
    "sloTimeFrame": "SLO_TIME_FRAME_28_DAYS",
    "requestBasedMetricSli": {
      "goodEvents": {
        "query": "<good_events_query>"
      },
      "totalEvents": {
        "query": "<total_events_query>"
      }
    }
  }
EOF
Example response:
{
  "slo": {
    "id": "<SLO_ID>",
    "name": "Uptime SLO",
    "description": "Uptime SLO description",
    "creator": "Corporation Inc.",
    "labels": {
      "sample_label": "Payments service"
    },
    "revision": {
      "revision": 327,
      "updateTime": "1970-01-01T00:08:06.000000435Z"
    },
    "grouping": {
      "labels": [
        "grouping_label_1",
        "grouping_label_2"
      ]
    },
    "targetThresholdPercentage": 749.21533,
    "sloTimeFrame": "SLO_TIME_FRAME_28_DAYS",
    "requestBasedMetricSli": {
      "goodEvents": {
        "query": "<good_events_query>"
      },
      "totalEvents": {
        "query": "<total_events_query>"
      }
    }
  },
  "affected_slo_alert_ids": ["<SLO_ALERT_ID>"]
}
Using the SLO API with Alerts
Create SLO alert
An SLO ID is required to create an SLO alert.
- HTTP
- gRPC
Example request:
curl -X POST https://api.eu2.coralogix.com/mgmt/openapi/3/alerts/alerts-general/v3/alert-defs \
  -H "Authorization: Bearer <cx_api_key>" \
  -H "Content-Type: application/json" \
  -d '{
    "name": "SLO Alert",
    "description": "",
    "enabled": true,
    "priority": "ALERT_DEF_PRIORITY_P1",
    "type": "ALERT_DEF_TYPE_SLO_THRESHOLD",
    "sloThreshold": {
      "sloDefinition": {
        "sloId": "<SLO_ID>"
      },
      "errorBudget": {
        "rules": [
          {
            "condition": {
              "threshold": 100
            },
            "override": {
              "priority": "ALERT_DEF_PRIORITY_P1"
            }
          }
        ]
      }
    },
    "groupByKeys": ["service_name", "status_code"],
    "incidentsSettings": {
      "minutes": 10,
      "notifyOn": "NOTIFY_ON_TRIGGERED_ONLY_UNSPECIFIED"
    },
    "notificationGroup": {
      "groupByKeys": [],
      "webhooks": [],
      "destinations": [],
      "router": {
        "id": "router_default",
        "notifyOn": "NOTIFY_ON_TRIGGERED_ONLY_UNSPECIFIED"
      }
    },
    "notificationGroupExcess": [],
    "entityLabels": {},
    "phantomMode": false,
    "deleted": false
  }'
Example response:
{
  "alertDef": {
    "alertDefProperties": {
      "name": "SLO Alert",
      "description": "",
      "enabled": true,
      "priority": "ALERT_DEF_PRIORITY_P1",
      "type": "ALERT_DEF_TYPE_SLO_THRESHOLD",
      "sloThreshold": {
        "sloDefinition": {
          "sloId": "<SLO_ID>"
        },
        "errorBudget": {
          "rules": [
            {
              "condition": {
                "threshold": 100
              },
              "override": {
                "priority": "ALERT_DEF_PRIORITY_P1"
              }
            }
          ]
        }
      },
      "groupByKeys": [
        "service_name",
        "status_code"
      ],
      "incidentsSettings": {
        "minutes": 10,
        "notifyOn": "NOTIFY_ON_TRIGGERED_ONLY_UNSPECIFIED"
      },
      "notificationGroup": {
        "groupByKeys": [],
        "webhooks": [],
        "destinations": [],
        "router": {
          "id": "router_default",
          "notifyOn": "NOTIFY_ON_TRIGGERED_ONLY_UNSPECIFIED"
        }
      },
      "notificationGroupExcess": [],
      "entityLabels": {},
      "phantomMode": false,
      "deleted": false
    },
    "id": "<SLO_ALERT_ID>",
    "alertVersionId": "<SLO_ALERT_VERSION_ID>",
    "createdTime": "2025-08-12T10:09:30Z",
    "updatedTime": "2025-08-12T10:09:30Z",
    "lastTriggeredTime": null
  }
}
Example request:
grpcurl -H "Authorization: Bearer <cx_api_key>" -d @ api.eu2.coralogix.com:443 com.coralogixapis.alerts.v3.AlertDefsService/CreateAlertDef <<EOF
{
  "alertDefProperties": {
    "name": "SLO Alert",
    "enabled": true,
    "priority": "ALERT_DEF_PRIORITY_P5_OR_UNSPECIFIED",
    "type": "ALERT_DEF_TYPE_SLO_THRESHOLD",
    "incidentsSettings": {
      "notifyOn": "NOTIFY_ON_TRIGGERED_AND_RESOLVED",
      "minutes": 5
    },
    "notificationGroup": {
      "groupByKeys": [],
      "webhooks": [],
      "destinations": []
    },
    "phantomMode": false,
    "sloThreshold": {
      "sloDefinition": {
        "sloId": "<SLO_ID>"
      },
      "errorBudget": {
        "rules": [
          {
            "condition": {
              "threshold": 1
            },
            "override": {
              "priority": "ALERT_DEF_PRIORITY_P3"
            }
          },
          {
            "condition": {
              "threshold": 2
            },
            "override": {
              "priority": "ALERT_DEF_PRIORITY_P2"
            }
          }
        ]
      }
    }
  }
}
EOF
Example response:
{
  "alertDef": {
    "alertDefProperties": {
      "name": "SLO Alert",
      "enabled": true,
      "type": "ALERT_DEF_TYPE_SLO_THRESHOLD",
      "incidentsSettings": {
        "notifyOn": "NOTIFY_ON_TRIGGERED_AND_RESOLVED",
        "minutes": 5
      },
      "notificationGroup": {},
      "phantomMode": false,
      "deleted": false,
      "sloThreshold": {
        "sloDefinition": {
          "sloId": "<SLO_ID>"
        },
        "errorBudget": {
          "rules": [
            {
              "condition": {
                "threshold": 1
              },
              "override": {
                "priority": "ALERT_DEF_PRIORITY_P3"
              }
            },
            {
              "condition": {
                "threshold": 2
              },
              "override": {
                "priority": "ALERT_DEF_PRIORITY_P2"
              }
            }
          ]
        }
      }
    },
    "id": "<SLO_ALERT_ID>",
    "createdTime": "2025-08-12T09:31:36Z",
    "updatedTime": "2025-08-12T09:31:36Z",
    "alertVersionId": "<SLO_ALERT_VERSION_ID>"
  }
}
List SLO alerts
Before editing or deleting an SLO using the Edit or Delete API methods, we recommend first using the List alerts method to review any related SLO alerts that could be impacted by the SLO update.
- HTTP
- gRPC
Example request:
curl -X GET "https://api.eu2.coralogix.com/mgmt/openapi/3/alerts/alerts-general/v3/alert-defs?queryFilter.typeSpecificFilter.sloFilter.sloId=<SLO_ID>" \
  -H "Authorization: Bearer <cx_api_key>"
Example response:
{
    "alertDefs": [
        {
            "alertDefProperties": {
                "name": "Service Call Success Rate Alert",
                "description": "",
                "enabled": true,
                "priority": "ALERT_DEF_PRIORITY_P1",
                "type": "ALERT_DEF_TYPE_SLO_THRESHOLD",
                "sloThreshold": {
                    "sloDefinition": {
                        "sloId": "<SLO_ID>"
                    },
                    "errorBudget": {
                        "rules": [
                            {
                                "condition": {
                                    "threshold": 100
                                },
                                "override": {
                                    "priority": "ALERT_DEF_PRIORITY_P1"
                                }
                            }
                        ]
                    }
                },
                "groupByKeys": [
                    "k8s_node_name",
                    "service_name"
                ],
                "incidentsSettings": {
                    "minutes": 10,
                    "notifyOn": "NOTIFY_ON_TRIGGERED_ONLY_UNSPECIFIED"
                },
                "notificationGroup": {
                    "groupByKeys": [],
                    "webhooks": [],
                    "destinations": [],
                    "router": {
                        "id": "router_default",
                        "notifyOn": "NOTIFY_ON_TRIGGERED_ONLY_UNSPECIFIED"
                    }
                },
                "notificationGroupExcess": [],
                "entityLabels": {},
                "phantomMode": false,
                "deleted": false
            },
            "id": "a818b5a6-37ca-4df2-8465-32954c247540",
            "alertVersionId": "5e58a0dc-2a7b-49f7-a187-b342911f4d26",
            "createdTime": "2025-08-06T20:39:49Z",
            "updatedTime": "2025-08-06T20:50:43Z",
            "lastTriggeredTime": "2025-08-06T21:00:11Z"
        }
    ],
    "pagination": {
        "totalSize": 1,
        "nextPageToken": null
    }
}
Example request:
grpcurl -H "Authorization: Bearer <cx_api_key>" -d @ api.eu2.coralogix.com:443 com.coralogixapis.alerts.v3.AlertDefsService/ListAlertDefs <<EOF
{
    "pagination": {
        "page_size": {
            "value": 10
        }
    },
    "query_filter": {
        "type_specific_filter": {
            "slo_filter": {
                "slo_id": [
                    {
                        "value": "<SLO_ID>"
                    }
                ]
            }
        }
    }
}
EOF
Example response:
{
    "alert_defs": [
        {
            "alert_def_properties": {
                "group_by_keys": [],
                "notification_group_excess": [],
                "entity_labels": {},
                "name": {
                    "value": "Test-10.8"
                },
                "description": null,
                "enabled": {
                    "value": true
                },
                "priority": "ALERT_DEF_PRIORITY_P5_OR_UNSPECIFIED",
                "type": "ALERT_DEF_TYPE_SLO_THRESHOLD",
                "incidents_settings": {
                    "notify_on": "NOTIFY_ON_TRIGGERED_AND_RESOLVED",
                    "minutes": {
                        "value": 5
                    }
                },
                "notification_group": {
                    "group_by_keys": [],
                    "webhooks": [],
                    "destinations": []
                },
                "phantom_mode": {
                    "value": false
                },
                "deleted": {
                    "value": false
                },
                "slo_threshold": {
                    "slo_definition": {
                        "slo_id": {
                            "value": "<SLO_ID>"
                        }
                    },
                    "error_budget": {
                        "rules": [
                            {
                                "condition": {
                                    "threshold": {
                                        "value": 1
                                    }
                                },
                                "override": {
                                    "priority": "ALERT_DEF_PRIORITY_P3"
                                }
                            },
                            {
                                "condition": {
                                    "threshold": {
                                        "value": 2
                                    }
                                },
                                "override": {
                                    "priority": "ALERT_DEF_PRIORITY_P2"
                                }
                            }
                        ]
                    }
                }
            },
            "id": {
                "value": "<SLO_ALERT_ID>"
            },
            "created_time": {
                "seconds": "1754831041",
                "nanos": 0
            },
            "updated_time": {
                "seconds": "1754831041",
                "nanos": 0
            },
            "last_triggered_time": null,
            "alert_version_id": {
                "value": "25bfb68c-ab5f-42a1-9384-f9f0bdad64a0"
            }
        },
        {
            "alert_def_properties": {
                "group_by_keys": [],
                "notification_group_excess": [],
                "entity_labels": {},
                "name": {
                    "value": "Alert Test"
                },
                "description": null,
                "enabled": {
                    "value": true
                },
                "priority": "ALERT_DEF_PRIORITY_P5_OR_UNSPECIFIED",
                "type": "ALERT_DEF_TYPE_SLO_THRESHOLD",
                "incidents_settings": {
                    "notify_on": "NOTIFY_ON_TRIGGERED_AND_RESOLVED",
                    "minutes": {
                        "value": 5
                    }
                },
                "notification_group": {
                    "group_by_keys": [],
                    "webhooks": [],
                    "destinations": []
                },
                "phantom_mode": {
                    "value": false
                },
                "deleted": {
                    "value": false
                },
                "slo_threshold": {
                    "slo_definition": {
                        "slo_id": {
                            "value": "<SLO_ID>"
                        }
                    },
                    "error_budget": {
                        "rules": [
                            {
                                "condition": {
                                    "threshold": {
                                        "value": 1
                                    }
                                },
                                "override": {
                                    "priority": "ALERT_DEF_PRIORITY_P3"
                                }
                            },
                            {
                                "condition": {
                                    "threshold": {
                                        "value": 2
                                    }
                                },
                                "override": {
                                    "priority": "ALERT_DEF_PRIORITY_P2"
                                }
                            }
                        ]
                    }
                }
            },
            "id": {
                "value": "<SLO_ALERT_ID>"
            },
            "created_time": {
                "seconds": "1754334866",
                "nanos": 0
            },
            "updated_time": {
                "seconds": "1754334866",
                "nanos": 0
            },
            "last_triggered_time": {
                "seconds": "1754620923",
                "nanos": 0
            },
            "alert_version_id": {
                "value": "<SLO_ALERT_VERSION_ID>"
            }
        }
    ],
    "pagination": {
        "total_size": {
            "value": 2
        },
        "next_page_token": null
    }
}
Additional resources
| Coralogix Endpoints | Coralogix Endpoints |