Get started with Explore spans
This quickstart walks you through a complete investigation flow for spans and traces—from choosing a tab and time range to filtering, aggregating, and drilling into a single span. Use this guide when you need to find the span or trace responsible for a latency spike, error, or unexpected behavior in your system. Follow the steps in order to get familiar with the key features.
What you'll find
This article set includes:
- Explore common components
- Overview tab for spans
- Spans, Traces, and Flows
- Signals tab
- Highlights tab
- Query builder for spans
Step 1: Open Explore
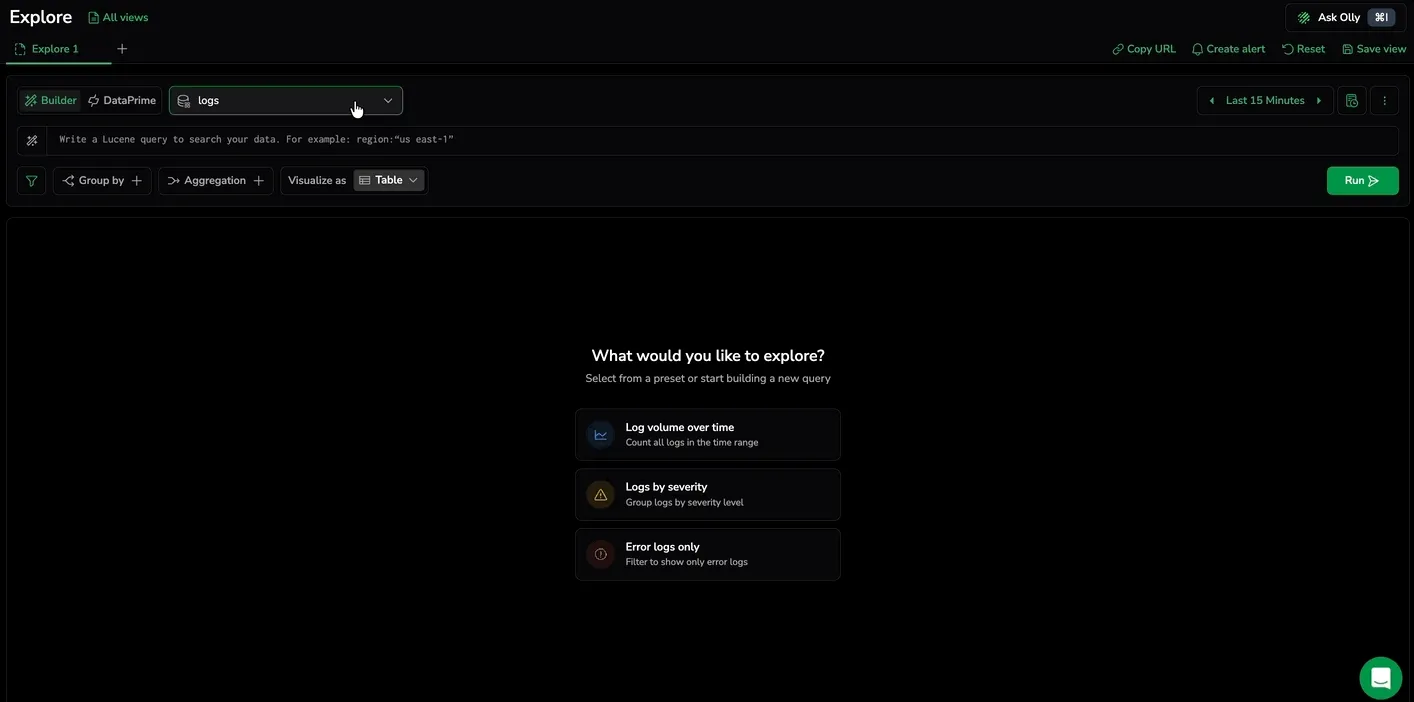
Navigate to Explore from the Coralogix main menu.
Explore opens on an empty state where you choose the view and dataset you want to start with.
Step 2: Select your data source
Use the dataset selector at the top of the screen to choose the dataset you want to query.
- Select
logsto query your ingested log data. - Select
spansto query distributed tracing data. - Select a system dataset to query Coralogix-managed metadata.
For this quickstart, keep the default spans dataset selected.
Step 3: Choose a tab
Use the tab bar at the top of the screen to decide which view fits your question. Tabs share the same query, time range, and filters — switching tabs changes how the same data is presented without restarting your investigation.
Row-level tabs show the spans or traces matching your query:
- Spans (default): individual operations. Start here to find the specific span that explains a symptom.
- Traces: end-to-end requests. If you want to see the full request lifecycle, start with Traces. Use this tab to compare durations, error status, or service coverage across requests.
- Flows: service-to-service interactions as a map. Start here to understand how requests travel across your services.
Analytical tabs render the same query as aggregated views:
- Overview: aggregated rows and charts driven by Group by and Aggregation — rank services by error count, surface the slowest operations, or see the status-code distribution at a glance.
- Signals: Rate, Errors, and Duration for the active query. Switch between Outliers—latency percentiles, error counts, and individual span samples overlaid on a single chart—and RED metrics—Rate, Errors, and Duration as three side-by-side charts.
- Highlights: the fields and values driving latency and errors, with optional period-over-period comparison.
For this quickstart, keep the default Spans tab selected.
Step 4: Set the time range
Use the time range control to set the window for your search.
- Select the time range control in the top-right area of the screen.
- Choose a preset such as Last 1 hour, or enter a custom range.
- Confirm your selection.
The graph above the results table, the table itself, and the query builder all update to reflect the selected time range.
Step 5: Run a search
Use the search bar to filter the spans you want to investigate.
- Select the search bar.
- Type a Lucene query. For example:
tags.error:"true". - Use the autocomplete suggestions to select fields and values without typing the full path.
- Select Run.
Results appear in the spans table below.
You can switch query mode between Query builder, Lucene, and DataPrime at any time. DataPrime is supported only in the Spans tab. Builder-to-DataPrime conversion is always supported; Coralogix confirms before converting a complex DataPrime query back to the builder.
Step 6: Filter with the side bar
Use the side filter bar on the left to narrow your results.
- Open the side bar.
- Find a field you want to filter on—for example, Service.
- Expand the field to see its value distribution.
- Select a value to add it as a filter.
- Select Run to apply.
The filter appears in the query bar. The side bar and query bar stay in sync—changes in either place are reflected in the other.
Core fields at the top of the side bar include Service, Application, Subsystem, Operation, Span kind, and other common span identifiers. Below Core, the side bar lists every other span field and tag grouped into sections by OpenTelemetry semantic convention—HTTP, Database, Messaging, GenAI, RUM, Infrastructure, and more. For the full section list and field prefixes, see Fields for spans.
Step 7: Group and aggregate results
Use the query builder to move from raw spans to grouped summaries. Grouping is useful when you want to compare error rates or request counts across services without reading individual rows.
- Select Group by and choose a field—for example, Service.
- Select Aggregation, pick a field, and choose a function—
countfor any field, oravg,sum,min,max, or a percentile for numeric fields. - Select Run.
The results change from individual span rows to grouped rows with a count per service. Add Order by, Limit, or Having to refine the grouped view.
Use the Errors toggle and the Duration filter in the query builder to narrow grouped results to failing or slow operations.
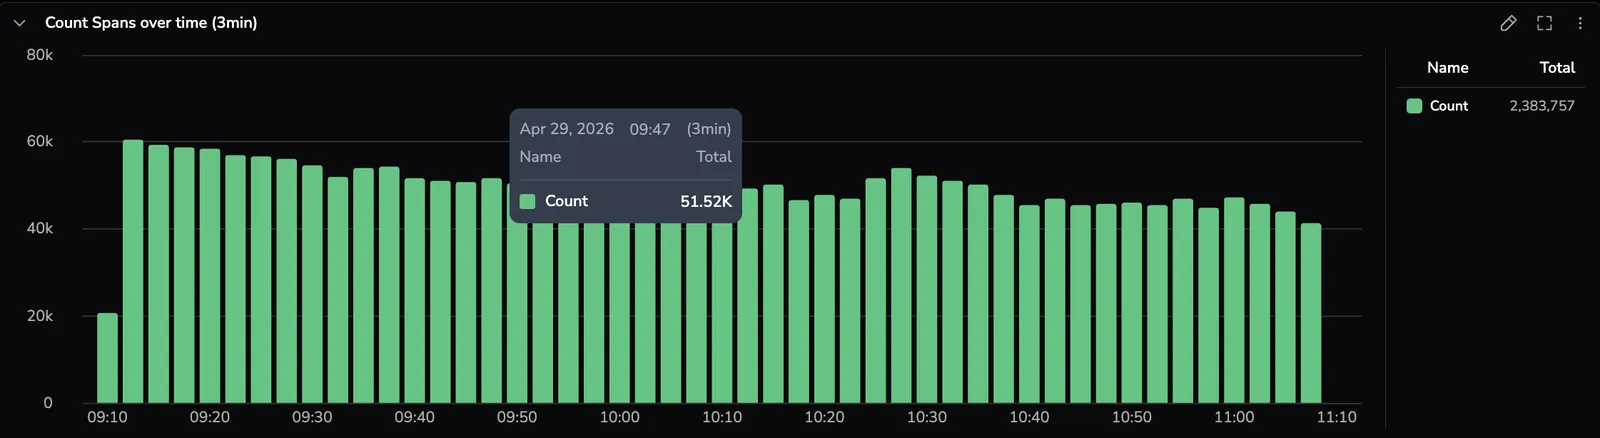
Step 8: Read the count graph
A Count Spans over time chart sits above the results table and updates with the active query and time range. Each bar shows the number of spans in a time bucket so you can spot volume trends before drilling into individual spans.
Hover any bar to inspect the count for that bucket, drag across a time window to zoom, or select a data point to include or exclude the value in the query and to open the drilldown drawer on a representative span.
Step 9: Inspect a span
Select any row in the spans table to open the drilldown drawer.
- In the results table, select a span of interest.
- The drilldown drawer opens on the right.
From the drawer you can:
- Review all fields and tags for the selected span.
- Switch between the Dependencies, Gantt, and Flame views to see how the span fits within its trace.
- Use field-level actions to include or exclude values in the query.
- Pivot to related data—logs, events, profiling, infrastructure, and AI sessions—while preserving the span's context and timeframe.
For the full reference, see Investigate with the span drilldown.
Common query examples
Try these queries to explore more.
Show only spans with errors:
tags.error:"true"
Filter by service:
coralogix.metadata.serviceName:"checkout-service"
Find spans longer than 100 ms in DataPrime:
source spans
| filter $m.duration > 100000000
Combine a service and an error filter:
coralogix.metadata.serviceName:"checkout-service" AND tags.error:"true"
Navigate back
Use the browser back button or the main menu to navigate away from Explore. Your current tab configuration is not saved automatically—select Save view from the action bar before navigating away if you want to return to this configuration.
Next steps
Get familiar with the shared building blocks of the Explore spans page in Explore common components.