Logs table
The logs table is the default results view in Explore. It displays individual log entries as rows, with fields rendered as columns. Use the table to scan results, compare field values across entries, sort by specific columns, and open individual logs for deeper inspection.
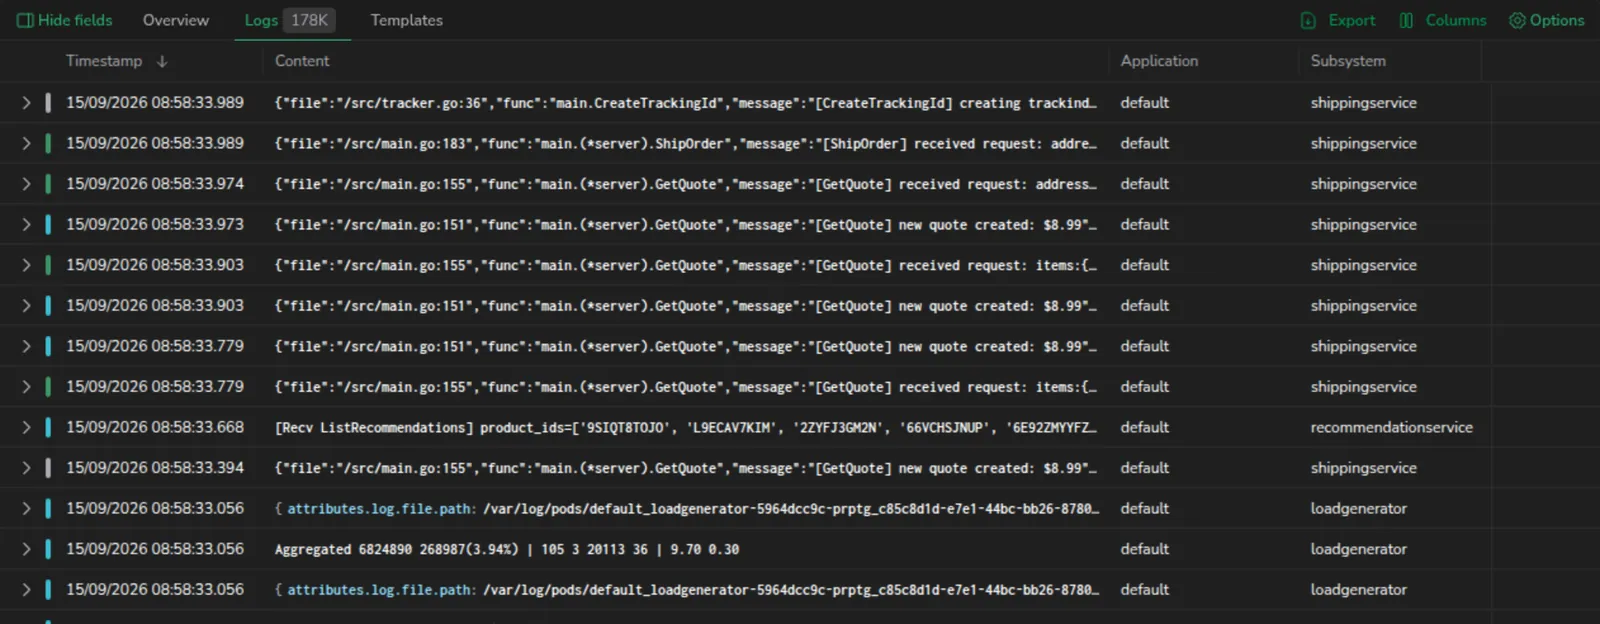
Columns
Add, remove, reorder, and reset columns to customize what information appears in the table.
Add columns from column management
- Select Columns in the table header.
- Search for a field by name, or browse the list.
- Select the field to add it as a column.
- Drag the field to reorder it in the column list.
- Close the panel to save your changes.
Drag the left edge of the panel to resize it, useful when field names or values are long enough to truncate in the default width. The panel keeps its position while you resize; your chosen width applies for the rest of the session.
Add a column from a log entry
You can also add a column directly from an individual log entry without opening the column management panel:
- Select a log row to open the log details panel.
- Find the field you want to add as a column.
- Open the field's context menu (three dots or hover actions).
- Select Add as a column.
The column appears immediately in the table.
Reset column layout
To restore the default column configuration:
- Select Columns.
- Select Reset to default.
This removes any custom columns and restores the original layout.
Sort or remove columns
- Sort: Select a column header to sort by that column. Select again to reverse the sort order. An indicator shows the active sort column and direction.
- Remove: Hover over a column header and select the remove icon, or open Columns and deselect the field.
Row display options
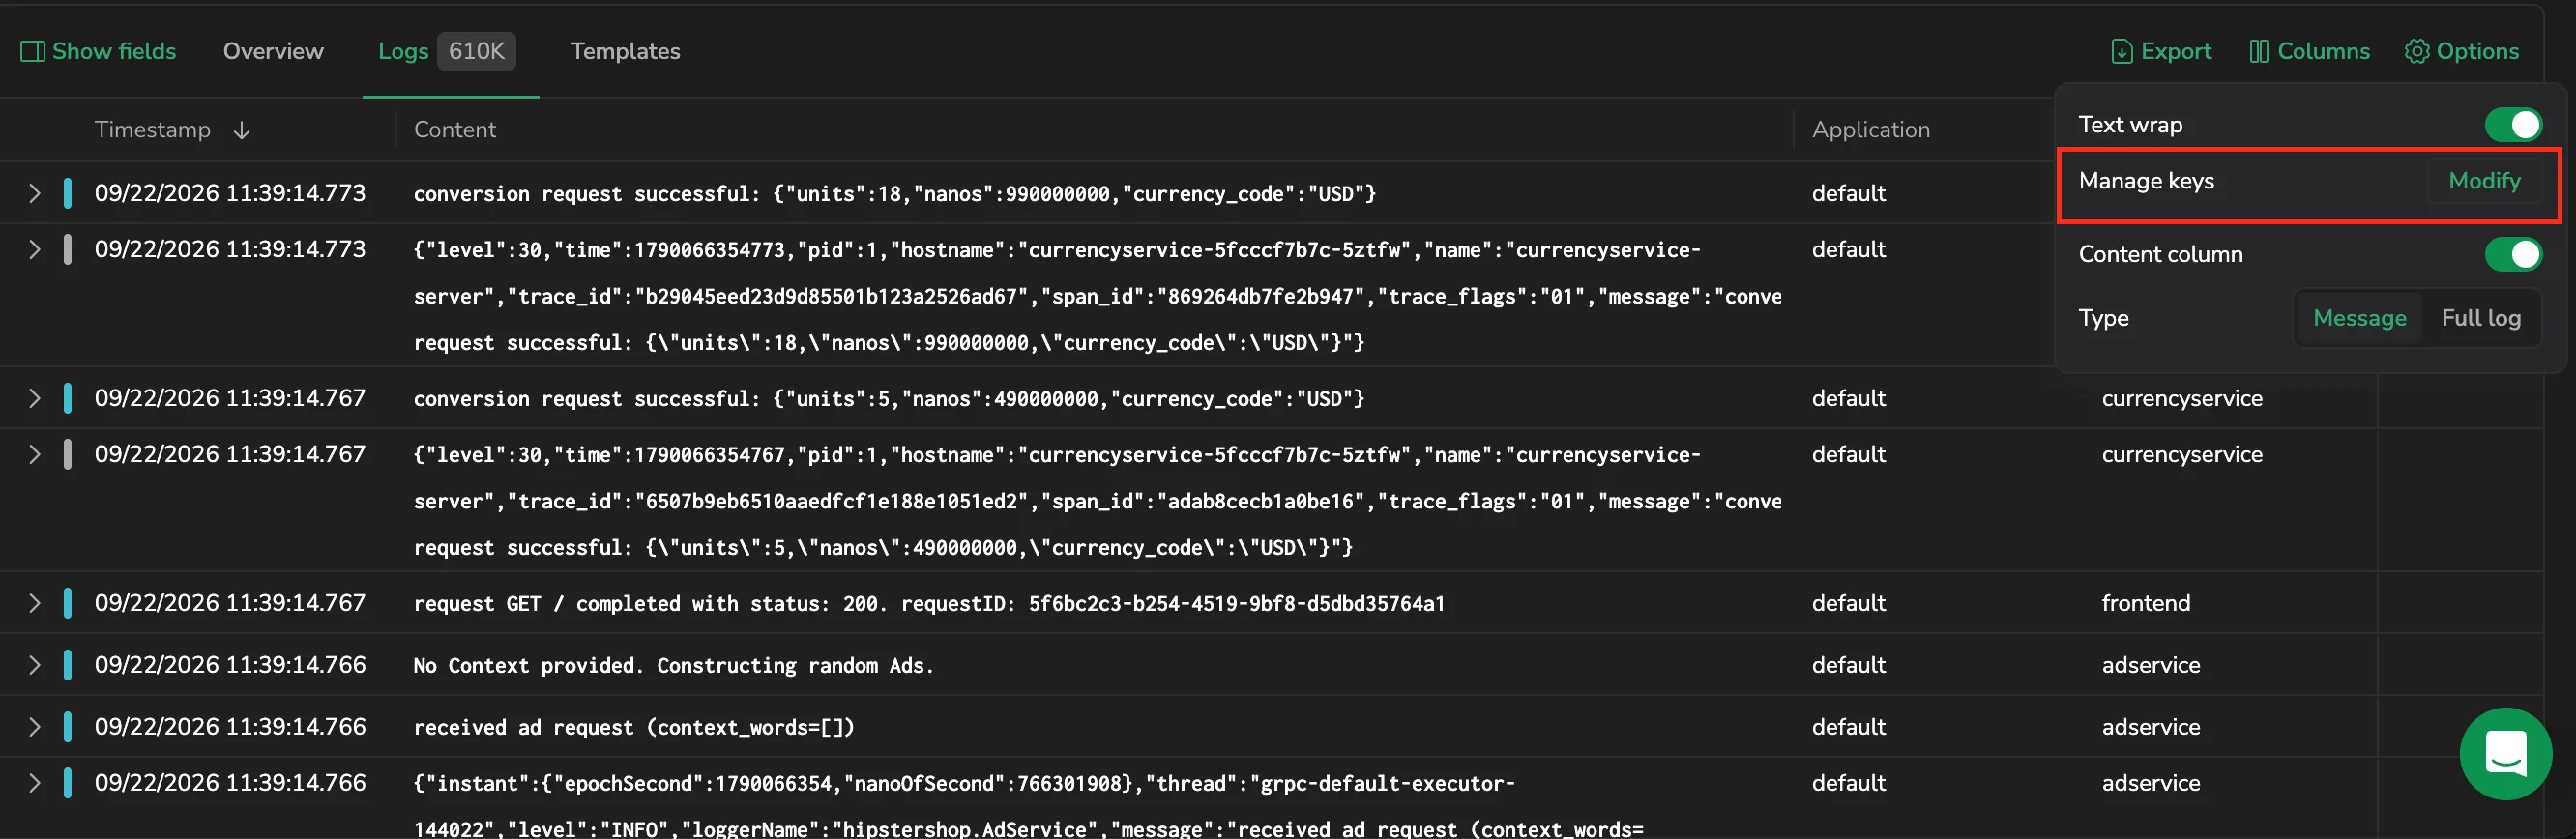
Select Options in the results toolbar to control how each log row renders. The popover holds:
- Text wrap: off by default, so every row stays on a single truncated line for fast scanning of high volumes. Turn it on to wrap each entry to its own height, up to a maximum, so long messages stay readable without opening the log.
- Content column: show or hide the Content column.
- Type: set what the Content column shows for each row. Message shows the log's message; Full log shows the full log with all of its attributes.
- Display: available when text wrap is on. It sets how each wrapped row renders: JSON (the formatted JSON tree), Condensed (a denser layout that fits more entries on screen), or List (key fields without raw JSON). With text wrap off, Display has no effect and every row shows the compact single-line preview.
- Manage keys: select Modify to open the Manage keys drawer and choose which keys populate the Content column, as described in Manage keys.
Manage keys
The Content column is the primary display column for each log entry. It shows the log message or the values of the fields you select. For nested JSON, the column keeps the inner structure but drops the outermost wrapping key.
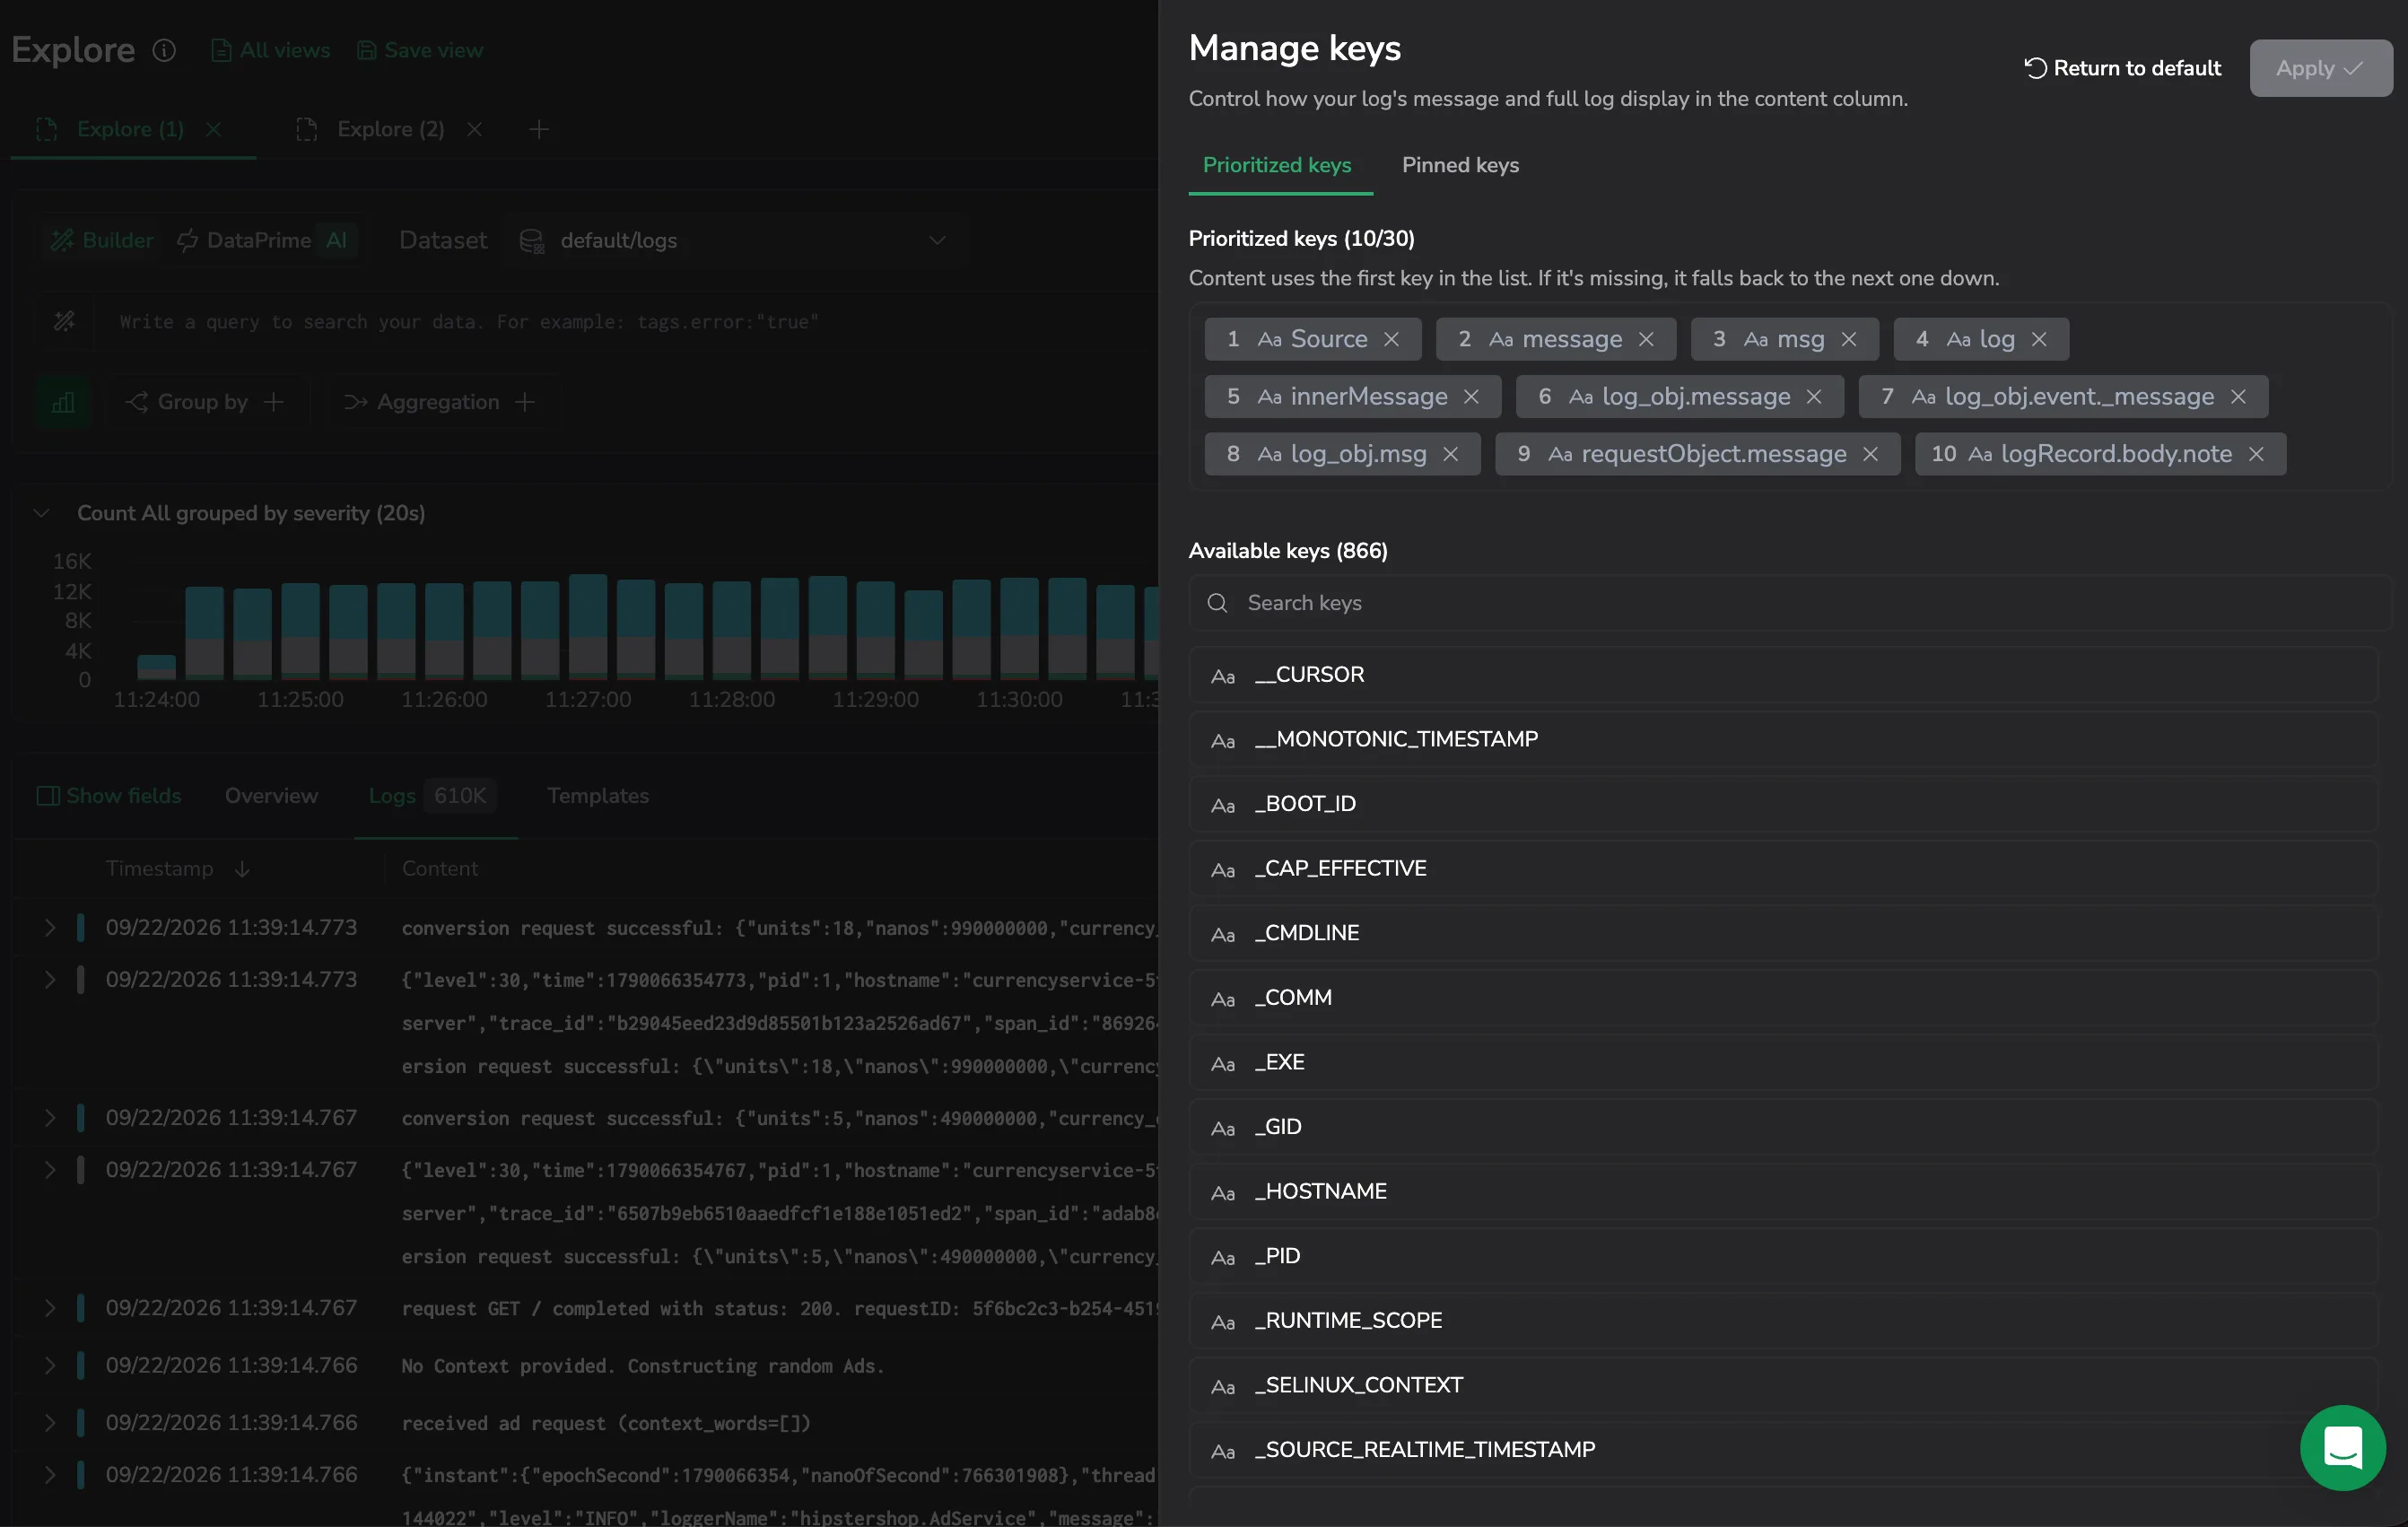
Open the Manage keys drawer from the Options popover: select Modify next to Manage keys. The drawer has two tabs that do different jobs: Prioritized keys set the Content column's message, and Pinned keys surface properties at the top of the full log. Each tab lists its keys as numbered chips above a searchable Available keys list, and one Apply commits the changes you make on both tabs. Apply stays disabled until you make a change, and nothing takes effect until you select it.
Prioritized keys
The Prioritized keys tab controls the message the Content column shows when its Type is Message. Content uses the value of the first key in the list that the log contains, falling back to the next one down if that key is missing. If the log contains none of them, the Content column shows the full log instead. The built-in default keys are ordinary chips you can reorder, remove, and restore like any other. You can prioritize up to 30 keys, and Return to default in the drawer header restores the default set.
Pinned keys
The Pinned keys tab surfaces a fixed set of keys at the top of each log when the Content column's Type is Full log. Each pinned key the log contains appears at the top of the entry, in the order you set and marked with a pin icon, while its original key/value pair stays in place so the log still reads whole. Pinning applies wherever the whole log renders (the Content column in Full log, the Source column, and the expanded row), but not to the single-value Message view. Only keys from the log body can be pinned, and you can pin up to 20. Reset in the drawer header restores the default set.
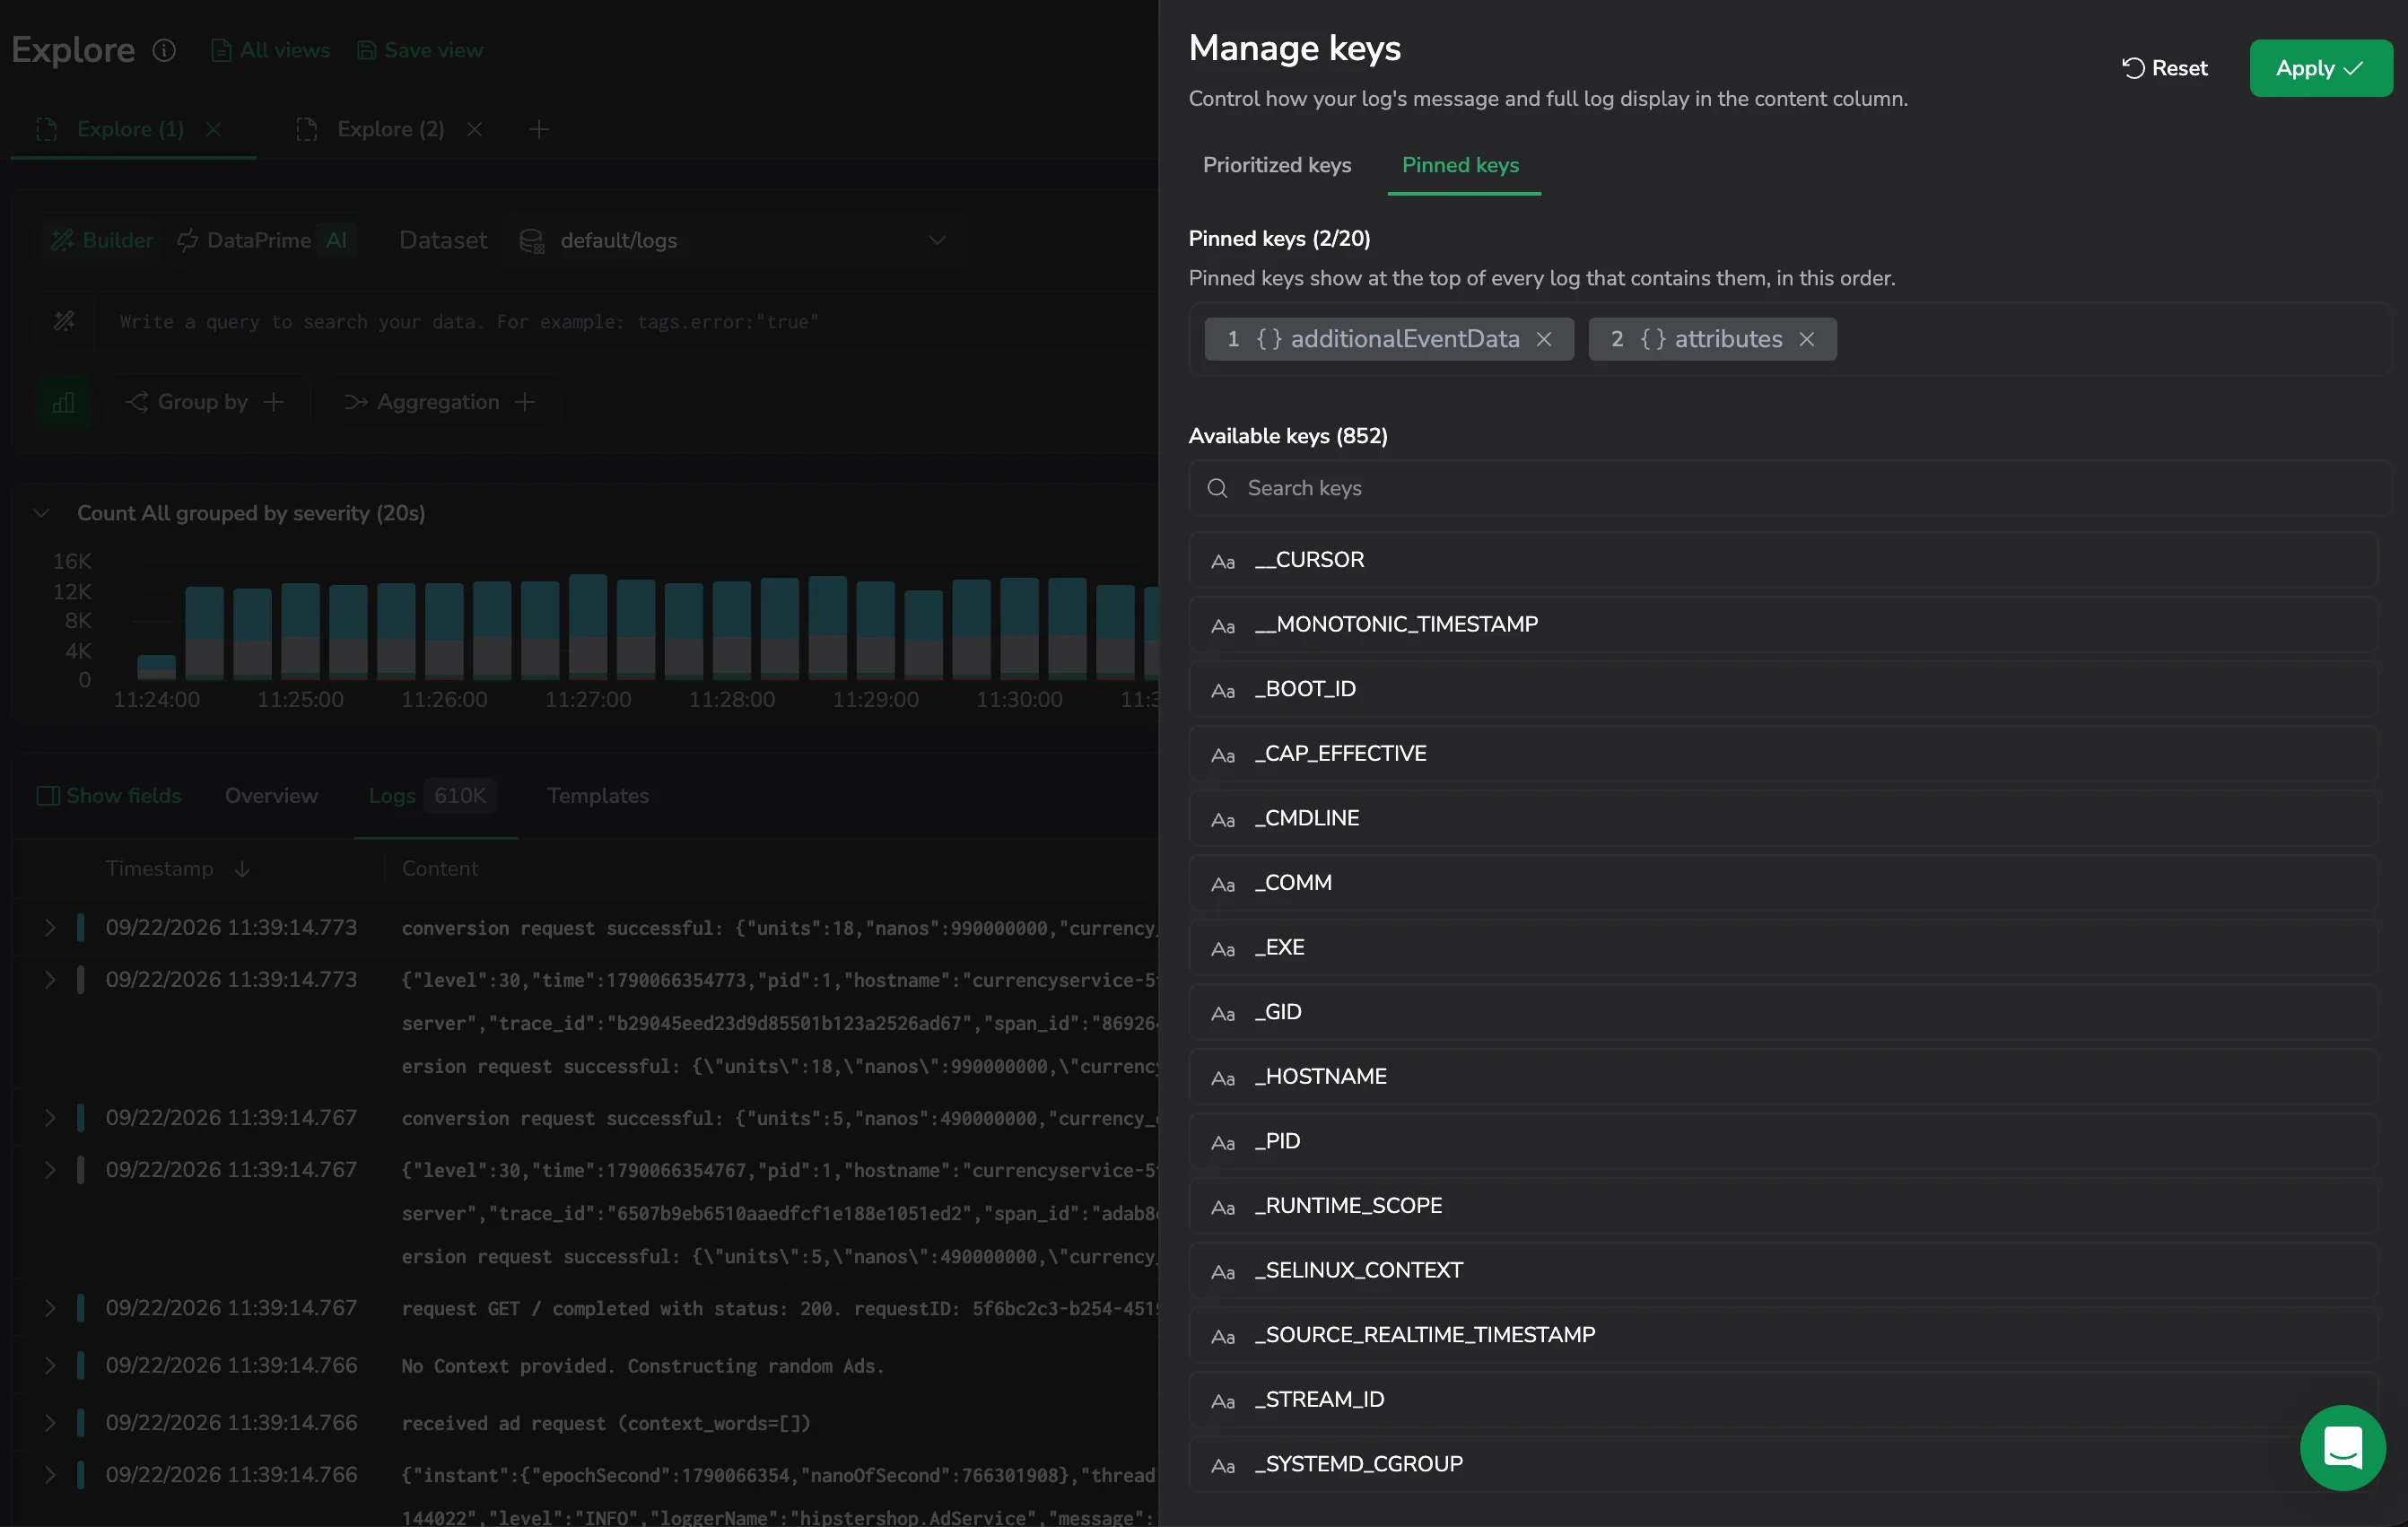
Pinned keys respect your prioritized keys: they change what surfaces at the top of the full log, not which key becomes the Content message. Use Prioritized keys to choose the one value that represents each log, and Pinned keys to keep the properties you scan for first visible when you open the full log.
Add, reorder, and remove keys
The chips work the same way on both tabs:
- Add a key: select a key in Available keys to move it into the list. On the Pinned keys tab, the action is labeled Pin.
- Reorder: drag a chip to a new position, or use the arrow keys once the chip is focused. The number is the key's position in the list.
- Remove a key: select the × on a chip, or press Delete or Backspace while the chip is focused. The key returns to Available keys.
Each tab's header shows a live count of its keys, for example Prioritized keys (10/30) or Pinned keys (2/20). Once you reach a tab's limit, adding more is disabled until you remove a key.
Expand a row
Each log row has an expand control at its left edge. Select it, or double-click an empty area of the row, to expand the row in place and reveal the full log with all of its attributes. Select the control again, or double-click the expanded row, to collapse it.
To open the full log details panel instead of expanding in place, select the row's open-details control or press Enter.
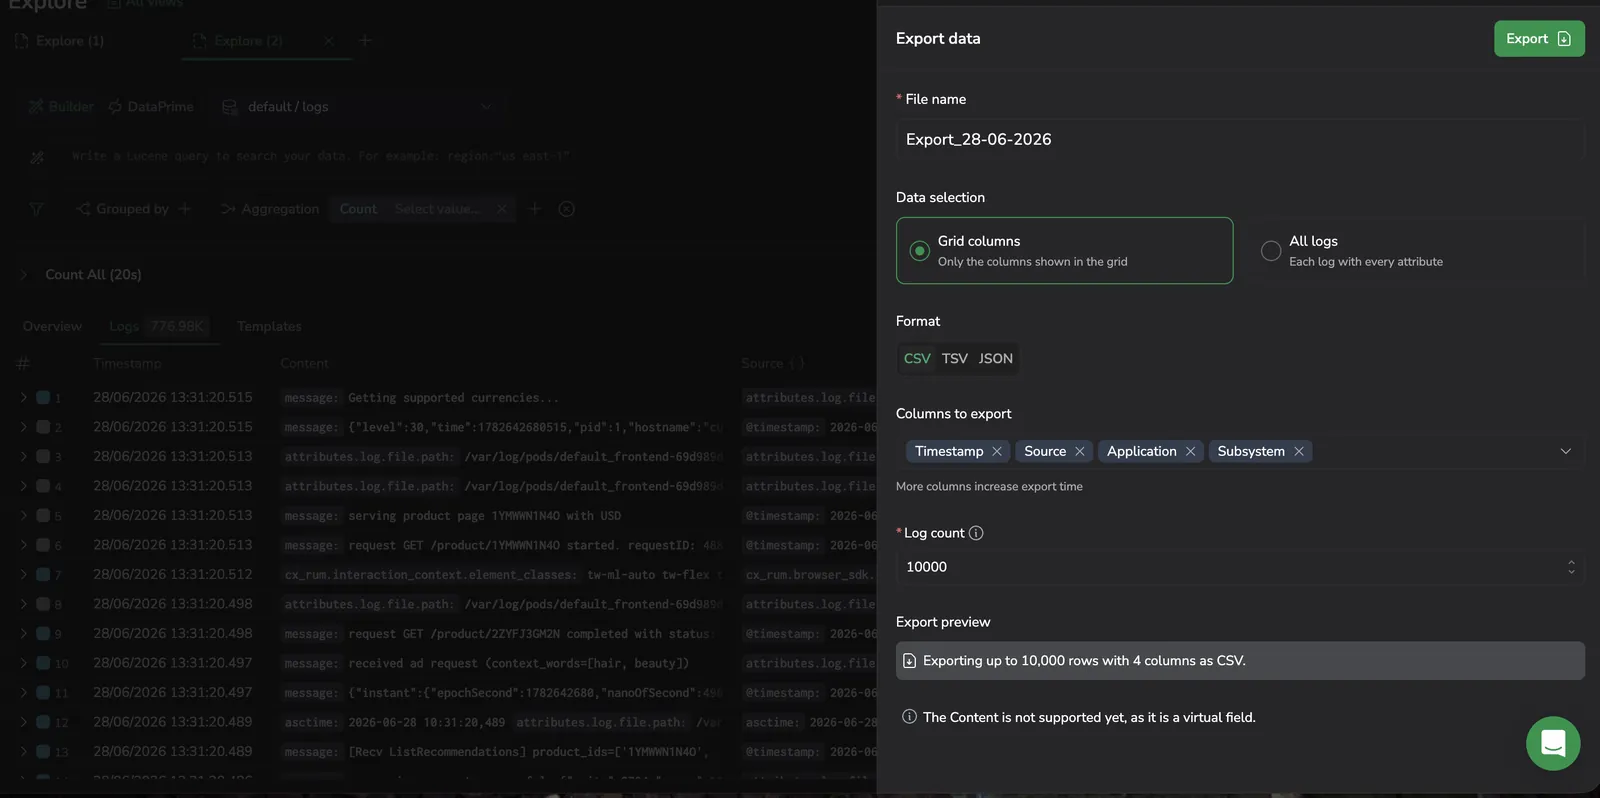
Export logs
Export the current results to a file for offline analysis or sharing:
- Select Export in the table header.
- Choose the export format (for example, CSV or JSON).
- Confirm the export.
The export includes the logs matching your current query and time range, up to the supported export limit.
Row actions
Open the menu next to any row to access actions scoped to that row. The menu is row-type-aware. Log rows expose the actions below; aggregation/grouping rows add See raw logs, Filter by, Exclude, and Copy value; trace and span rows add export and copy actions specific to those record types.
For a log row, the menu lists:
- Custom Actions: opens a list of custom actions configured for your account.
- Copy log: copies the full log entry to the clipboard.
- Copy log ID: copies the log's unique ID. Use this to share a permalink, correlate with an external system, or paste the ID into a query.
- Open info panel: opens the log details panel for the selected entry.
- View surrounding logs: opens a list of duration presets. 5 Seconds, 30 Seconds, 1 Minute, 5 Minutes, or 10 Minutes: to load logs from the same source within ± that interval of the selected event. The action drops any active filters and rebuilds the query with only a scoping clause:
applicationNameandsubsystemNamefor logs,serviceNameandoperationNamefor spans, andsession_context.session_idfor therum.eventsdataset. On therum.eventsdataset, the action label changes to View surrounding events. - Copy permalink: copies a URL that recreates the current query, time range, and selected log.
Add a log to Olly context
Send a specific log to Olly when you want to ask about that exact record instead of the full query result. The action lives in a right-pinned column in the logs table. The column has no header, and the button appears only when you hover the row.
- Hover the log row you want to send to Olly. The Olly icon appears at the right edge of the row.
- Select Add to Olly context.

Olly opens in a drawer with the log already attached as a data-context chip, labelled with the log's timestamp, with an entity icon, and a tooltip that reads Log: <timestamp>. Add more rows by hovering other logs and selecting the same action; each one becomes its own chip. See Page and data context for chip behavior and removal.
The Olly column stays pinned to the end of the table and isn't part of the column layout. You can't move it, hide it from Manage columns, or include it in a saved view. The button doesn't appear on rows where the log has no resolvable ID.
Fields sidebar actions
Actions available from the Fields sidebar apply to the table view and modify the query or column layout.
Show distribution
| Entry point | Result |
|---|---|
| The Show distribution icon on a field in the Fields sidebar | Opens a drilldown drawer grouped by the field |
| Log details panel, key menu | Opens the same drilldown drawer |
The drawer groups your current results by the field. It has two parts: Unique values, a chart of the field's distinct values with their counts (a horizontal bar chart by default, with a chart-type dropdown to switch the visualization), and Results, the rows that make up the grouping. Select Apply to main to carry the grouping into the main Explore view.
Actions inside the panel
The graph-for-key panel and any other slide-in log panel that opens from a chart drilldown share the same row and cell actions as the main logs table:
- Open the more actions menu on any row to access Open info panel, View surrounding logs (or events on
rum.events), Copy log, Copy permalink, and Custom Actions. - Select a value in a row to open the same field-level context menu listed in Value menu, including Custom Actions. These panels skip the Value across time action since it points back to a panel you're already viewing.
Group by
Select Group by from the Fields sidebar context menu to add the field to the Grouped by clause in the Query Builder. The table switches from individual log rows to aggregated groups, showing each unique value and its count.
Other sidebar actions
The three-dot menu on each Fields sidebar entry also exposes:
- Add as a column / Remove from columns: manage which sidebar fields appear as table columns.
- Copy path: copy the field's full dot-notation path.
- Add to favorites / Remove from favorites: pin or unpin the field at the top of the sidebar (per source and dataset).
Value rows under an expanded field use a checkbox to include or exclude the value, plus an Only action to narrow the field to that value alone.
.keyword meansSome string filters use a .keyword suffix (for example, serviceName.keyword:"checkly"). The base field is analyzed (broken into lowercase tokens, so it matches individual words) while the .keyword variant keeps the whole value as a single exact string and matches it verbatim. When you filter on a string value in Builder mode, Explore applies the .keyword match automatically; numeric and boolean values match directly, without it. See Filter chips for more.
Key-value context menu
Field-level actions live in two context menus that differ by what you select. Selecting a value (in a log row, or in the log details panel) opens the value menu. Selecting a key in the log details panel opens the key menu.
Key menu
Select a field key in the log details panel. Because you selected a key and not a value, the two filter actions filter by field presence (whether the field is set at all) rather than by a value:
| Action | Description |
|---|---|
| Exists | Filters to records where the field is set. A field-presence filter (Lucene _exists_:<field>). |
| Not Exists | Filters to records where the field is not set (Lucene NOT _exists_:<field>). |
| Add as a column | Adds the field as a column in the logs table. |
| Group by | Adds the field to the Grouped by clause, aggregating the table by this field's values. |
| Add to favorite fields | Pins the field to the top of the Fields sidebar for the current source and dataset. |
| Copy path | Copies the field's full path. |
| Copy the key's value | Copies the field's current value for this log. |
| Copy the key:value | Copies the full key:value pair. |
| Show distribution | Opens a drilldown drawer grouped by this field. See Show distribution for details. |
Exists and Not Exists are the same field-presence filters available on each field in the Fields panel. To filter on a specific value rather than the field's presence, use the Value menu.
Value menu
Select a field value in a log row. By default the menu filters on the exact value; to filter on a substring, first select only the part of the value you want, for example, highlight failed aggregating inside a longer message. The filter then matches that text wherever it appears in the field.
| Action | Description |
|---|---|
| Custom Actions | Opens a list of custom actions scoped to the selected value. |
| Filter by | Adds the field-value pair as an exact-match filter on the current query. Shown when the whole value is selected. |
| Add to filter | Adds a substring filter that matches the selected text wherever it appears in the field. Replaces Filter by when you select only part of a value. Works in both Builder and DataPrime. |
| Exclude | Excludes the field-value pair from the current query, the exact value, or the selected substring on a partial selection. |
| Query value | Replaces the entire query with a single filter for this value. Use this to pivot to a fresh search on the selected value without keeping prior filters. |
| Service drilldown | Opens the service catalog drilldown for the selected service. Only shown when the field is a service-name field. |
| Create metric alert | Generates a metric from the clicked field-value pair via the Events2Metrics flow and opens the metric-alert editor on it. Only shown when the value is numeric and you have both the Events2Metrics and metric-alert update permissions. |
| Copy path | Copies the field's full path (for example, cx_rum.session_context.session_id). |
| Copy value | Copies the field value. |
| Copy key | Copies the field name. |
| Value across time | Opens a time-series chart of how often this field-value combination appears across the query's time range. |
| Live tail | Opens LiveTail filtered to the selected field-value pair. Only available for Application and Subsystem field values. |
| Open URL | Opens the value in a new browser tab. Only shown when the value is an http:// or https:// URL. |
Next steps
Filter and search on the fields detected in your results with the Fields side bar.