Fastly logs via HTTPS streaming
Fastly's real-time log streaming feature provides the ability to send Fastly logs to any HTTPS endpoint.
Fastly supports real-time log streaming of data that passes through it. Fastly supports a number of protocols that allow you to stream logs to a variety of locations, including third-party services, for storage and analysis.
The following tutorial demonstrates how to set up your HTTPS endpoint to Coralogix from your Fastly account.
Prerequisites
-
Logging endpoint for HTTPS streaming enabled for your Fastly account. As it is disabled by default, you are required to contact [email protected] to enable it.
Configuration
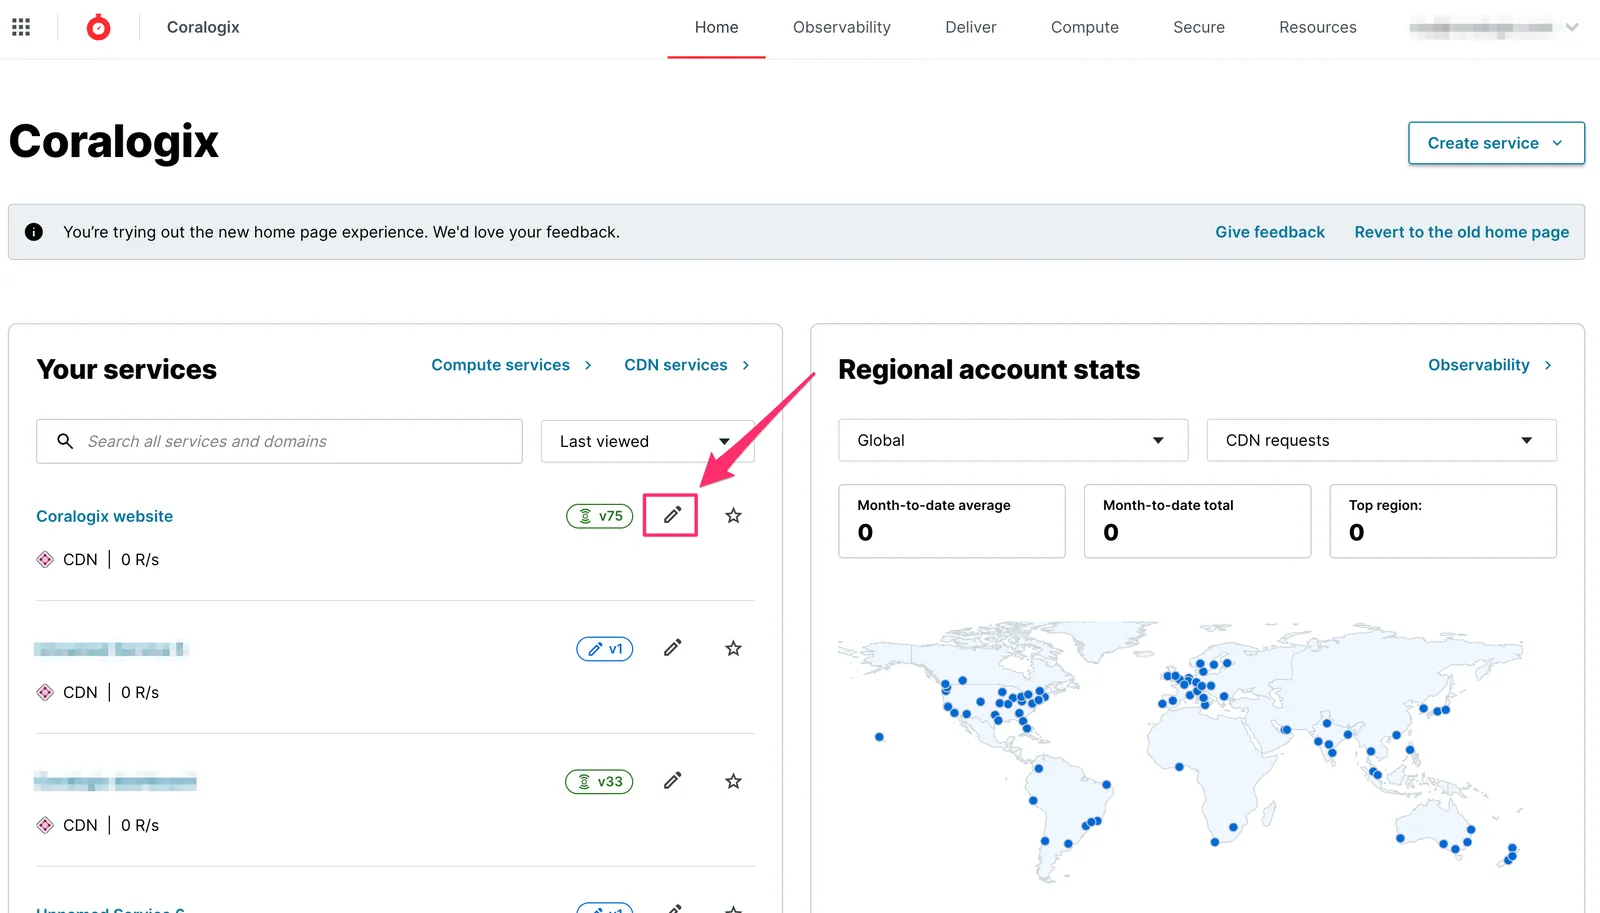
STEP 1. Log in to your Fastly account.
STEP 2. You will see a listing of all configured services. Click Configure.
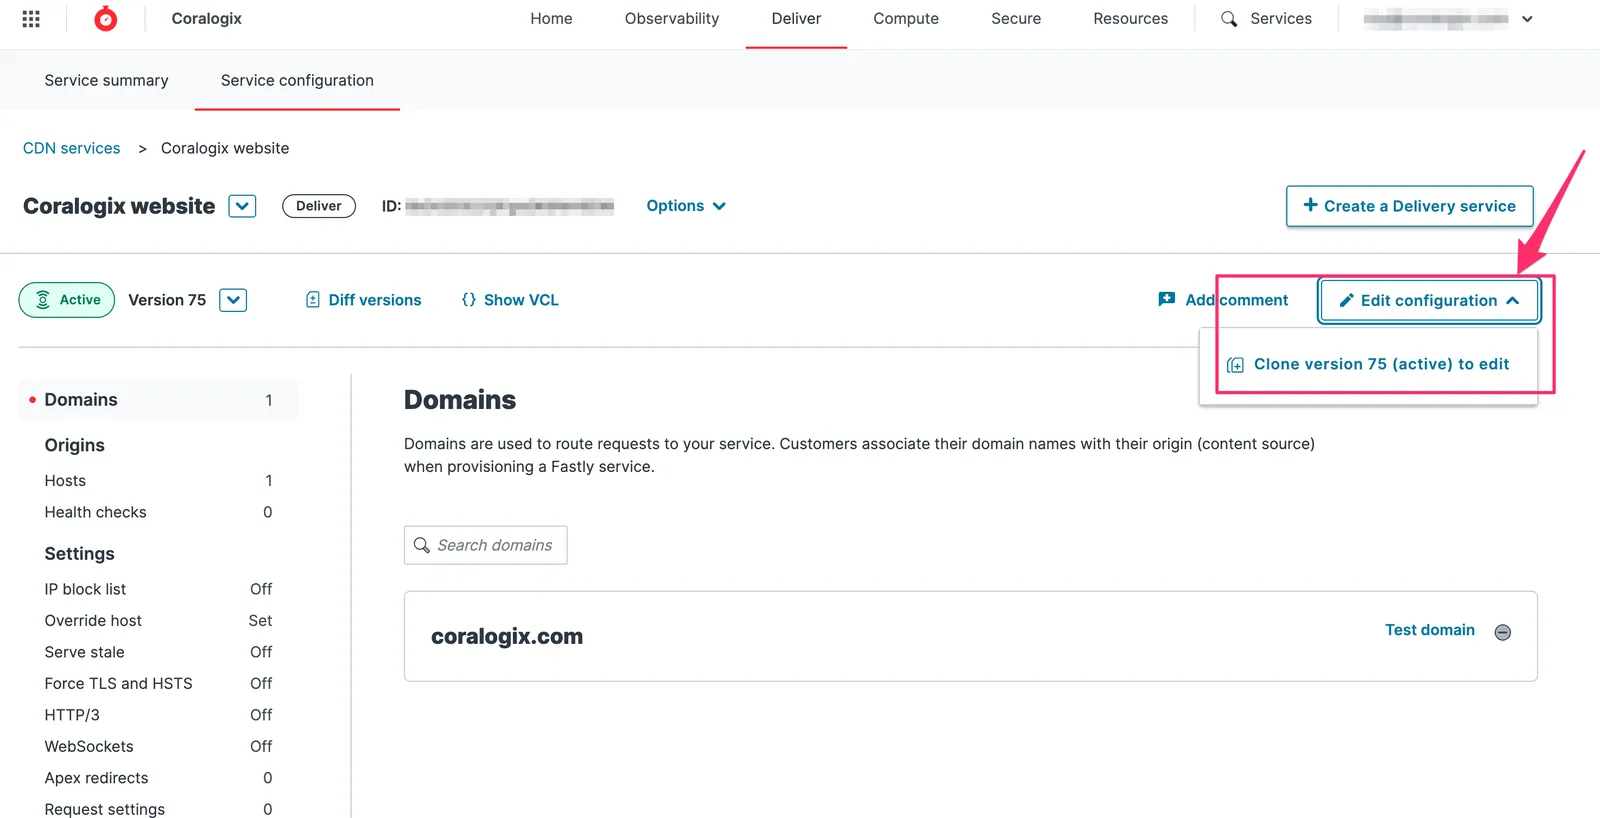
STEP 3. Click Edit configuration. Clone to access editing.
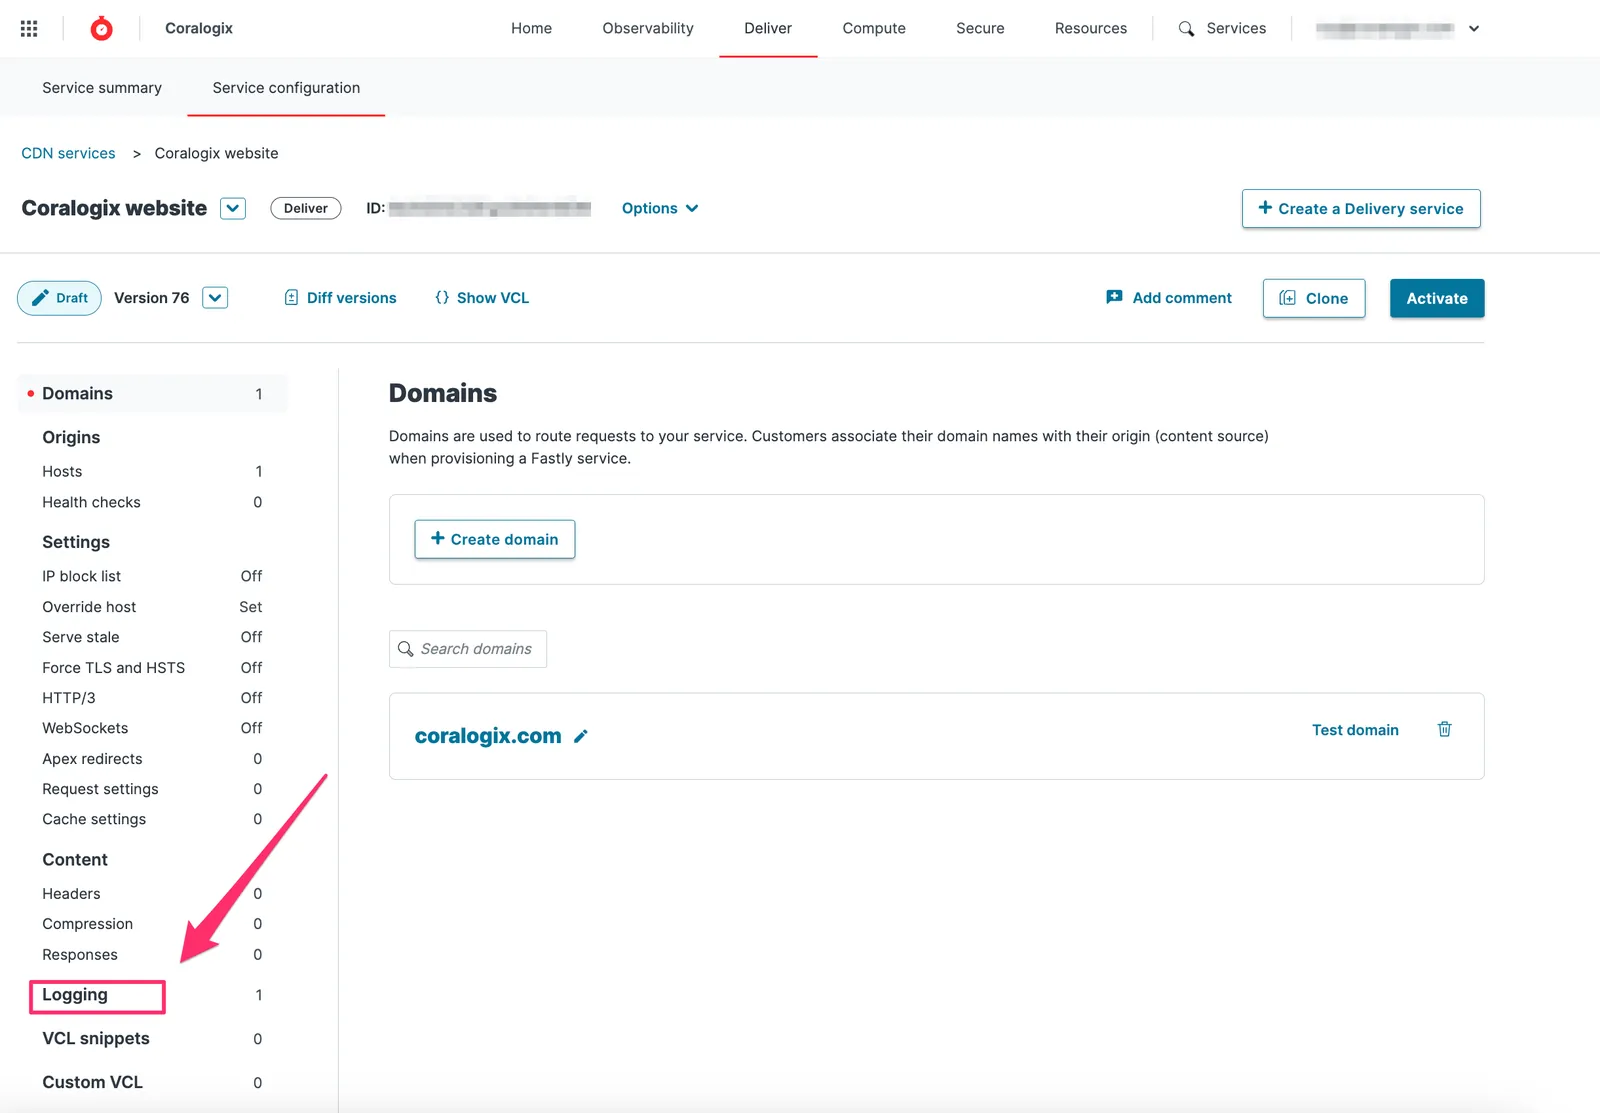
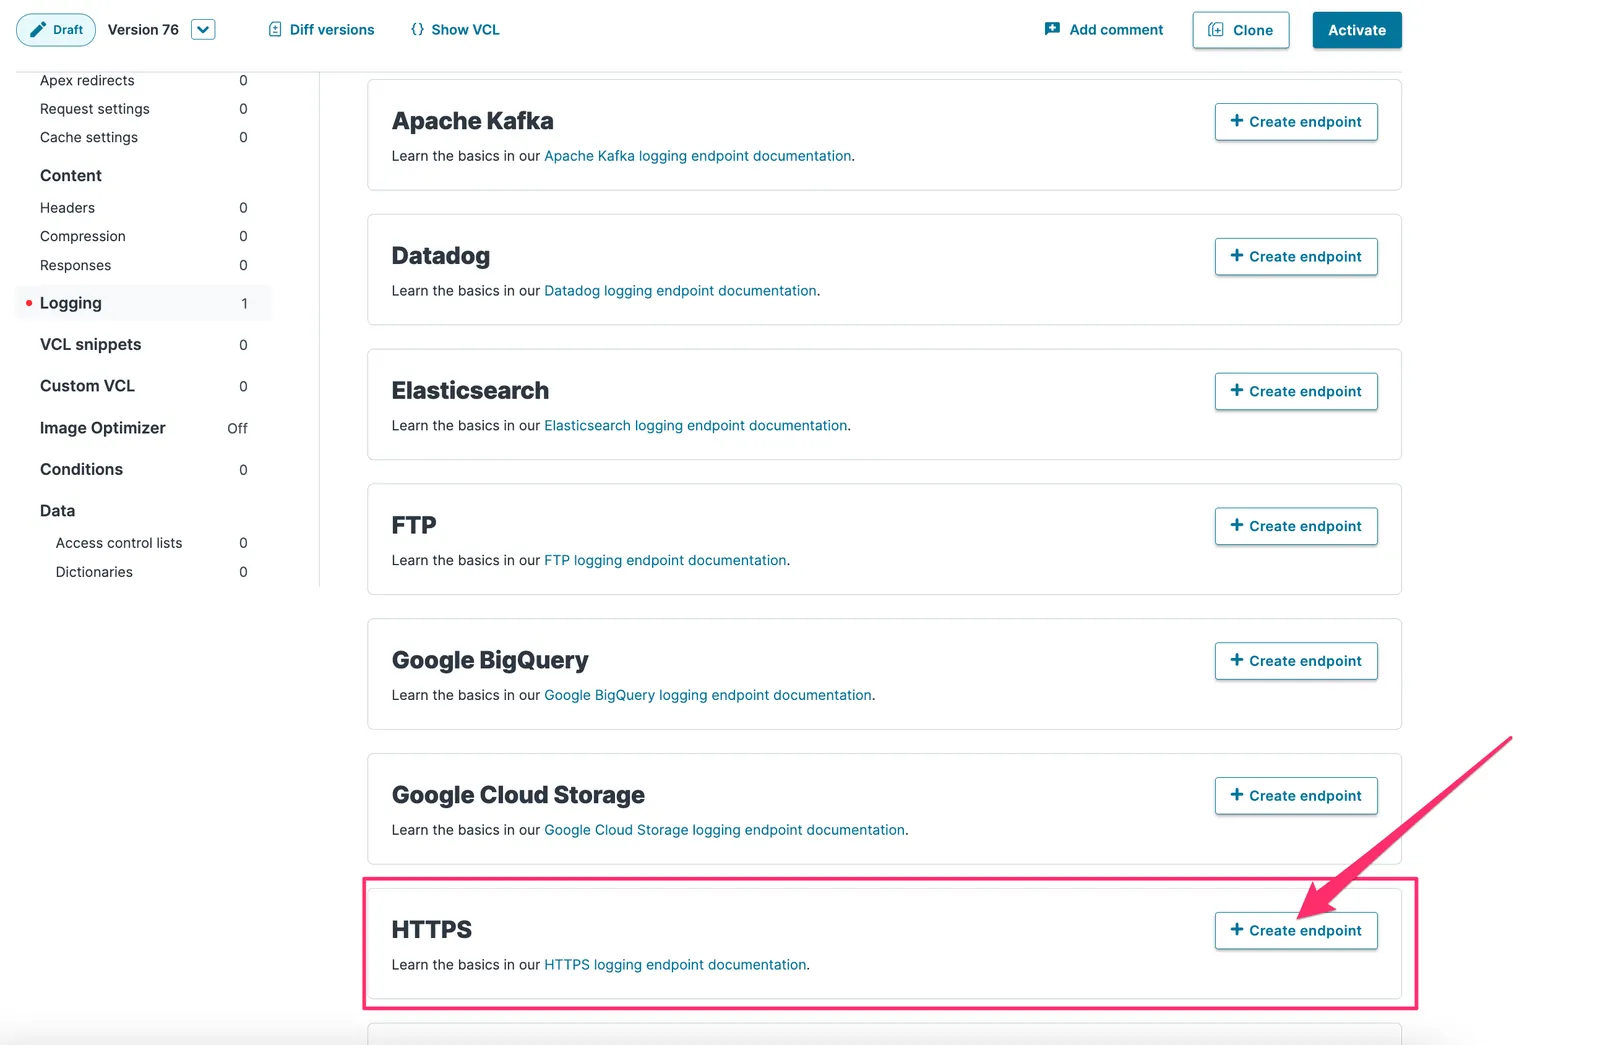
STEP 4. In the left-hand panel, click Logging.
STEP 5. Click Create endpoint.
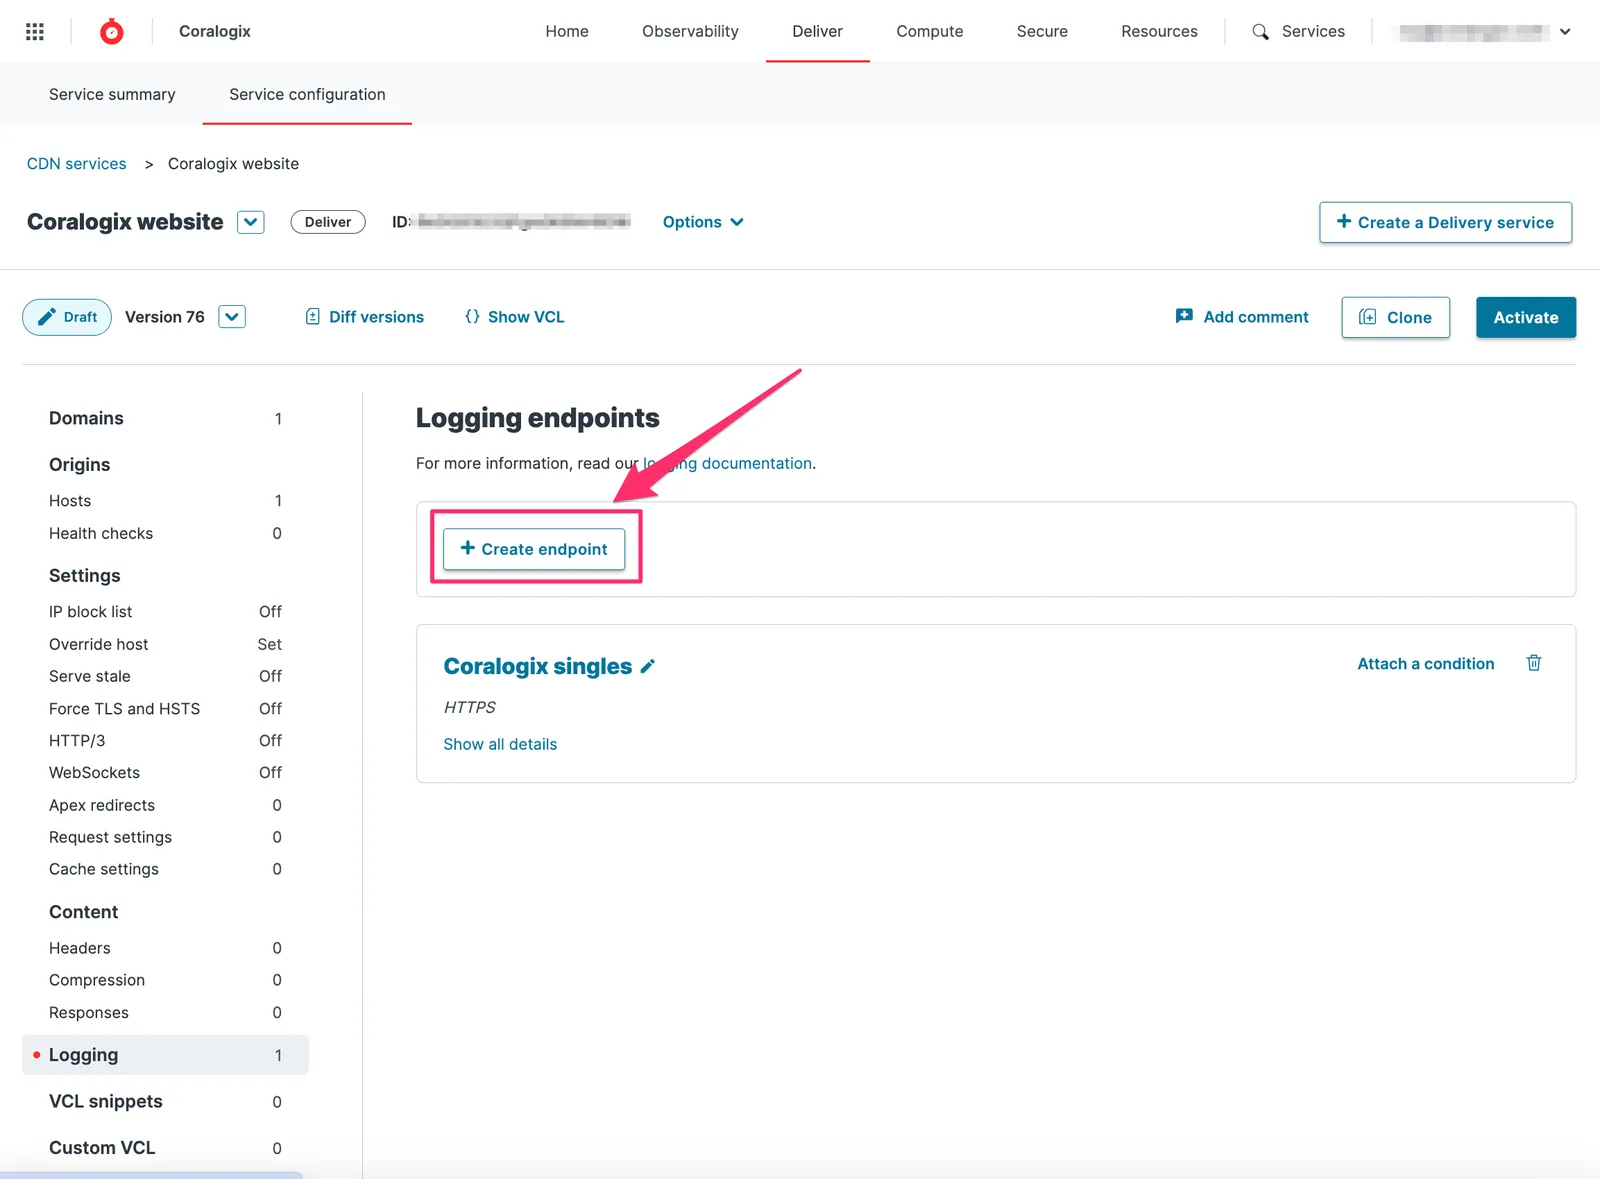
STEP 6. Scroll down the page and select HTTPS. Click on the associated Create endpoint button.
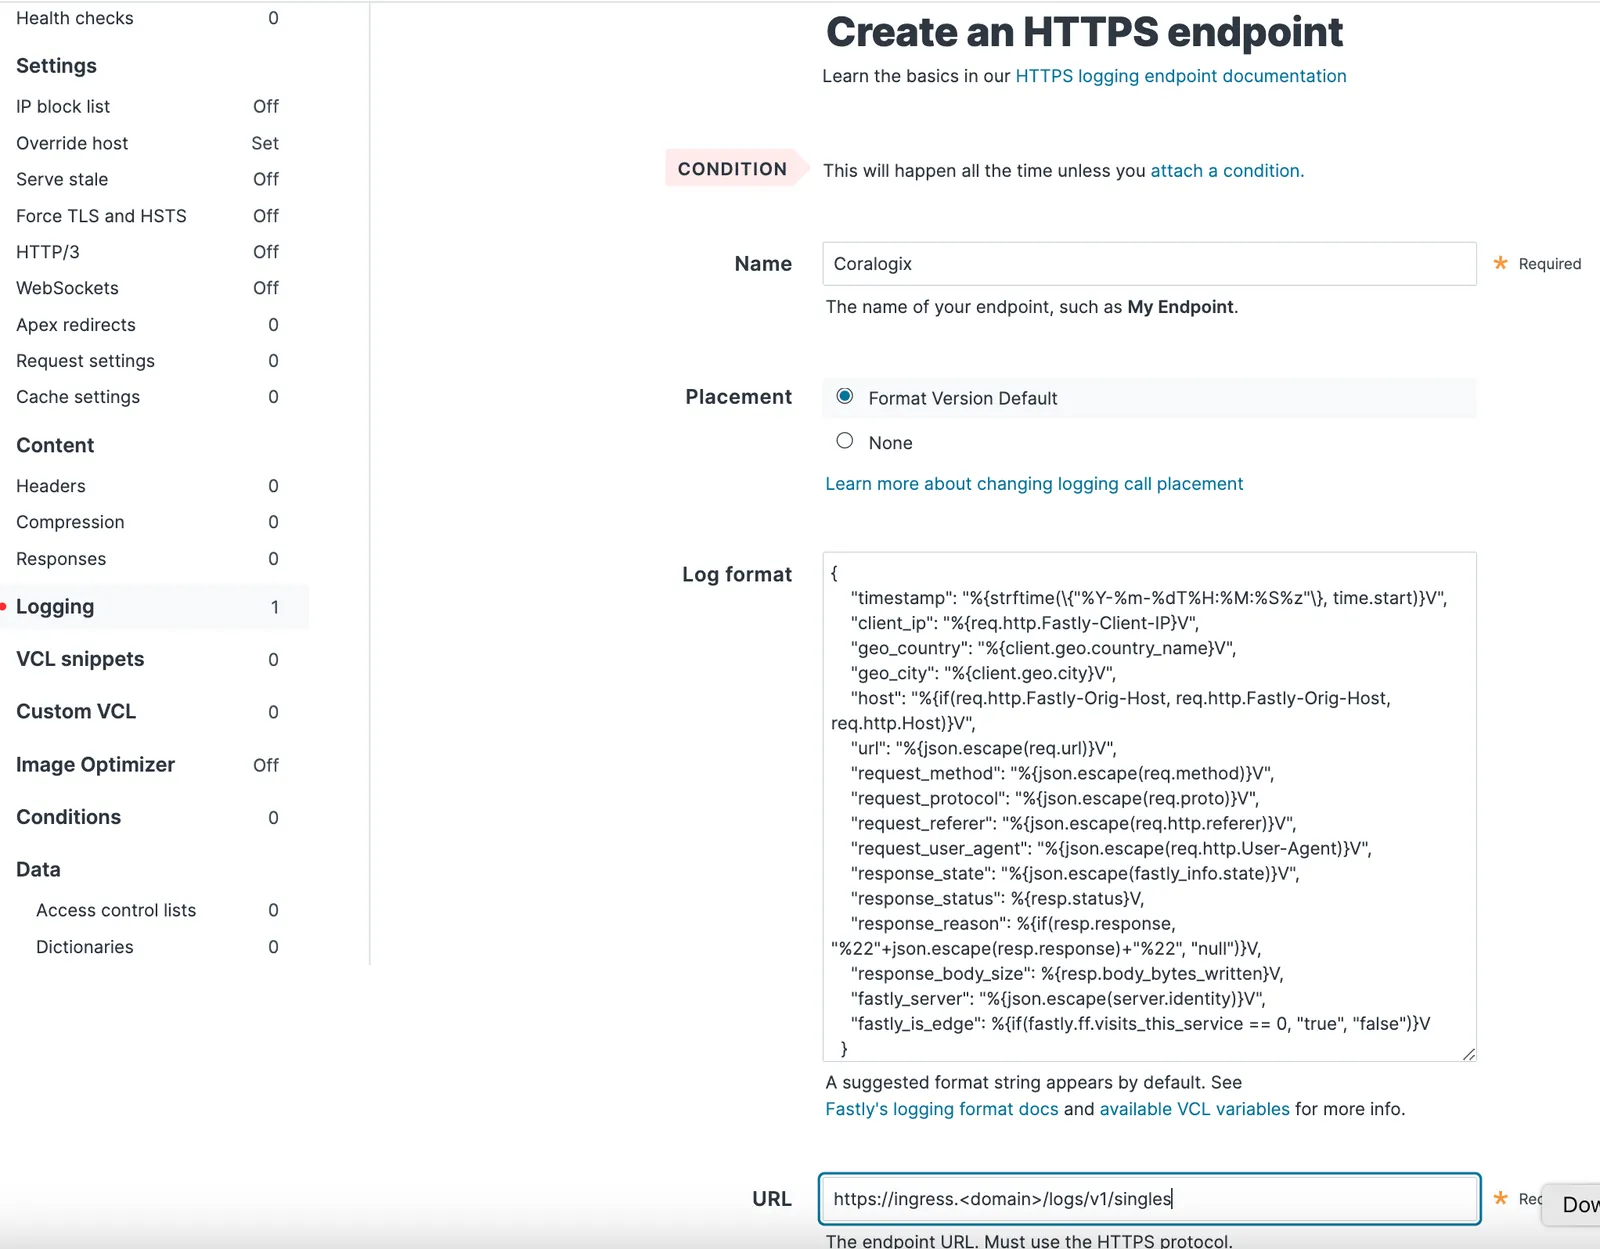
STEP 7. Create an HTTPS endpoint by completing the required fields.
-
Name. Enter a human-readable name.
-
Placement. Select Format Version Default.
-
Log format. Input the following.
{
  "timestamp":%{time.start.msec}V,
  "applicationName":"fastly",
  "subsystemName":"%{req.service_id}V",
  "severity": 3,
  "json": {
    "time": {
        "start":"%{begin:%Y-%m-%dT%H:%M:%S%Z}t",
        "end":"%{end:%Y-%m-%dT%H:%M:%S%Z}t",
        "elapsed":%D
    },
    "cdn_server": {
        "ip_ipaddr":"%A",
        "code":"%{server.datacenter}V",
        "hostname":"%{server.hostname}V",
        "region_code":"%{server.region}V",
        "response_state":"%{fastly_info.state}V",
        "is_h2":%{if(fastly_info.is_h2, "true", "false")}V,
        "is_h2_push":%{if(fastly_info.h2.is_push, "true", "false")}V,
        "h2_stream_id":"%{fastly_info.h2.stream_id}V"
    },
    "client": {
        "city_name":"%{client.geo.city.utf8}V",
        "country_code":"%{client.geo.country_code}V",
        "country_name":"%{client.geo.country_name}V",
        "continent_code":"%{client.geo.continent_code}V",
        "region":"%{client.geo.region}V",
        "ip_ipaddr":"%h",
        "name":"%{client.as.name}V",
        "number":"%{client.as.number}V",
        "connection_speed":"%{client.geo.conn_speed}V",
        "location_geopoint": {
            "lat":%{client.geo.latitude}V,
            "lon":%{client.geo.longitude}V
        }
    },
    "response": {
        "status":%>s,
        "content_type":"%{Content-Type}o",
        "age":"%{Age}o",
        "cache_control":"%{Cache-Control}o",
        "expires":"%{Expires}o",
        "last_modified":"%{Last-Modified}o",
        "tsv":"%{TSV}o",
        "header_size":%{resp.header_bytes_written}V,
        "body_size":%B
    },
    "request": {
        "host":"%{req.http.host}V",
        "is_ipv6":%{if(req.is_ipv6, "true", "false")}V,
        "backend":"%{req.backend}V",
        "service_id":"%{req.service_id}V",
        "url":"%{cstr_escape(req.url)}V",
        "url_ext":"%{req.url.ext}V",
        "header_size":%{req.header_bytes_read}V,
        "body_size":%{req.body_bytes_read}V,
        "method":"%m",
        "protocol":"%H",
        "referer":"%{Referer}i",
        "user_agent":"%{User-Agent}i",
        "accept_content":"%{Accept}i",
        "accept_language":"%{Accept-Language}i",
        "accept_encoding":"%{Accept-Encoding}i",
        "accept_charset":"%{Accept-Charset}i",
        "connection":"%{Connection}i",
        "dnt":"%{DNT}i",
        "forwarded":"%{Forwarded}i",
        "via":"%{Via}i",
        "cache_control":"%{Cache-Control}i",
        "x_requested_with":"%{X-Requested-With}i",
        "x_att_device_id":"%{X-ATT-Device-Id}i",
        "x_forwarded_for":"%{X-Forwarded-For}i"
    },
    "socket": {
        "cwnd":%{client.socket.cwnd}V,
        "pace":%{client.socket.pace}V,
        "nexthop":"%{client.socket.nexthop}V",
        "tcpi_rcv_mss":%{client.socket.tcpi_rcv_mss}V,
        "tcpi_snd_mss":%{client.socket.tcpi_snd_mss}V,
        "tcpi_rtt":%{client.socket.tcpi_rtt}V,
        "tcpi_rttvar":%{client.socket.tcpi_rttvar}V,
        "tcpi_rcv_rtt":%{client.socket.tcpi_rcv_rtt}V,
        "tcpi_rcv_space":%{client.socket.tcpi_rcv_space}V,
        "tcpi_last_data_sent":%{client.socket.tcpi_last_data_sent}V,
        "tcpi_total_retrans":%{client.socket.tcpi_total_retrans}V,
        "tcpi_delta_retrans":%{client.socket.tcpi_delta_retrans}V,
        "ploss":%{client.socket.ploss}V
    }
  }
}
| Field | Description | Required |
|---|---|---|
| Timestamp | The format should not change. | Yes |
| applicationName | Enter the name of the application. | Yes |
| subsystemName | Enter the name of the subsystem. | Yes |
| Severity | Apply the severity to all logs, using the following choices: 1-debug, 2-verbose, 3-info, 4-warning, 5-error, 6-critical. This can be changed later using an extract rule, as described below. | Yes |
| JSON (object) | Fields can be added or removed. Static fields can be added. Nested JSON formats are supported including any fields described in the Fastly VCL reference. | Yes |
-
URL: Choose the https://ingress./logs/v1/singles endpoint that corresponds to your Coralogix domain using the domain selector at the top of the page.
-
Maximum logs: Leave the default value of
0. -
Maximum bytes: Enter
2000000.
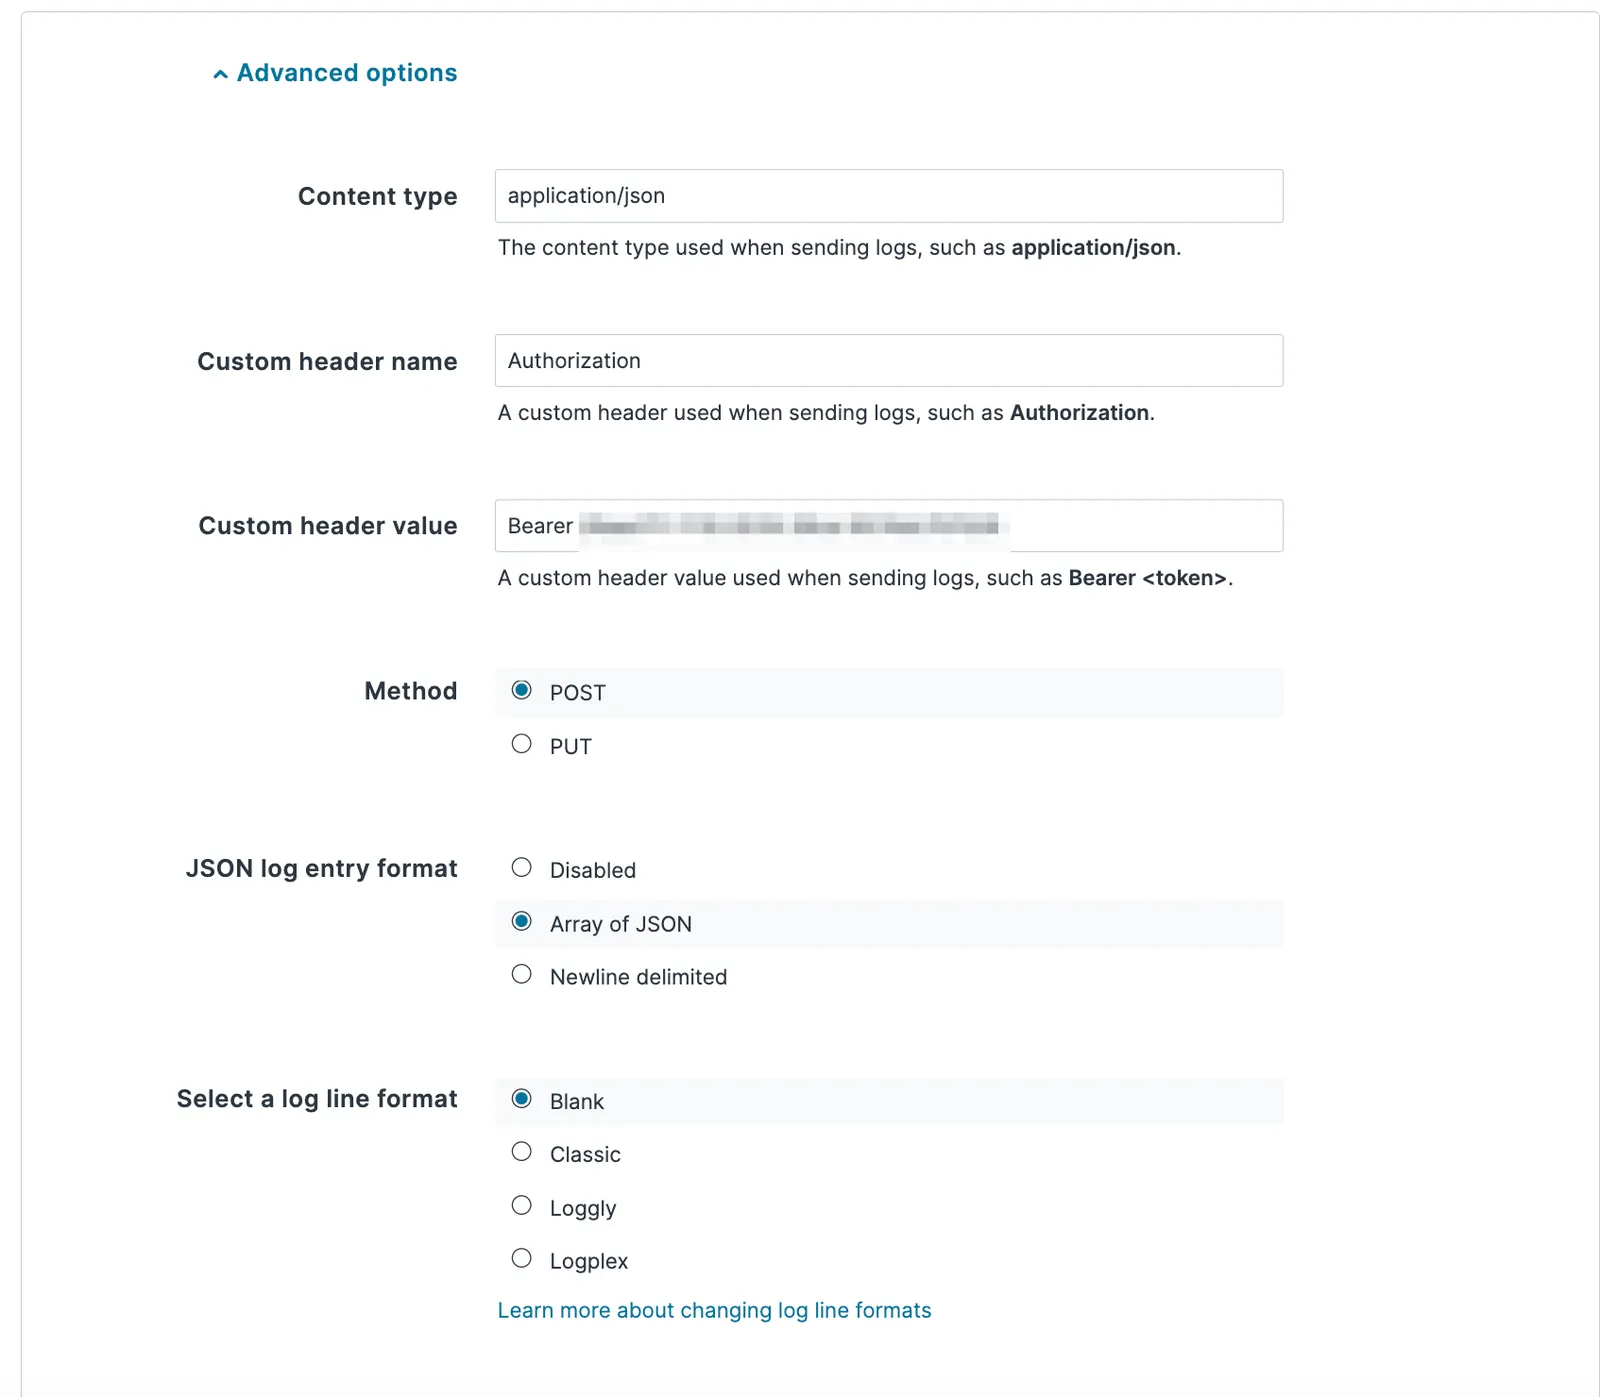
Under Advanced options, fill out the fields as follows:
-
Content type. Enter
application/json. -
Custom header name. Authorization.
-
Custom header value. Bearer Send-Your-Data API key.
-
Method. Select POST.
-
JSON log entry format. Select Array of JSON.
-
Select a log line format. Set to default.
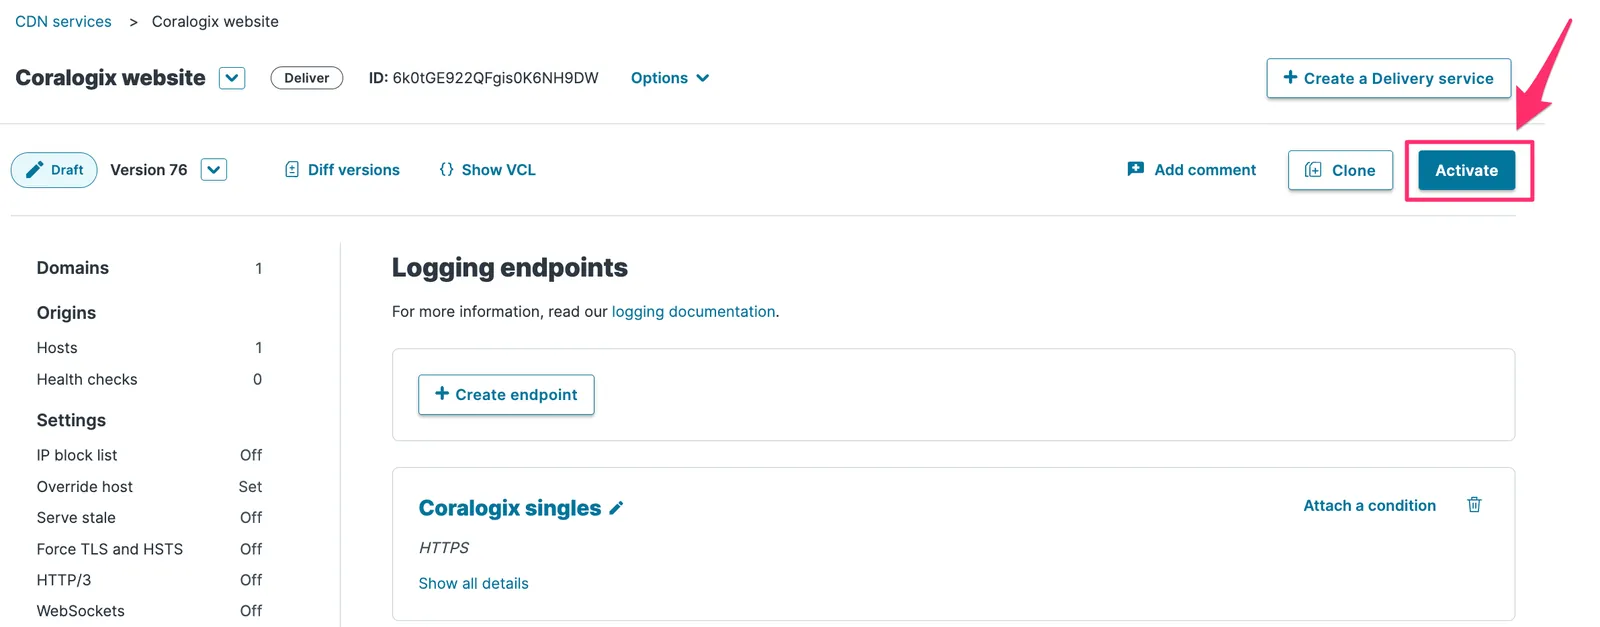
STEP 8. Click Create to create the new logging endpoint. Click Activate to deploy your configuration changes.
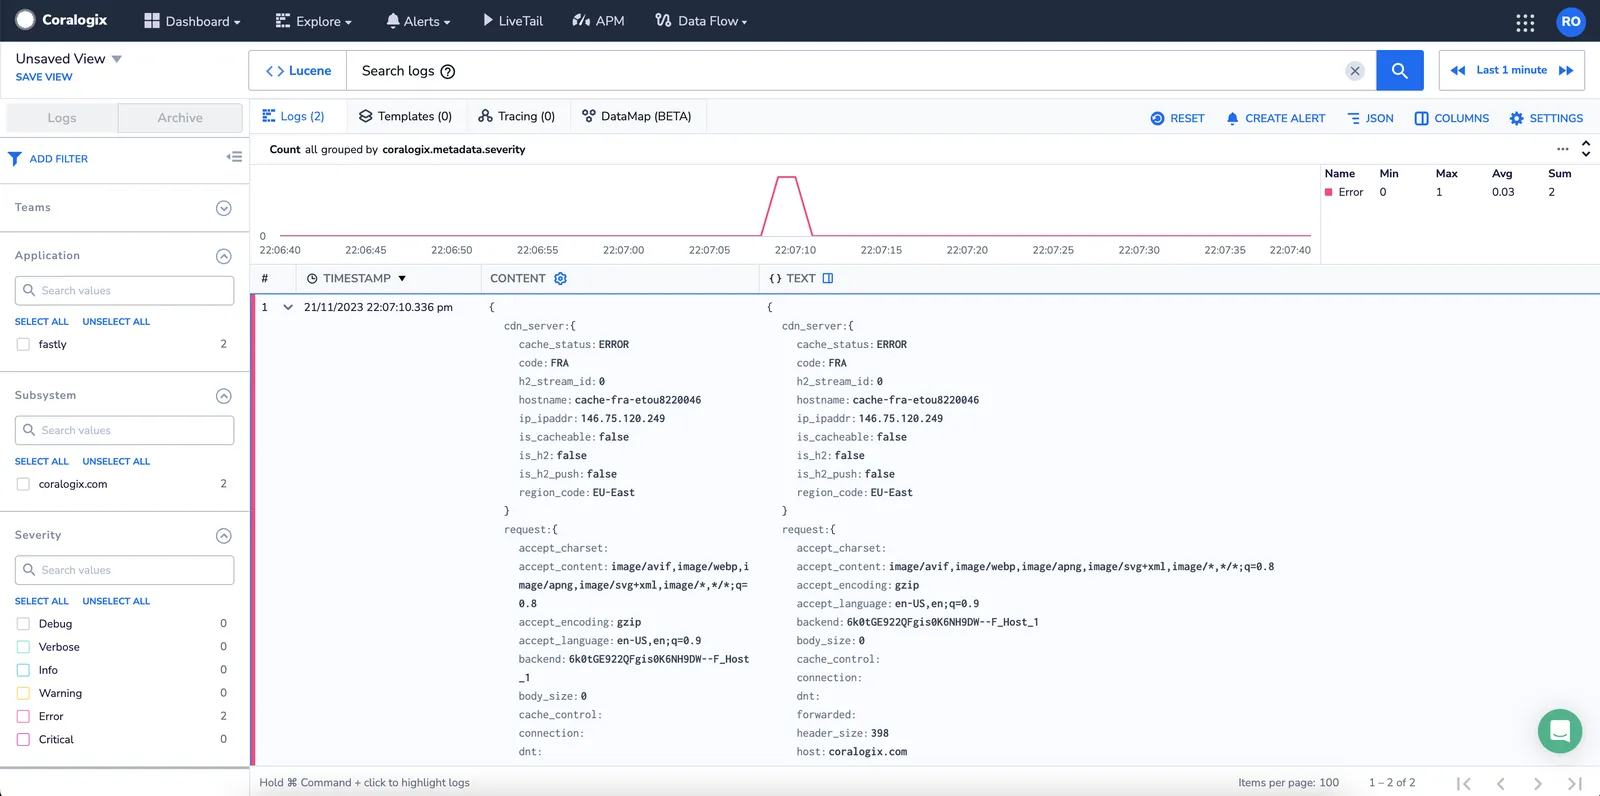
Validation
Validate that you have configured the integration successfully by viewing your test log in your Coralogix dashboard.
Fastly Extension Package
Coralogix offers a variety of out-of-the-box data extensions. Each tailored extension unlocks a set of predefined items – alerts, parsing rules, dashboards, saved views, actions, and more – allowing you to jumpstart Coralogix monitoring of your external-facing resources. Once your configuration is complete, we strongly recommend deploying the Fastly extension package.
STEP 1. In your navigate pane, click Data Flow > Extensions.
STEP 2. Select the Fastly extension.
STEP 3. Click DEPLOY and complete the setup.

Additional resources
| Fastly | Log Streaming: Coralogix Log Streaming: HTTPS |
| Coralogix Endpoints | Coralogix Endpoints |