Incidents
The Incidents screen displays all triggered alert events in Coralogix. View currently active alerts or filter by timeframe, status, type, or severity. Drill down into any incident to investigate the underlying logs, metrics, and traces that triggered it.
Cases is an upgrade to Incidents, and Incidents will be gradually replaced. New accounts work with Cases by default. To understand how the two differ, see Cases vs Incidents. For programmatic access, use the Cases API.
The Incidents page filters results based on the alert's retriggering period. An actively firing alert may not appear if the next retriggering event has not occurred within the selected time window. For consistent visibility of active issues regardless of retriggering period, use Cases.
What you can do
- View all triggered alerts or filter by timeframe
- Organize incidents by alert definition
- Filter by status, type, severity, labels, or assignment
- Update incident status (triggered, acknowledged, resolved)
- Drill down into any triggered event to view its contextual data
- Sort alerts in chronological order
How incidents are organized
Triggered alerts are bundled as incidents based on the Group By tags and notification settings defined in your alert definition.
Group by tags
The Incidents screen shows all permutations for the key-value tags selected in the Group By conditions of your alert.
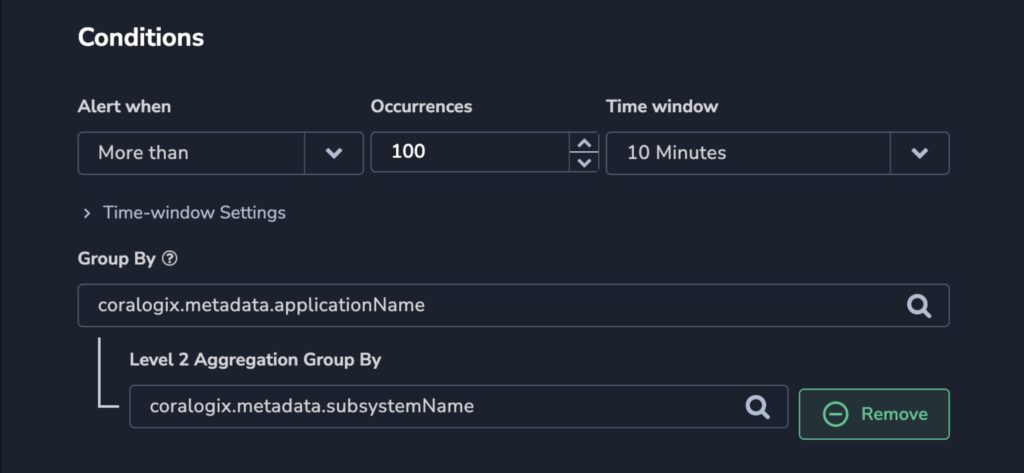
Alerts are grouped by one or more key-value tags aggregated into a histogram. An alert triggers when the condition threshold is met for a specific aggregated key within the specified timeframe.
When using two Group By tags, matching data is first aggregated by the parent tag (for example, applicationName), then by the child tag (for example, subsystemName). The alert fires when the threshold meets the unique combination of both. Only data that includes the selected Group By tags is counted.
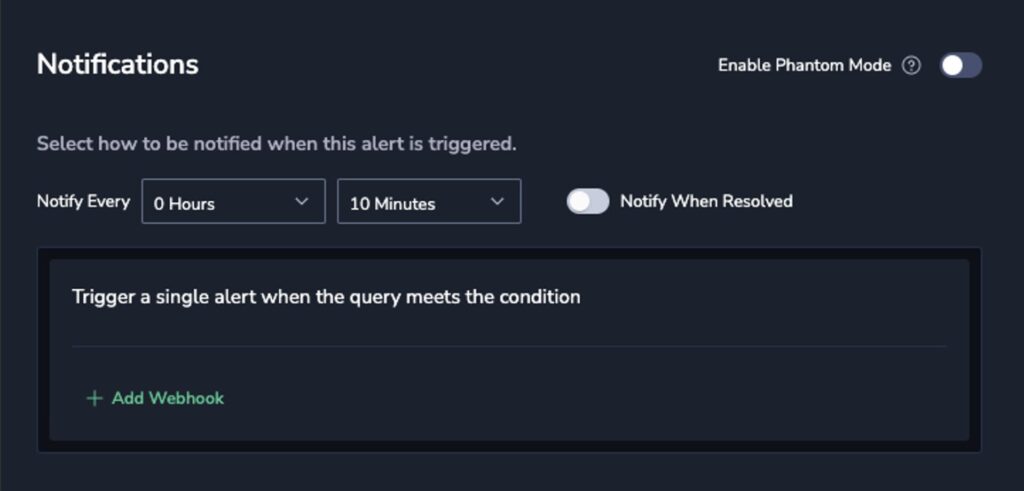
Notification grouping
How incidents appear depends on the notification setting in your alert:
- Separate notifications: each key-value combination that meets your Group By conditions appears as a separate incident
- Single notification: all events for the alert are consolidated into one incident
Prerequisites
- S3 archive bucket configured for querying alert logs in Explore
View incidents
Navigate to Alerts, then Incidents to view all triggered alerts.
Incidents tab
The Incidents tab shows all alerts triggered within the selected timeframe, regardless of status or duration. Events are sorted by last updated timestamp.
Select a time range using:
- Quick: preset time ranges
- Relative: timeframe relative to now
- Custom: specific start and end time
- Tag: compare timelines using Version Benchmarks
Group by alert definition
Select Group by alert definition in the upper-right corner to aggregate all permutations under one alert name. Expand an alert group to view individual permutations with status, type, and details. Each group can contain up to 1,000 permutations.
Filter incidents
Use the sidebar filters to narrow results by status, type, priority, labels (with AND/OR operators), or assignment.
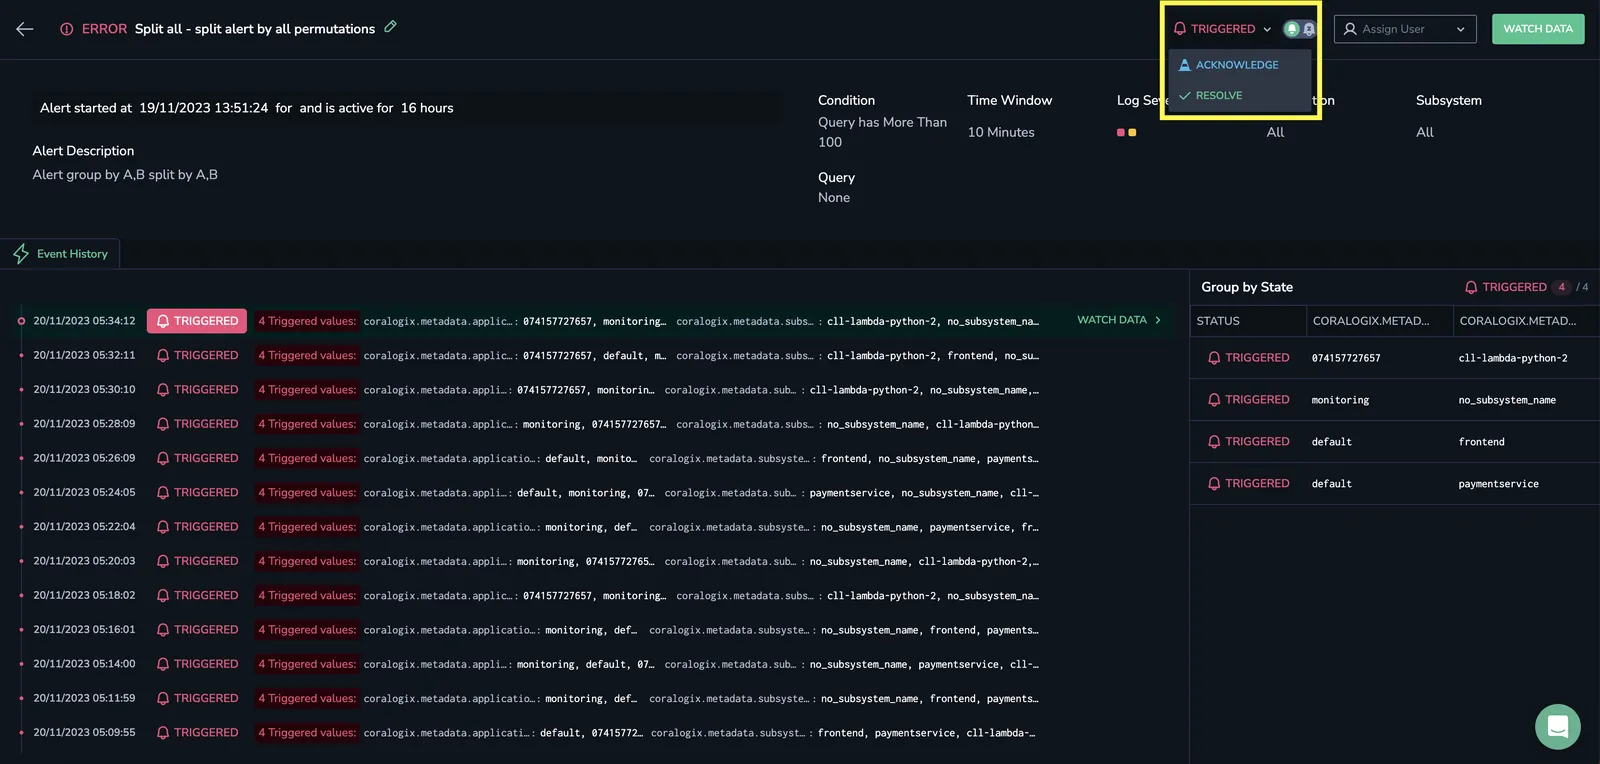
Incident status
Incidents have one of three statuses:
| Status | Description |
|---|---|
| Triggered | The alert condition is active |
| Acknowledged | A team member has accepted the incident |
| Resolved | The issue has been addressed |
Automatic status changes
When a triggered alert resolves, the incident status automatically changes to resolved. If Notify When Resolved is enabled in the alert settings, a resolve notification is sent. Once resolved, the incident closes. If the alert triggers again, a new incident appears.
Manual status changes
Select a triggered status to change it to acknowledged or resolved. Changing the status automatically assigns you to the incident. Modify status from the Incidents screen or the incident details screen.
Incident details
Select the more actions menu on any incident to open the incident details screen:
- Alert name and status
- Event history and timestamps
- Severity, time window, application, and subsystem
- Alert query
- Assignee
Select the edit icon to open and modify the alert definition.
Group by state
For single-notification alerts, the Group By State grid displays all permutations for the key-value tags in the Group By conditions.
Watch data
Select Watch Data to view the logs, metrics, or traces that triggered an event:
- Watch Data in the upper-right corner shows raw data for the last event
- Watch Data next to a specific event shows raw data for that event
Alert Explorer
Alert Explorer displays all triggered alerts in chronological order without grouping them into incidents. Filter alerts using the same methods as the Incidents screen, except for the assignment filter.
Additional resources
| Documentation | Connect S3 Archive Introduction to alerts |
Next steps
Automate periodic alert reports with Coralogix reporter.