Claude Code integration with Coralogix
Claude Code ships with built-in OpenTelemetry support, which means you can send its full telemetry — token usage, model costs, tool calls, code changes, and session activity — directly to Coralogix with no custom code required. Once connected, every Claude Code session in your organization streams live data to a dedicated dashboard, giving you cost visibility, usage patterns, and code impact in one place.
See the Claude Cowork integration for the admin-panel setup for Claude Cowork.
Supported environments
- OS: macOS, Linux, and Windows (native or WSL).
- Shell:
bashorzsh. The shell-based per-developer setup runs on macOS, Linux, and Windows Subsystem for Linux (WSL).
What you need
- A Coralogix account with a Send-Your-Data API key. In Coralogix, navigate to Settings, then API Keys.
- Your Coralogix OTLP endpoint:
ingress.eu2.coralogix.com:443. Use the domain selector at the top of this page to select your region. - Claude Code installed and running on your machine.
Set up
Deploy org-wide with managed settings
For Claude for Teams or Enterprise (Claude Code 2.1.38 or newer), use server-managed settings to push the Coralogix configuration to every developer automatically. No shell scripts, no .env distribution, no per-developer action required.
-
In Claude.ai, navigate to Admin Settings, then Claude Code, then Managed Settings and select Manage.
-
Paste the settings JSON:
{"env": {"CLAUDE_CODE_ENABLE_TELEMETRY": "1","OTEL_METRICS_EXPORTER": "otlp","OTEL_LOGS_EXPORTER": "otlp","OTEL_EXPORTER_OTLP_PROTOCOL": "http/protobuf","OTEL_EXPORTER_OTLP_ENDPOINT": "<YOUR_CX_OTLP_ENDPOINT>","OTEL_EXPORTER_OTLP_HEADERS": "Authorization=Bearer <YOUR_CX_API_KEY>","OTEL_RESOURCE_ATTRIBUTES": "cx.application.name=claude-code,cx.subsystem.name=<TEAM_NAME>","OTEL_EXPORTER_OTLP_METRICS_TEMPORALITY_PREFERENCE": "delta"}}Replace the placeholders with your Coralogix values.
-
Select Add settings.
The admin console shows the configured settings JSON:
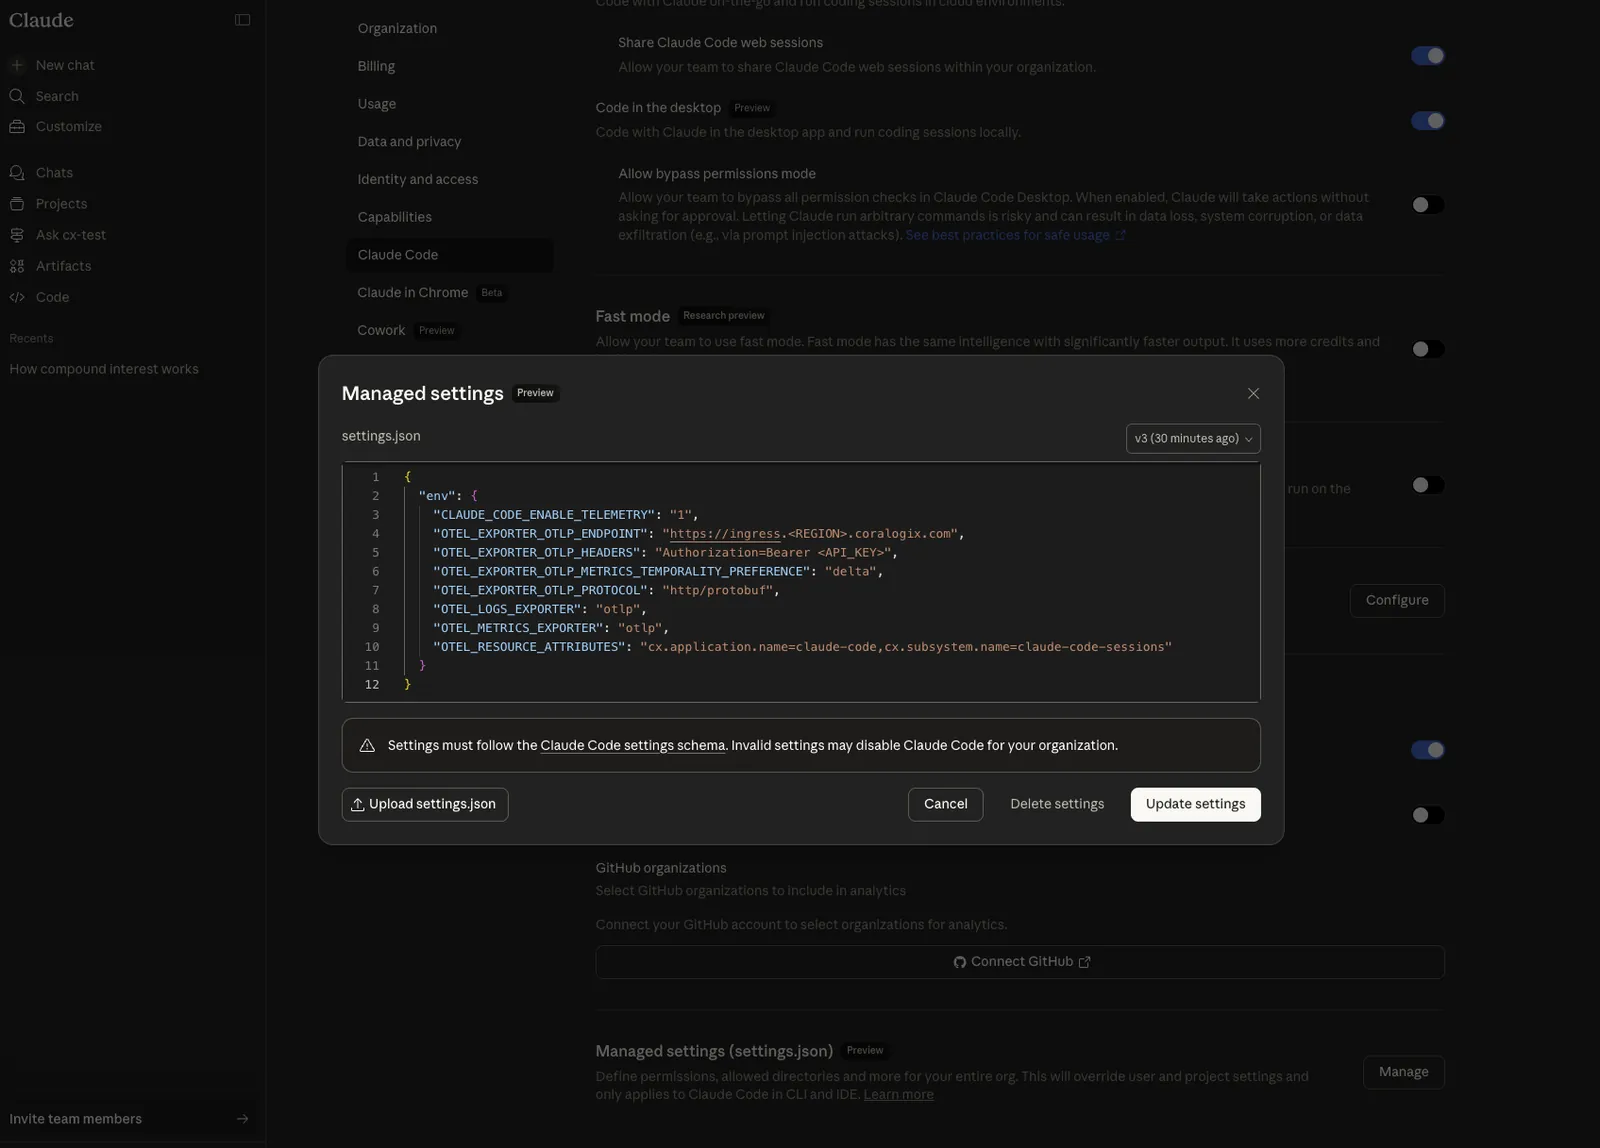
Settings reach all Claude Code clients at their next startup or within the hourly polling cycle.
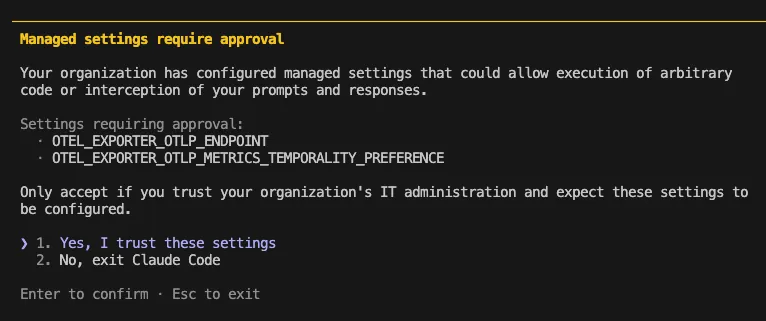
On their next claude startup, developers see a one-time approval dialog listing the configured environment variables. They select Yes, I trust these settings and Claude Code restarts with telemetry active.
Deploy org-wide without a Claude account
If your organization runs Claude Code against a third-party endpoint — for example, Amazon Bedrock or LiteLLM — rather than a managed Claude account, server-managed settings don't apply, so you can't push the Coralogix configuration from the Claude.ai admin console. Distribute it instead through a dedicated managed settings file deployed with your device-management (MDM) tooling.
-
Create a
managed-settings.jsonfile. -
Add the same telemetry
envblock shown in Deploy org-wide with managed settings, replacing the placeholders with your Coralogix values. -
Distribute the file to every developer with your MDM tooling, following Claude Code's managed settings guide. The settings reach all Claude Code clients at their next startup.
For the file locations on each platform and how this channel behaves when a proxy is active, see Telemetry stops when Claude Code routes through a proxy or gateway.
Per-developer setup
Use this if your organization is not on Claude for Teams or Enterprise, or if you prefer not to use server-managed settings.
Install
Clone the Coralogix AI agent instrumentation repository and navigate to the Claude Code directory:
git clone https://github.com/coralogix/ai-agent-instrumentation.git
cd ai-agent-instrumentation/claude-code
Configure
-
Copy the example environment file:
cp .env.example .env -
Open
.envand set the following values:CX_API_KEY— your Send-Your-Data API keyCX_OTLP_ENDPOINT— your OTLP endpoint (ingress.eu2.coralogix.com:443)
-
Activate the instrumentation and start Claude Code:
source activate.shclaudeClaude Code sessions now stream telemetry to Coralogix.
Make it permanent
To activate instrumentation automatically in every new terminal session, add the following line to ~/.zshrc:
source /path/to/claude-code/activate.sh
Advanced: set environment variables directly
If you prefer to set the environment variables without the activation script, add the following to ~/.zshrc or ~/.bashrc:
if [ -f "$HOME/path/to/claude-code-coralogix/.env" ]; then
set -a; source "$HOME/path/to/claude-code-coralogix/.env"; set +a
fi
export CLAUDE_CODE_ENABLE_TELEMETRY=1
export OTEL_METRICS_EXPORTER=otlp
export OTEL_LOGS_EXPORTER=otlp
export OTEL_EXPORTER_OTLP_PROTOCOL=http/protobuf
export OTEL_EXPORTER_OTLP_ENDPOINT="${CX_OTLP_ENDPOINT}"
export OTEL_EXPORTER_OTLP_HEADERS="Authorization=Bearer ${CX_API_KEY}"
export OTEL_RESOURCE_ATTRIBUTES="cx.application.name=claude-code,cx.subsystem.name=${CX_SUBSYSTEM_NAME}"
export OTEL_EXPORTER_OTLP_METRICS_TEMPORALITY_PREFERENCE=delta
Alternatively, set these values in Claude Code's settings file at ~/.claude/settings.json:
{
  "env": {
    "CLAUDE_CODE_ENABLE_TELEMETRY": "1",
    "OTEL_METRICS_EXPORTER": "otlp",
    "OTEL_LOGS_EXPORTER": "otlp",
    "OTEL_EXPORTER_OTLP_PROTOCOL": "http/protobuf",
    "OTEL_EXPORTER_OTLP_ENDPOINT": "<YOUR_CX_OTLP_ENDPOINT>",
    "OTEL_EXPORTER_OTLP_HEADERS": "Authorization=Bearer <YOUR_CX_API_KEY>",
    "OTEL_RESOURCE_ATTRIBUTES": "cx.application.name=claude-code,cx.subsystem.name=<TEAM_NAME>",
    "OTEL_EXPORTER_OTLP_METRICS_TEMPORALITY_PREFERENCE": "delta"
  }
}
Application name and subsystem
Coralogix organizes incoming telemetry by two resource attributes: Application name and Subsystem. For Claude Code, we recommend:
| Attribute | Recommended value | Why |
|---|---|---|
cx.application.name | claude-code | Lets you filter dashboards and queries by Claude surface (e.g., distinguish Claude Code from Claude Cowork). |
cx.subsystem.name | The team name — for example, team1, enterprise, data-eng | Lets you filter by team and compare usage across teams. |
Example (managed settings):
"OTEL_RESOURCE_ATTRIBUTES": "cx.application.name=claude-code,cx.subsystem.name=platform"
With this convention in place, the shared Claude dashboard can be filtered by agent (which Claude surface) and by team (who's using it) from a single dropdown.
Repository breakdown
Claude Code's native telemetry reports cost and tokens per session, but not which Git repository the work touched. The Coralogix repository-tracking hook adds that dimension: it runs after every tool call, resolves the Git repository for the files Claude Code touched, and reports it to Coralogix. AI Center then attributes session cost and tokens to repositories and separates Managed repositories (those owned by an Organization you configure in Settings → AI Center → Code agent) from Unmanaged ones — see Repositories.
How it works
The hook is a Claude Code PostToolUse hook: a small Python script (claude.py, standard library only) that Claude Code runs after each tool call. After every call, it identifies which Git repository the files Claude Code touched belong to and reports that repository to Coralogix, so AI Center can attribute the session to it. Repositories are identified by name — for example, your-org/your-service; work that doesn't belong to any repository is reported as unknown.
A single session can touch several repositories. AI Center splits the session's cost evenly across them.
What you need
The repository-tracking hook runs on macOS and Linux.
- The repository-tracking hook script (
claude.py) from the Coralogix AI agent instrumentation repository. - A Coralogix Send-Your-Data API key — the same key you use for OTLP.
- Python 3, resolvable as the
python3command. The hook uses the Python standard library only — no third-party dependencies. gitinstalled and onPATH. The hook callsgitto resolve repository names.
git before rolloutThe hook command invokes python3, and the script shells out to git rev-parse. If either is missing or not on PATH for the account that runs Claude Code, the hook can't resolve a repository and that machine reports repository_name="unknown". Verify both are resolvable on every target machine.
The hook reads its credentials from CX_HOOK_* variables because Claude Code strips OTEL_* variables from hook subprocesses. It falls back to OTEL_EXPORTER_OTLP_ENDPOINT and OTEL_EXPORTER_OTLP_HEADERS when the CX_HOOK_* variables are absent, but setting CX_HOOK_API_KEY explicitly is the reliable path.
Per-operating-system values
Place claude.py at a stable path and invoke it with python3:
| Operating system | Python launcher | claude.py path (example) | Example hook command |
|---|---|---|---|
| macOS / Linux | python3 | /usr/local/bin/claude.py | python3 /usr/local/bin/claude.py |
Make claude.py readable by the account that runs Claude Code, and make it executable.
Deploy org-wide with device management
To roll the hook out to every developer, deploy claude.py with your device-management tooling — Jamf for macOS or similar — to /usr/local/bin/claude.py, then distribute the env and hooks blocks through managed settings. Developers approve the settings once, exactly as with the base telemetry configuration.
The full managed-settings block — base telemetry plus the repository-tracking hook credentials — looks like this:
{
  "env": {
    "CLAUDE_CODE_ENABLE_TELEMETRY": "1",
    "OTEL_METRICS_EXPORTER": "otlp",
    "OTEL_LOGS_EXPORTER": "otlp",
    "OTEL_EXPORTER_OTLP_PROTOCOL": "http/protobuf",
    "OTEL_EXPORTER_OTLP_ENDPOINT": "<YOUR_CX_OTLP_ENDPOINT>",
    "OTEL_EXPORTER_OTLP_HEADERS": "Authorization=Bearer <YOUR_CX_API_KEY>",
    "OTEL_EXPORTER_OTLP_METRICS_TEMPORALITY_PREFERENCE": "delta",
    "OTEL_RESOURCE_ATTRIBUTES": "cx.application.name=claude-code,cx.subsystem.name=<TEAM_NAME>",
    "CX_HOOK_API_KEY": "<YOUR_CX_API_KEY>",
    "CX_HOOK_APPLICATION_NAME": "claude-code",
    "CX_HOOK_SUBSYSTEM_NAME": "<TEAM_NAME>"
  },
  "hooks": {
    "PostToolUse": [
      {
        "hooks": [
          { "type": "command", "command": "python3 /usr/local/bin/claude.py" }
        ]
      }
    ]
  }
}
For macOS, the Coralogix AI agent instrumentation repository provides a ready-to-use Jamf deployment script that installs claude.py to /usr/local/bin, makes it executable, and sets root ownership.
Install for one developer
-
Copy
claude.pyto a stable location —/usr/local/bin/claude.pyon macOS and Linux. -
Register it as a PostToolUse hook and set its credentials in
~/.claude/settings.json. The full file looks like this:{"env": {"CLAUDE_CODE_ENABLE_TELEMETRY": "1","OTEL_METRICS_EXPORTER": "otlp","OTEL_LOGS_EXPORTER": "otlp","OTEL_EXPORTER_OTLP_PROTOCOL": "http/protobuf","OTEL_EXPORTER_OTLP_ENDPOINT": "<YOUR_CX_OTLP_ENDPOINT>","OTEL_EXPORTER_OTLP_HEADERS": "Authorization=Bearer <YOUR_CX_API_KEY>","OTEL_EXPORTER_OTLP_METRICS_TEMPORALITY_PREFERENCE": "delta","OTEL_RESOURCE_ATTRIBUTES": "cx.application.name=claude-code,cx.subsystem.name=<TEAM_NAME>","CX_HOOK_API_KEY": "<YOUR_CX_API_KEY>","CX_HOOK_APPLICATION_NAME": "claude-code","CX_HOOK_SUBSYSTEM_NAME": "<TEAM_NAME>"},"hooks": {"PostToolUse": [{"hooks": [{ "type": "command", "command": "python3 /usr/local/bin/claude.py" }]}]}}On top of the base telemetry configuration, the repository-tracking hook adds:
Key Purpose CX_HOOK_API_KEYThe Send-Your-Data API key the hook uses, set explicitly because Claude Code strips OTEL_*variables from hook subprocessesCX_HOOK_APPLICATION_NAMEApplication name the hook reports under — match your telemetry configuration CX_HOOK_SUBSYSTEM_NAMESubsystem (team) the hook reports under — match your telemetry configuration hooks.PostToolUseRegisters claude.pyto run after every tool call -
Start a new Claude Code session. The hook reports a repository the first time Claude Code touches a file.
Classify repositories as Managed or Unmanaged
Repository names alone don't tell AI Center which repositories belong to your company. In Settings → AI Center → Code agent, configure the Organizations that own your repositories — sessions on a matched repository are labeled Managed, and everything else is Unmanaged. Until you configure an Organization, every repository appears as Unmanaged.
For the steps and the full classification rules, see Classify repositories as Managed or Unmanaged.
View in AI Center
Once your Claude Code sessions are streaming telemetry, navigate to AI Center > Code Agents > Claude to see the unified Claude dashboard. The Select an application dropdown lists every <application> - <subsystem> pair you configured (for example, claude-code - team1, claude-code - team2), so you can slice usage, cost, sessions, and token data by team. If you also instrument Claude Cowork, Cowork data appears in the same dashboard.
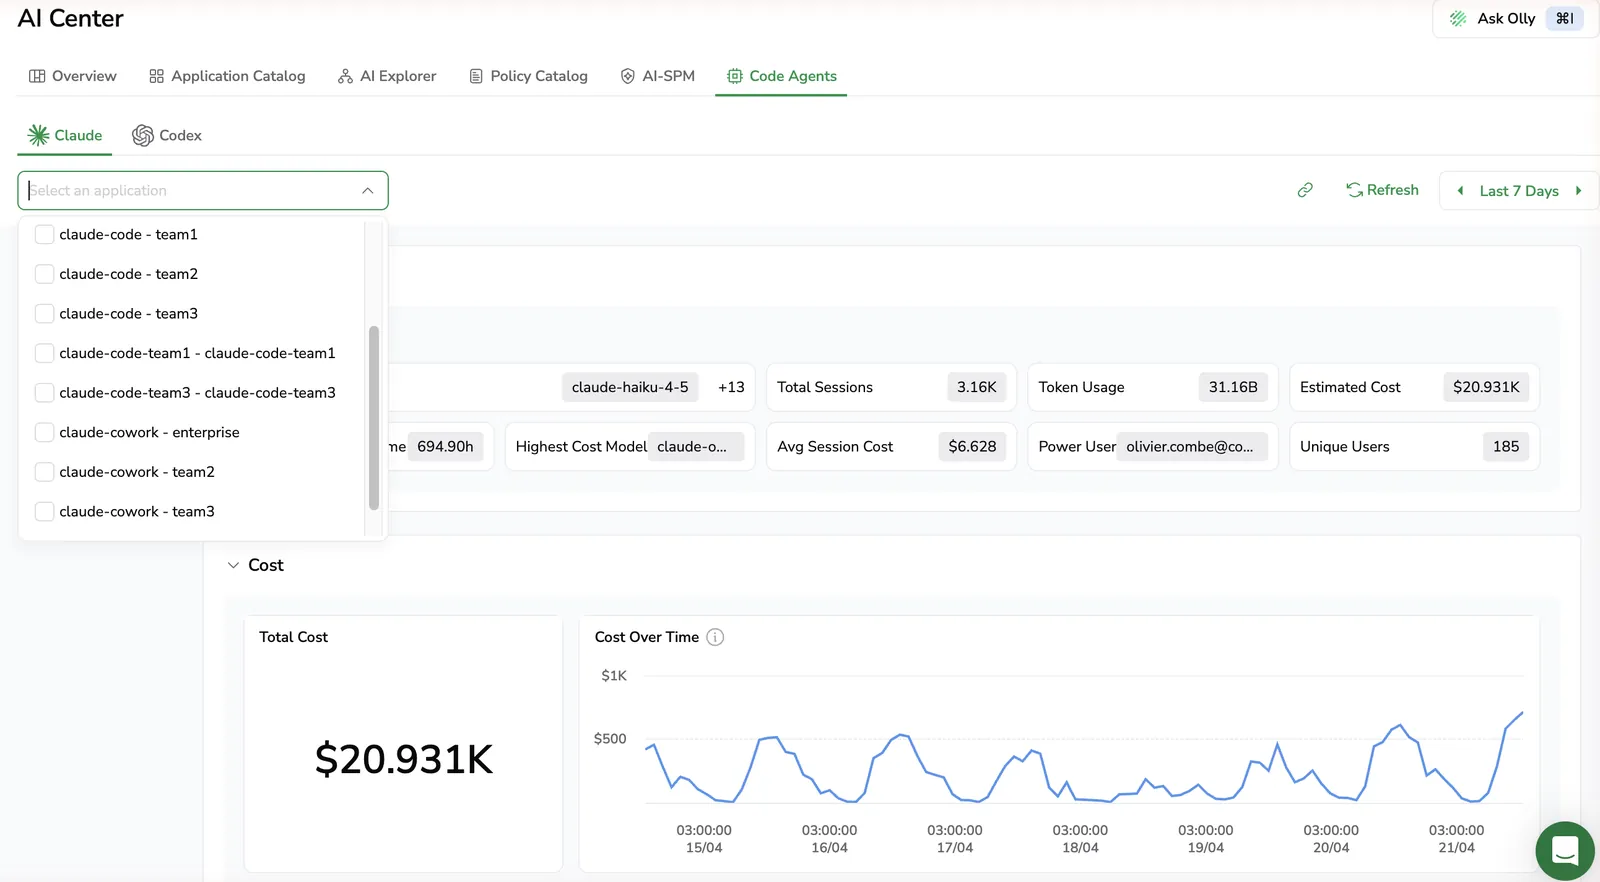
The dashboard cost is derived from the usage metrics Claude Code sends to Coralogix, displayed as-is — it does not factor in your Anthropic subscription plan, so it is accurate for usage-billed Enterprise plans and an estimate for others.
To tell plans apart, set cx.subsystem.name to the plan or team name (see Application name and subsystem) and filter on it. For the full accuracy caveats, see Dashboard costs don't match the Anthropic invoice.
Validate the integration
After running a Claude Code session, confirm that data is flowing:
- In Coralogix, navigate to Metrics Explorer and search for the metric prefix
claude_code. Token usage and cost data appear here. - Navigate to Logs and filter by your application and subsystem names to see tool call and session events.
- Open Code Agents Intelligence to see the full session dashboard.
Monitor data in Coralogix
Import the dashboard
- In Coralogix, navigate to Dashboards, then select New Dashboard, then Import from JSON.
- Upload
coralogix-dashboard.jsonfrom the cloned repository.
Data available
| Signal | Where in Coralogix |
|---|---|
| Token usage and costs | Metrics Explorer (claude_code prefix) |
| Tool calls | Logs |
| Code changes and commits | Dashboard |
Code Agents Intelligence
Use the Code Agents Intelligence dashboard to track costs, usage, code impact, and user activity across all sessions in your organization — filterable by Application name and Subsystem.
Data scopes
The Claude Code dashboard runs on metrics. Support for data scopes on Claude Code metrics is forthcoming. See Code agents observability — Data scopes for the per-agent breakdown.
Configuration examples
Reduce the metric export interval during testing
Lower the export interval to see data faster while validating your setup:
export OTEL_METRIC_EXPORT_INTERVAL=10000
Activate tool detail logging
Set OTEL_LOG_TOOL_DETAILS=1 to add Model Context Protocol (MCP) server and tool names to claude_code.tool_result log events, and to populate tool_parameters for MCP and Skill tool calls (Bash tool parameters ship by default). Tool detail logging is off by default.
Add custom resource dimensions
Attach extra labels (for example, environment) to every signal:
export OTEL_RESOURCE_ATTRIBUTES="cx.application.name=claude-code,cx.subsystem.name=platform,env=prod"
Telemetry reference
The AI Center Code Agents dashboard surfaces the most common cost, usage, and activity signals out of the box. To explore every metric, log event, and attribute that Claude Code emits — and use those signals as the basis for your own Custom Dashboards or alerts — see the Claude Code monitoring usage reference.
Data reference
Metrics
All metrics use delta temporality and appear in Metrics Explorer under the claude_code prefix.
| Metric | Labels | What it tracks |
|---|---|---|
claude_code_session_count_total | session_id, user_account_uuid | Sessions started |
claude_code_token_usage_tokens_total | model, type | Tokens by model and type (input, output, cacheRead, cacheCreation) |
claude_code_cost_usage_USD_total | model | Estimated USD cost per model |
claude_code_lines_of_code_count_total | type | Lines added and removed |
claude_code_commit_count_total | — | Git commits made |
claude_code_pull_request_count_total | — | Pull requests created |
claude_code_code_edit_tool_decision_total | decision, source, tool_name, language | Accept and reject decisions on code edits |
claude_code_active_time_total_s_total | type | Seconds Claude Code was actively processing (cli = AI/tool work, user = keyboard interaction) |
Log events
Query log events using DataPrime or Lucene, filtered by your application and subsystem names.
| Event type | Key attributes |
|---|---|
claude_code.api_request | model, token counts, cost, latency |
claude_code.api_error | status, error message |
claude_code.tool_result | tool name, duration, outcome |
claude_code.tool_decision | tool name, decision, source |
Every signal carries session.id, user.account_uuid, user.email, organization.id, app.version, and terminal.type.
Advanced configuration
| Variable | Default | Purpose |
|---|---|---|
OTEL_METRIC_EXPORT_INTERVAL | 60000 ms | How often the exporter flushes metrics |
OTEL_LOGS_EXPORT_INTERVAL | 5000 ms | Log flush interval |
OTEL_LOG_TOOL_DETAILS | off | Set to 1 to add Model Context Protocol (MCP) server and tool names to tool events, plus tool_parameters for MCP and Skill tool calls |
OTEL_METRICS_INCLUDE_SESSION_ID | true | Attaches session.id to metric labels — turn off to reduce cardinality |
OTEL_METRICS_INCLUDE_ACCOUNT_UUID | true | Attaches user.account_uuid to metric labels |
Troubleshoot
Metrics do not appear but logs do
Cause: OTEL_METRICS_EXPORTER is missing or the export interval is too long.
Fix: confirm you exported OTEL_METRICS_EXPORTER=otlp and lower OTEL_METRIC_EXPORT_INTERVAL to 10000 while testing.
Costs show as zero
Cause: cost metrics require delta temporality.
Fix: confirm you set OTEL_EXPORTER_OTLP_METRICS_TEMPORALITY_PREFERENCE=delta.
Telemetry stops when Claude Code routes through a proxy or gateway
If Claude Code routes through a proxy, router, gateway, or third-party model provider — for example, LiteLLM, Amazon Bedrock, or a cost-tracking proxy — Claude Code treats it as a third-party provider and silently stops applying server-managed settings, including the OpenTelemetry configuration that streams usage and cost data to Coralogix. Telemetry stops with no error.
Why telemetry stops
Claude Code fetches server-managed settings from Anthropic at startup, and those settings aren't applied when a third-party model provider is configured — a non-default ANTHROPIC_BASE_URL, or one of the provider flags CLAUDE_CODE_USE_BEDROCK, CLAUDE_CODE_USE_MANTLE, CLAUDE_CODE_USE_VERTEX, CLAUDE_CODE_USE_FOUNDRY, or CLAUDE_CODE_USE_ANTHROPIC_AWS. Any tool that sets one of these turns off dashboard-delivered telemetry for that developer.
The bypass is triggered by, among others:
- Claude Code routers and cost proxies — Headroom, claude-code-router, claude-code-proxy, y-router, and ccflare.
- AI gateways and LLM proxies — LiteLLM, Portkey, OpenRouter, Cloudflare AI Gateway, Kong AI Gateway, Apache APISIX, TrueFoundry, Requesty, Vercel AI Gateway, Braintrust, Martian, and Helicone in proxy mode (Helicone's async-logging mode does not trigger the bypass).
- Enterprise provider backends — Amazon Bedrock, Bedrock Mantle, Google Vertex AI, and Microsoft Foundry.
Fix
Deliver the OpenTelemetry environment variables through a channel that survives the bypass:
- A
managed-settings.jsonfile deployed with your MDM tooling — recommended for fleets. See Deploy org-wide without a Claude account for theenvblock, then deploy it to the platform path below. - A per-user
~/.claude/settings.jsonfile holding the sameenvblock — suitable for individual developers or small teams. It is not tamper-resistant and must be configured on each machine.
| Platform | managed-settings.json path |
|---|---|
| macOS | /Library/Application Support/ClaudeCode/managed-settings.json |
| Windows | C:\Program Files\ClaudeCode\managed-settings.json |
| Linux / WSL | /etc/claude-code/managed-settings.json |
On macOS, you can instead push a configuration profile with your MDM that targets the com.anthropic.claudecode managed-preferences domain with the same keys — harder for developers to tamper with than a file.
OpenTelemetry configuration is an advanced setting, so developers must fully restart Claude Code for the change to take effect — on Desktop, quit the menu-bar or tray icon as well.
Settings priority
Managed settings take precedence over command-line arguments and the local, project, and user settings files. Within the managed tier, Claude Code applies the first source that delivers a non-empty configuration and does not merge sources — a policy helper (policyHelper), if configured, then server-managed (dashboard) settings, then the managed-settings.json file. This makes the MDM file a clean complement to the dashboard: developers without a proxy get the dashboard settings, and developers with a proxy fall through to the MDM file. The dashboard configuration must also contain the telemetry env block, and the managed-settings.json file should stay scoped to that block.
For the underlying conditions and precedence rules, see Claude Code's server-managed settings and settings references.
Dashboard costs don't match the Anthropic invoice
Claude Code computes cost on the developer's machine: Anthropic returns token counts with each response, and the client multiplies them by a price list embedded in the client, then exports the cost and token-usage metrics to Coralogix (see Metrics).
Because the embedded price list reflects public list prices, dashboard cost is an estimate and can differ from your actual Anthropic invoice:
- Outdated clients compute with outdated prices until developers update Claude Code.
- Introductory or promotional pricing — a client without the updated price table reports a higher cost than billed for that model until it updates, for example during a model's launch-pricing period.
- US data-residency organizations — requests pinned to US infrastructure are billed at a higher rate than the global list price the client uses (see Claude's data residency pricing), so dashboard cost is understated by roughly 10%.
- Negotiated pricing — enterprise discounts and committed-use rates aren't known to the client.
Treat the dashboard cost as directional usage telemetry — useful for trends, per-team breakdowns, and anomaly detection. For billing-accurate spend, use the Anthropic Console or your invoice.
Debug the repository-tracking hook
When repository data doesn't reach Coralogix, the production hook (claude.py) gives you nothing to go on: it swallows every error by design so it never disrupts a Claude Code session. To find out why, use the diagnostic twin claude_debug.py from the claude-code/hooks/debug directory. It does the identical work — parse the event, resolve the repository, build the OpenTelemetry (OTLP) protobuf, and POST it to Coralogix — but logs every decision point and the full HTTP response (status code and body) to both stdout and a log file.
Run it standalone
This is the fastest path and needs no Claude Code session. With no input on stdin, the script fabricates a dummy event from the current directory, so it exercises the entire network path directly:
CX_HOOK_API_KEY=<your-send-your-data-key> \
CX_HOOK_OTLP_ENDPOINT=ingress.eu2.coralogix.com:443 \
python3 claude_debug.py
Run it as a real hook
Point Claude Code's PostToolUse hook at claude_debug.py — or deploy it fleet-wide with deploy-jamf-debug.sh, which installs it to /usr/local/bin/claude_debug.py. It then reads the real event from stdin.
Configure it
All configuration is through environment variables — no secrets live in the file.
| Variable | Purpose | Default |
|---|---|---|
CX_HOOK_API_KEY | Send-Your-Data API key (also falls back to a Bearer token in OTEL_EXPORTER_OTLP_HEADERS) | empty — aborts |
CX_HOOK_OTLP_ENDPOINT | Coralogix ingress host (falls back to OTEL_EXPORTER_OTLP_ENDPOINT) | https://ingress.us2.coralogix.com |
CX_HOOK_APPLICATION_NAME / CX_HOOK_SUBSYSTEM_NAME | Routing overrides | claude-code / claude-code-sessions |
CX_HOOK_DEBUG_LOG | Full path for the log file | <temp dir>/claude_hook_debug.log |
CX_HOOK_DEBUG_DISABLE_TLS=1 | Skip TLS certificate verification to test past a corporate TLS-intercepting proxy (Zscaler, Netskope) | off |
Claude Code strips OTEL_* variables from hook subprocess environments, so CX_HOOK_API_KEY is the reliable way to feed the key to the hook.
Read the log
The run is divided into labeled sections — read them top to bottom:
- DEBUG RUN — Python version, platform, current directory, and whether
gitis onPATH. - ENVIRONMENT VARIABLES — every relevant variable, plus the resolved key (masked: length and first/last 4 characters), endpoint, application, and subsystem, each annotated with where it came from. Proxy variables (
HTTP_PROXY,HTTPS_PROXY,NO_PROXY) are shown too. - INPUT EVENT — the raw
stdinevent, or the dummy event ifstdinwas empty. - PATH & REPO RESOLUTION — which paths were extracted and which repository names they resolved to.
- OTLP EMISSION — DNS resolution of the ingress host, payload size, and the full HTTP response or error.
Interpret the result
| Outcome | Meaning and next step |
|---|---|
SUCCESS — HTTP 200 | Ingress accepted the metric. If it still doesn't appear, the problem is downstream: API-key application/subsystem routing, TCO or metrics filtering, or the query itself. |
| HTTP 401 / 403 | Auth problem — wrong key, not a Send-Your-Data key, or missing metrics-ingestion permission. |
| HTTP 404 | Wrong endpoint or path — it must be the ingress host (for example, https://ingress.eu1.coralogix.com); the script appends /v1/metrics. |
| HTTP 400 | Malformed OTLP protobuf payload — see the error body. |
| URL error (SSL) | TLS failure — likely a corporate TLS-intercepting proxy or missing CA certificates. Fix trust through SSL_CERT_FILE or your corporate CA bundle, or test the egress path with CX_HOOK_DEBUG_DISABLE_TLS=1. |
| URL error (timeout) | A firewall or proxy is blocking egress to the ingress host on port 443. |
ABORT: API key is EMPTY / endpoint is EMPTY | The production hook would silently exit here — set the missing variable. |
The full log is written to CX_HOOK_DEBUG_LOG (or <temp dir>/claude_hook_debug.log). Because the key is masked, the whole log is safe to share with an engineer without leaking the credential.
CX_HOOK_DEBUG_DISABLE_TLS=1 is insecureDisabling TLS verification is for diagnosing a TLS-intercepting proxy only. Never use it in production.
Next steps
Once your integration is set up, explore Code agents to monitor token usage, costs, tool calls, code changes, and session data across all your coding agents.