Extensions
Coralogix offers a variety of out-of-the-box data extensions to complement the CloudWatch Metrics via Firehose integration package. Each tailored extension package unlocks a set of predefined items – such as alerts, parsing rules, dashboards, saved views, and actions – allowing you to jumpstart the monitoring of your Cloudwatch metrics.
Select one or more of the following:
- AWS Billing
- AWS EBS Observability
- AWS EC2 Observability
- AWS ElastiCache Observability
- AWS RDS Observability
AWS Billing
Stay on top of your cloud spending with our dedicated AWS Billing extension. Custom dashboards and alerts provide at-a-glance insights into your current costs, trends, and potential savings opportunities.
To enable the monitoring of estimated charges:
- In the AWS Billing console navigation pane, select Billing Preferences > Alert preferences.
- Click Edit and select Receive CloudWatch Billing Alerts.
- Click Save preferences.
AWS EBS Observability
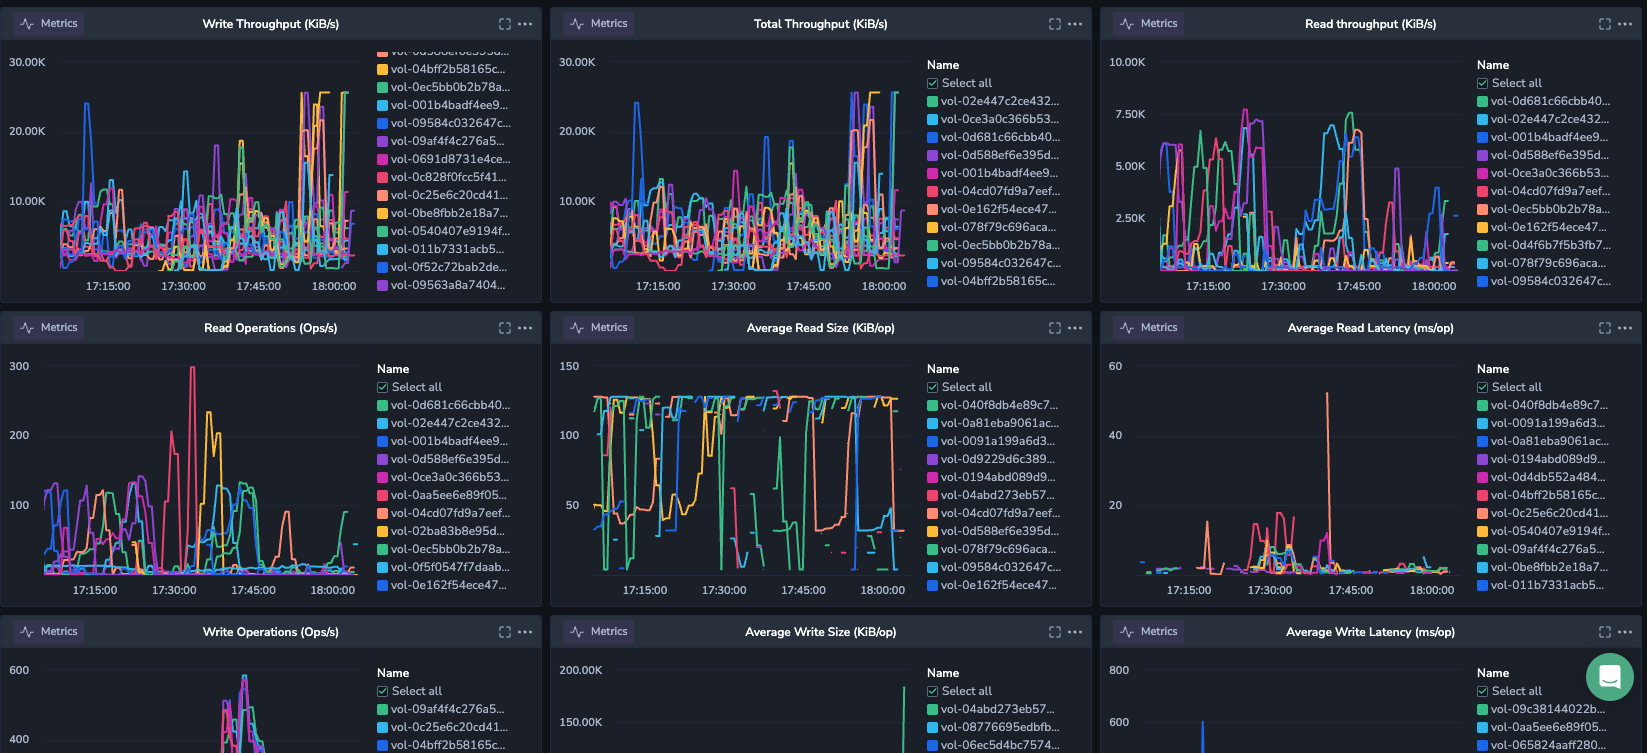
The AWS EBS Observability extension provides comprehensive monitoring of the health and performance of Amazon EBS volumes. Alerts and dashboards help to identify performance issues and optimize resource utilization, which directly impacts the performance and reliability of your applications.
Enjoy the following resources:
Custom Dashboards: Monitor the well-being and performance of your Amazon Elastic Block Store (EBS) volumes, capacity trends, and utilization patterns using our dedicated EBS dashboard.
Alerts: Proactively monitor critical metrics such as read/write latencies, throughput anomalies, and more to ensure peak performance and reliability.
AWS EC2 Observability
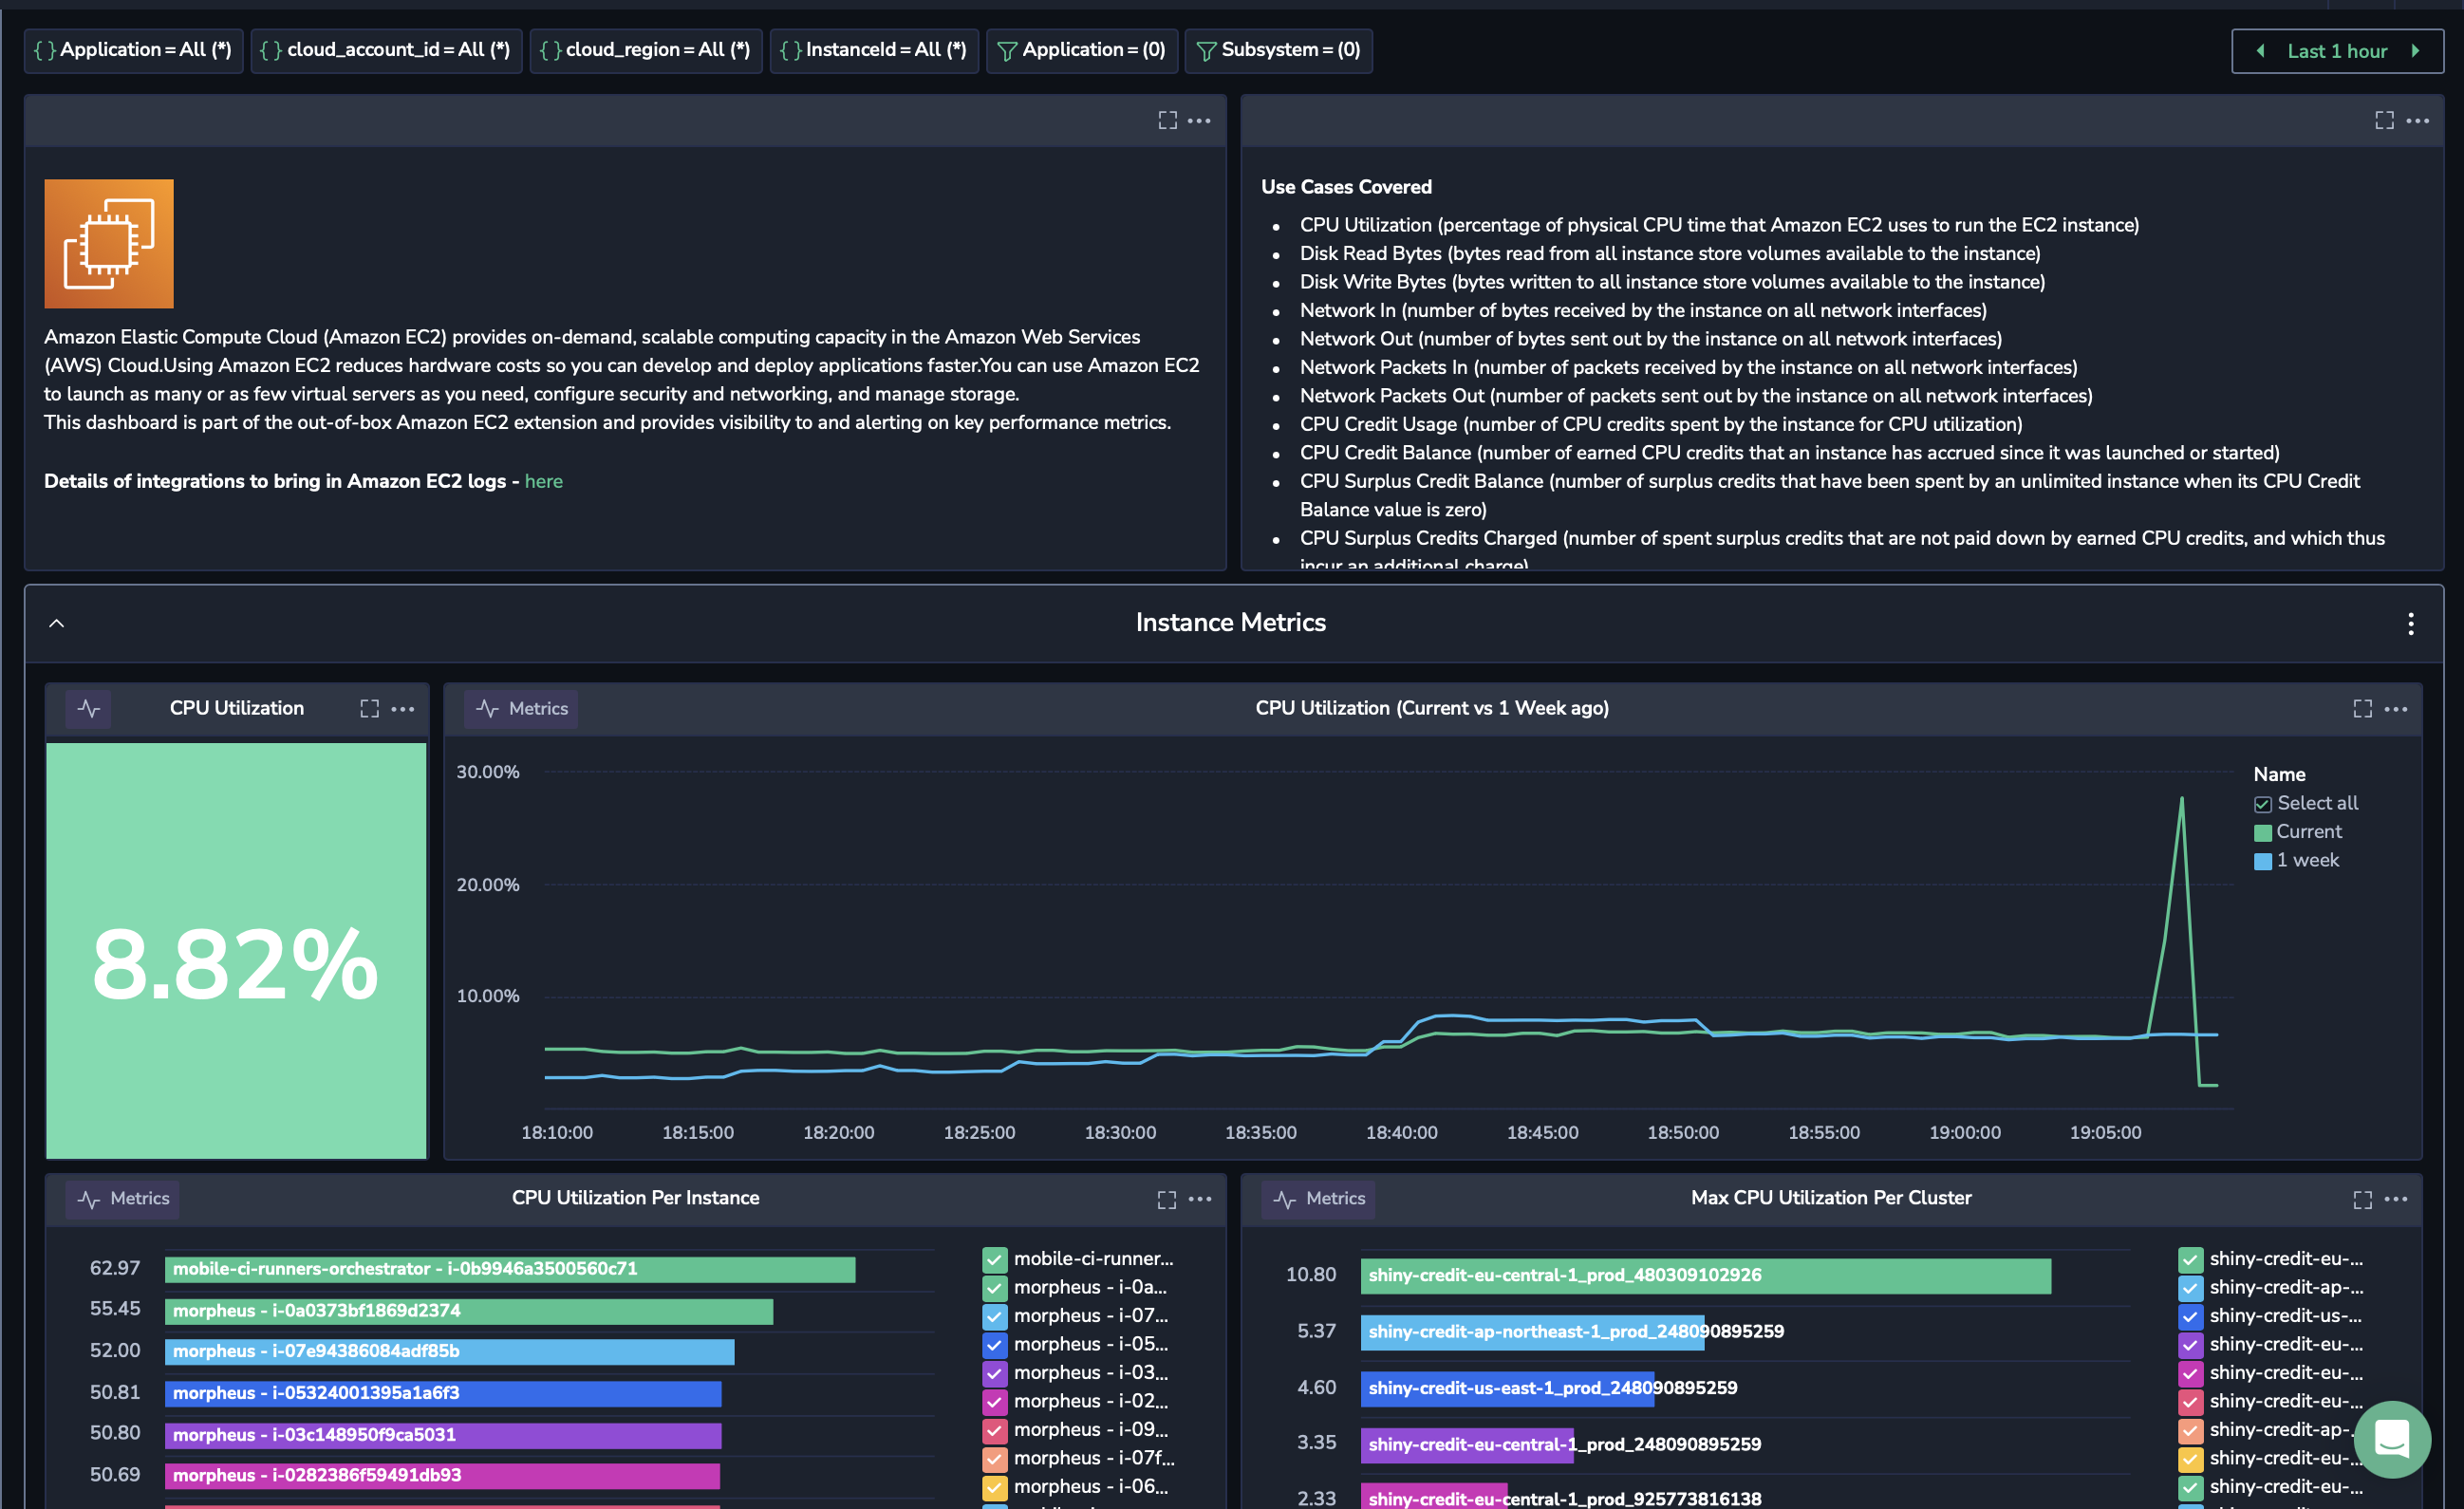
With its robust alerts and dashboards, the AWS EC2 Observability extension offers extensive monitoring of the health, performance, and usage of deployed Amazon EC2 instances. This helps in detecting performance bottlenecks, optimizing resource allocation, and ensuring that your EC2 instances run efficiently, all of which have a direct impact on the performance and cost-effectiveness of your applications and infrastructure.
Enjoy the following resources:
Custom Dashboards: View key metrics relating to the health and performance of deployed Amazon EC2 instances.
Alerts: Proactively monitor high CPU utliziation, failed system, instance, and EBS status checks, and high server and client errors.
AWS ElastiCache Observability
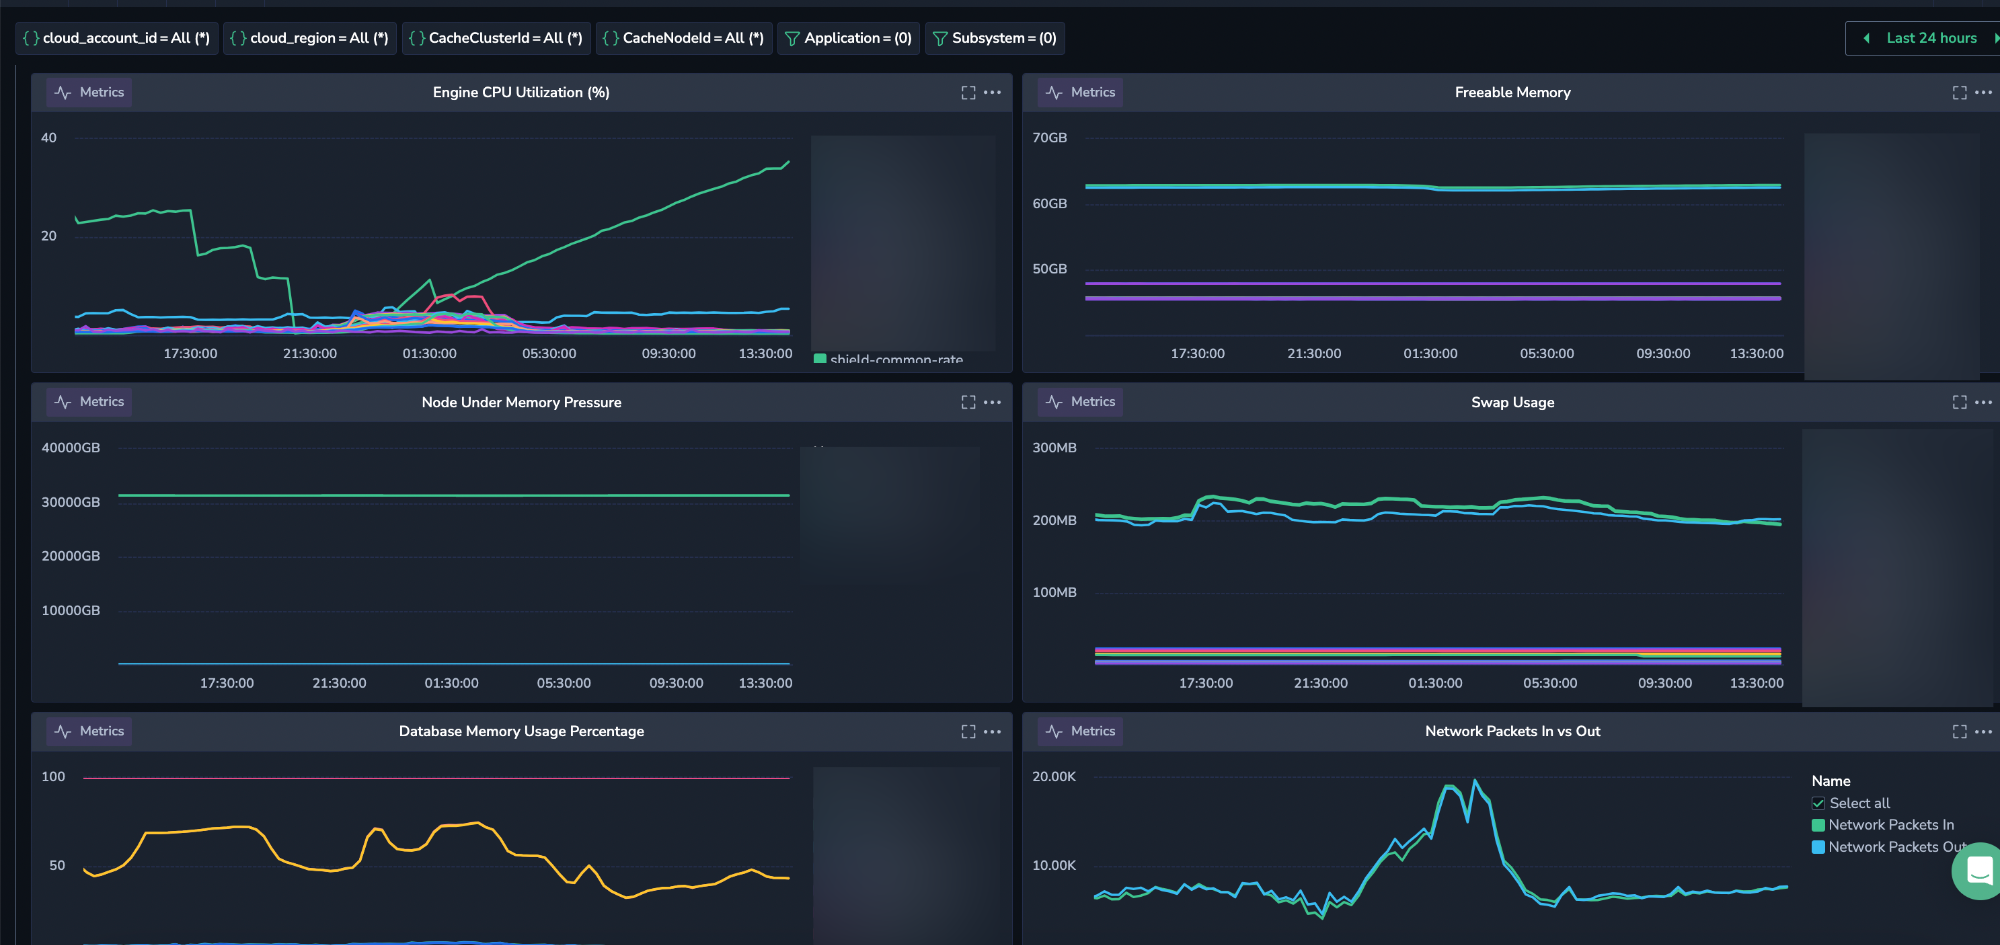
With 19 alerts and a detailed customized dashboard, the AWS ElastiCache Observability extension proactively monitor critical performance and health metrics of your ElastiCache clusters.
Enjoy the following resources:
Custom Dashboards: This detailed, user-friendly dashboard providing actionable insights into cache health, performance, and utlization. Its various widgets are designed to help you identify performance bottlenecks, optimize resource utilization, and ensure a seamless user experience for your applications.
Alerts: These alerts offer comprehensive monitoring of the health and performance of your deployed Amazon ElastiCache service. Monitor slow read and write operations, high levels of throttled commands, high CPU utilization and database memory usage, inbound and outbound network bandwith deviations, etc.
AWS RDS Observability
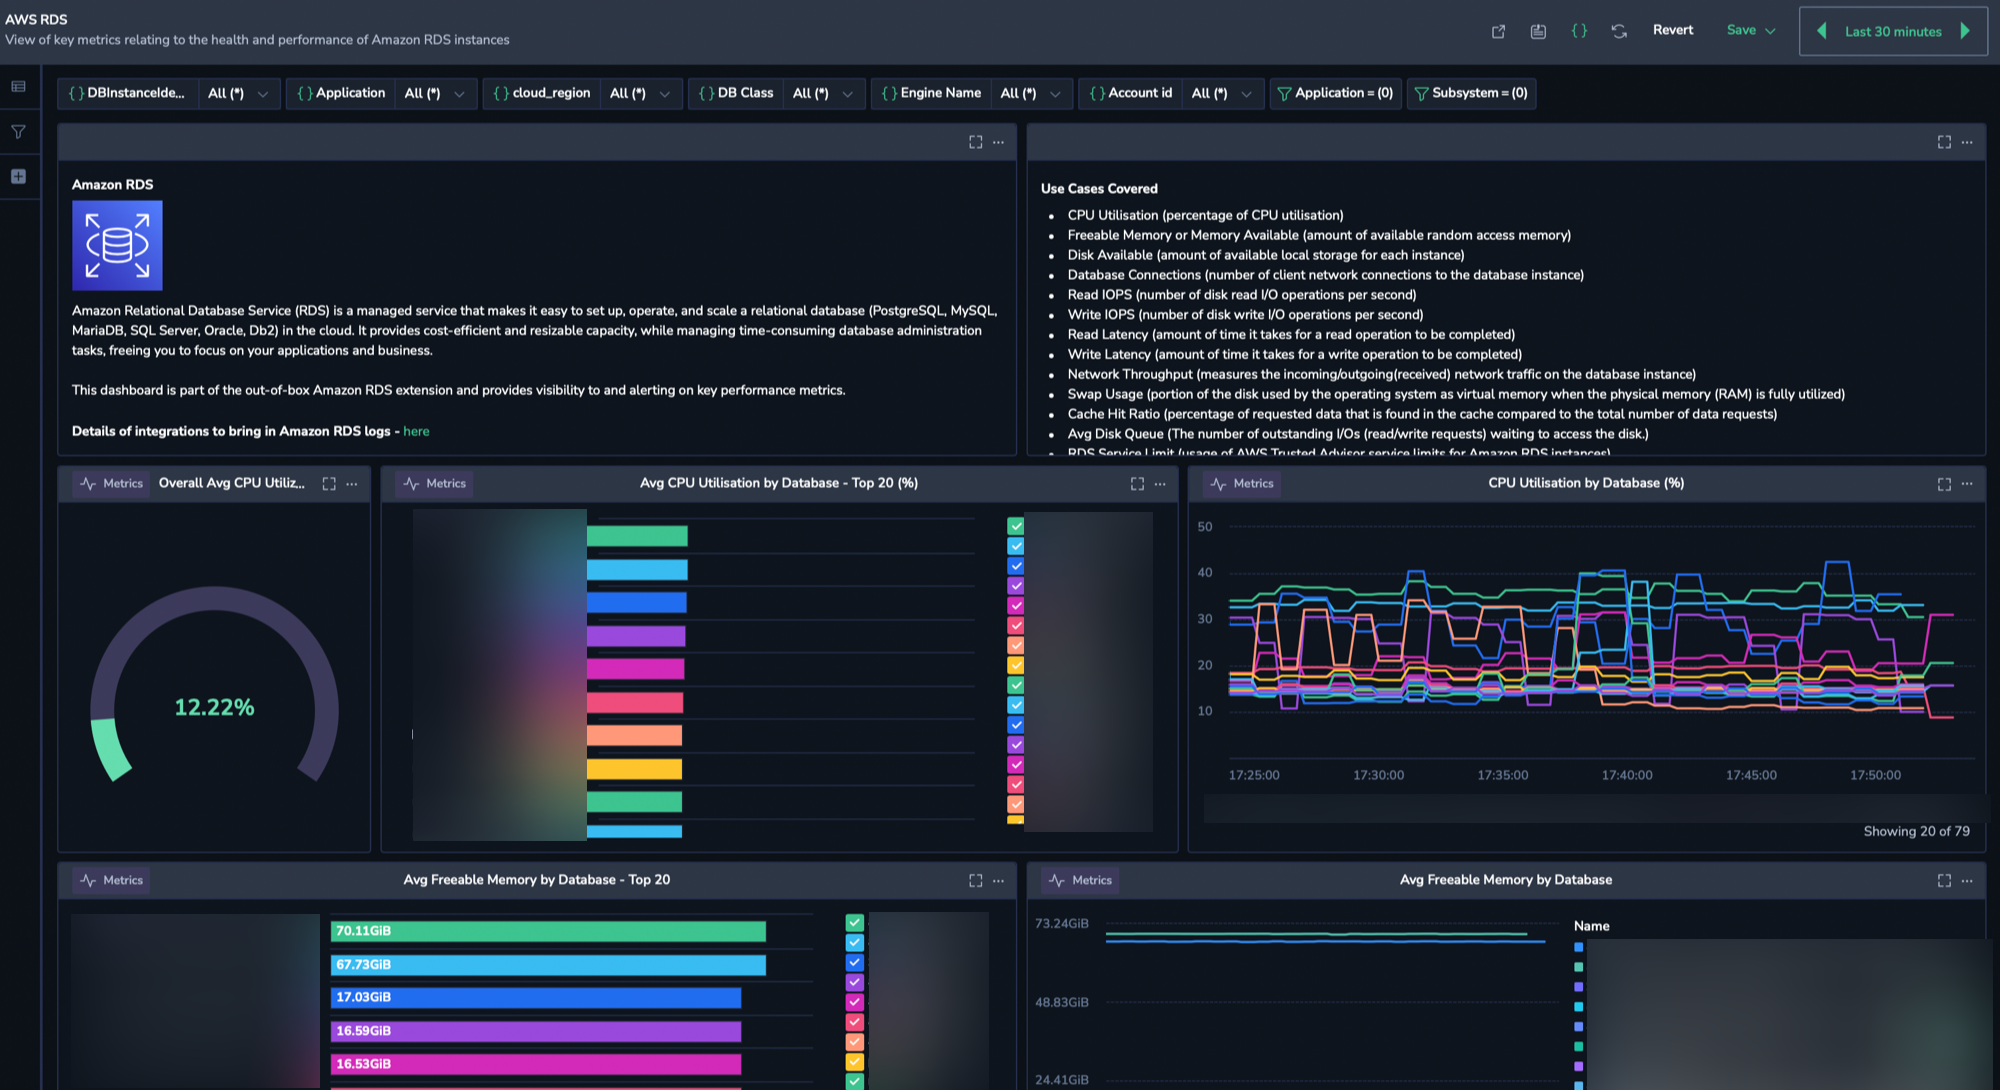
Easily monitor the health and performance of deployed Amazon RDS with the AWS RDS Observability extension. Identify performance issues and optimise resource utilisation which has a bearing on the user experience for your application.
Enjoy the following resources:
Custom Dashboards: View key metrics relating to the health and performance of deployed AWS RDS functions.
Alerts: Proactively monitor critical performance and health metrics such as CPU utilization, availability of critical memory, latency of your Amazon RDS instances.


