APM using AWS EC2
Send EC2 metrics to Coralogix through Amazon Data Firehose and stamp your logs and traces with the same EC2 identity, so a trace in Coralogix can show the CPU, disk, and network behavior of the exact instance that served it.
The correlation is what makes this worth doing: metrics alone tell you a host was busy, but a trace joined to that host tells you which request paid for it.
What you need
- A Coralogix account on the domain matching the region your data should be stored in. Sign up if you do not have one.
- A Coralogix Send-Your-Data API key.
- A metrics bucket configured under Data Flow, then Setup Archive.
- An active AWS account with the relevant permissions. See creating an AWS account.
Send EC2 metrics
Configure Amazon Data Firehose to stream your EC2 metrics to Coralogix.
Send logs and traces as well as metrics. APM quality depends on all three being present, without logs and traces there is nothing to correlate the host metrics against.
Tag telemetry with the EC2 host
The resource detection processor reads the instance's identity and tags from the EC2 metadata service and attaches them to every signal the Collector emits.
In your OpenTelemetry Collector configuration:
processors:
  resourcedetection/ec2:
    detectors: ["ec2", "env"]
    ec2:
      # Regular expressions matching the tag keys to add as resource attributes
      tags:
        - ^ec2.tag.name$
        - ^ec2.tag.subsystem$
        - ^aws.*$
Append resourcedetection/ec2 to the span processors:
traces:
  processors:
    - memory_limiter
    - batch
    - resourcedetection/ec2
Do the same for logs:
logs:
  processors:
    - resourcedetection/ec2
The processor emits the attributes the correlation relies on:
| Attribute | Use |
|---|---|
cloud.provider and cloud.platform | Confirm the process is running on AWS, on the EC2 platform |
host.id and host.name | Join logs and spans to the metrics of a specific instance |
View the correlated data
Select Explore, then Tracing, and select the trace you want to investigate.
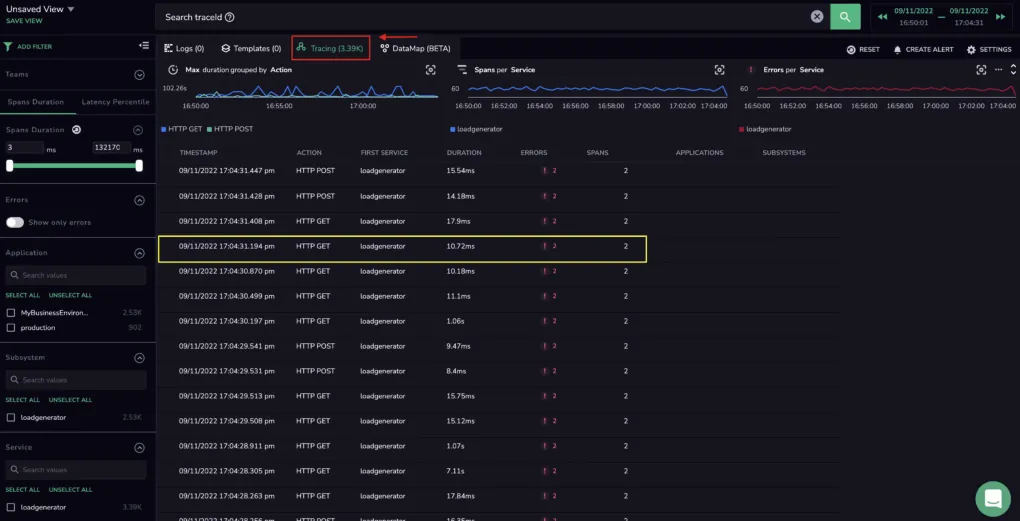
Shows the trace list you pick from, filtered by application, subsystem, and service.
In the span detail pane, select the HOST tab to see the EC2 metrics carrying the same host.id.
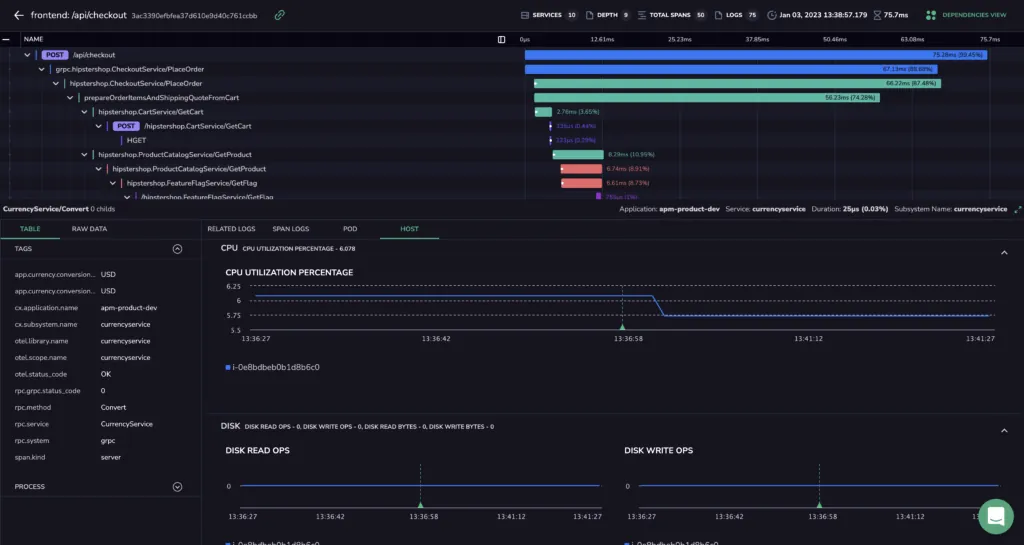
Shows a span alongside the host metrics of the EC2 instance that produced it.