Azure resource logs
Resource logs (previously called diagnostic logs) record what happened inside an Azure resource: a connection to a PostgreSQL server, a blob created or deleted in a storage account. That is the data plane, as distinct from the activity logs that record operations performed on resources. Their contents vary by Azure service and resource type.
Getting them into Coralogix takes two moves: a diagnostic setting that streams the logs to an Event Hub, and the Event Hub integration that forwards from there.
What you need
- An Azure account with an active subscription.
- An Event Hub namespace. If yours restricts public access, enable VNet support first. See the optional configuration steps.
Not every resource type produces audit logs. The example below uses a PostgreSQL database.
Export the logs to an Event Hub
Navigate to the resource, then select Diagnostic settings under Monitoring.
Select Add diagnostic setting and give it a name.
Select the audit category group, then under Destination details select Stream to an event hub and choose your subscription, namespace, event hub, and policy. Select Save.
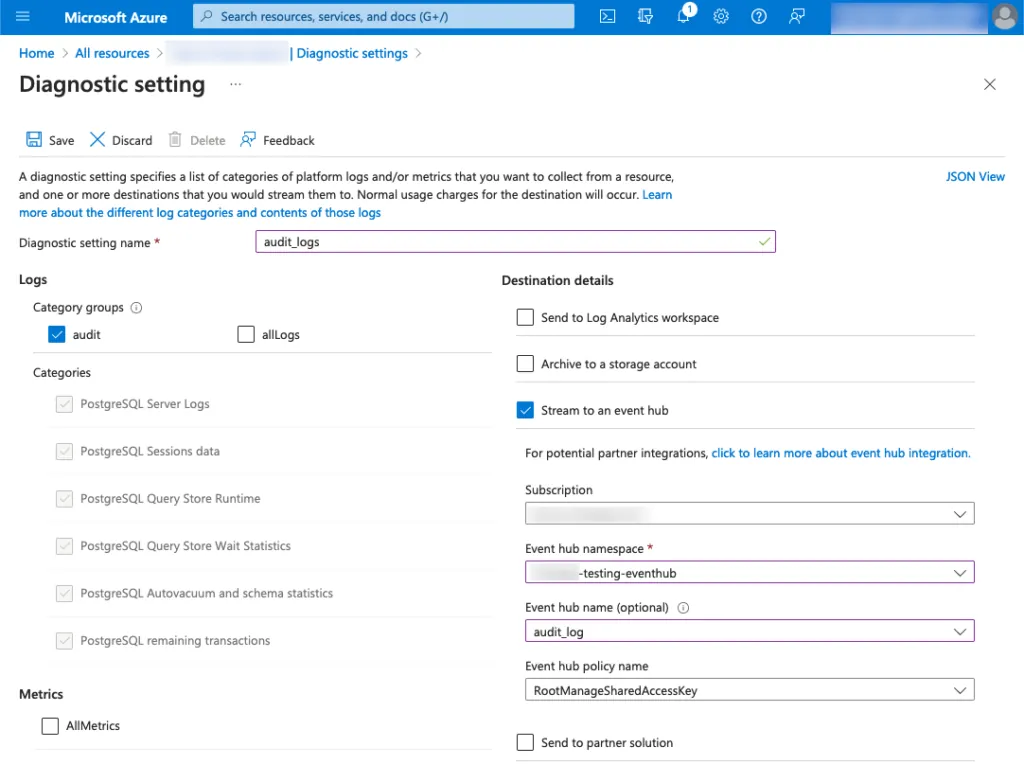
Shows the log categories on the left and the Event Hub destination on the right.
Forward from the Event Hub
Deploy the Azure Event Hub integration to collect the messages and submit them to Coralogix. Two deployment paths are available:
| Path | Use |
|---|---|
| Azure Event Hub ARM | Deploy from an ARM template |
| ARM Event Hub integration package | Deploy the packaged version |
| Azure Event Hub Terraform | Deploy with Terraform |
Restart the function after deploying. It does not pick up the new diagnostic setting until it restarts.