Telegraf operator
Supported OS: linux | windows | macOS
Telegraf Operator is an application designed to create and manage individual Telegraf instances in Kubernetes clusters. Use it to collect, process, and aggregate metrics from applications in your Kubernetes cluster and send them to Coralogix.
Once installed, Telegraf Operator watches for pods deployed with a specific set of pod annotations. The advantage of using Telegraf Operator is that you only have to define the input plugin configuration for Telegraf when creating the pod annotations. Telegraf Operator then sets the configuration for the entire cluster, avoiding the need to configure a metrics destination when deploying applications.
This tutorial demonstrates how to run Telegraf Operator in Kubernetes to export your telemetry data to Coralogix.
Prerequisites
Sign up for a Coralogix account. Set up your account on the Coralogix domain corresponding to the region within which you would like your data stored.
Access your Coralogix Send-Your-Data API key.
Install Kubernetes. This should include installation of the command-line tool kubectl, designed to operate on your Kubernetes cluster.
Install and configure Helm. We suggest you use this guide to familiarize yourself with the basics of using Helm to manage packages on your Kubernetes cluster.
Set Up
Installation
STEP 1: Add the Influxdata Helm Chart Repository
Open a new terminal and install the Influxdata Helm chart repository:
STEP 2: Install Telegraf Operator
Update the Helm chart from the added repository:
Configuration
STEP 1: Create YAML-Formatted Override File
Telegraf Operator allows you to configure how Telegraf sidecars send data using classes. Each class is a subset of the Telegraf configuration and defines where Telegraf Operator should be sending its outputs. You can create or modify existing classes using Helm values file, as shown in the example below.
In order to send your data to Coralogix, you are required to declare particular variables in your template:
service_address: Coralogix OpenTelemetry endpoint associated with your Coralogix domainprivate_key: Coralogix Send-Your-Data API key, recorded in the override file as a secret in order to ensure that it remains protected and unexposed$HOSTNAME&$NODENAME: Each Telegraf Operator class includes these global tags.$HOSTNAME, which will serve as your Coralogixsubsystemname, is typically set to pod name.$NODENAMEis typically set to node name. Find out more about defining environment variables for Kubernetes containers here.$NAMESPACE: This variable is Telegraf Operator pod annotationtelegraf.influxdata.com/env-fieldref-NAMESPACE: metadata.namespacethat can be used to configure the Telegraf sidecar. This variable will serve as your Coralogixapplicationname.
image:
 sidecarImage: "docker.io/library/telegraf:1.24.2"
classes:
  secretName: "telegraf-operator-classes"
  default: "infra"
  data:
    infra: |
      [[outputs.opentelemetry]]
        service_address = "ingress.:443"
        compression = "gzip"
        [outputs.opentelemetry.coralogix]
          private_key = "<private_key>"
          application = "$NAMESPACE"
          subsystem = "$HOSTNAME"
      [global_tags]
        env = "ci"
        hostname = "$HOSTNAME"
        nodename = "$NODENAME"
        namespace = "$NAMESPACE"
        type = "infra"
Save this file as a coralogix-values.yaml file in a directory of your choice.
STEP 2: Apply the Configuration
Apply the configuration by running the following command:
helm upgrade --install telegraf-operator influxdata/telegraf-operator --values <path/to/coralogix-values.yaml> -n <namespace>
Validation
To test your configuration, deploy a Redis instance with Telegraf Operator annotations.
Create a pod configuration
redis.yamlfile with the following data:apiVersion: apps/v1 kind: StatefulSet metadata: name: redis spec: selector: matchLabels: app: redis serviceName: redis template: metadata: labels: app: redis annotations: telegraf.influxdata.com/inputs: |+ [[inputs.redis]] servers = ["tcp://localhost:6379"] telegraf.influxdata.com/class: infra telegraf.influxdata.com/env-fieldref-NAMESPACE: metadata.namespace spec: containers: - name: redis image: redis:alpine3.16Run the pod by executing:
The pod should contain 2 running containers: redis and telegraf. Verify this by executing:
Here is an output example:
Verify that the pod is running:
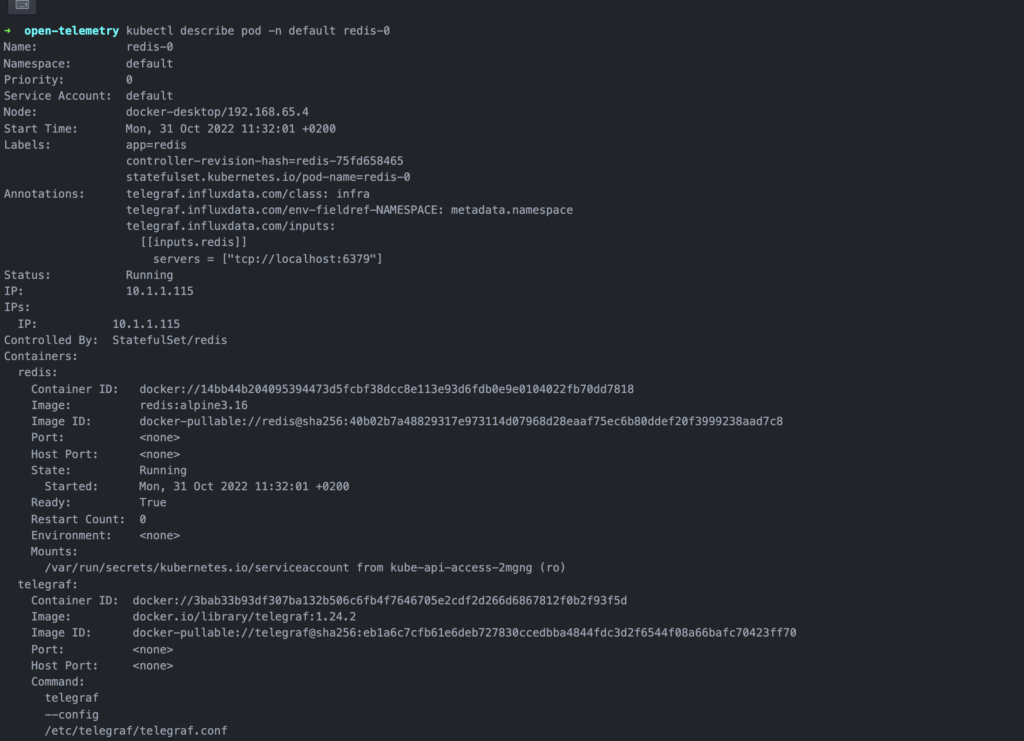
Here is an output example:
Access your Coralogix - Grafana dashboard to query the monitored targets.
- Navigate to Apps > Grafana Labs.
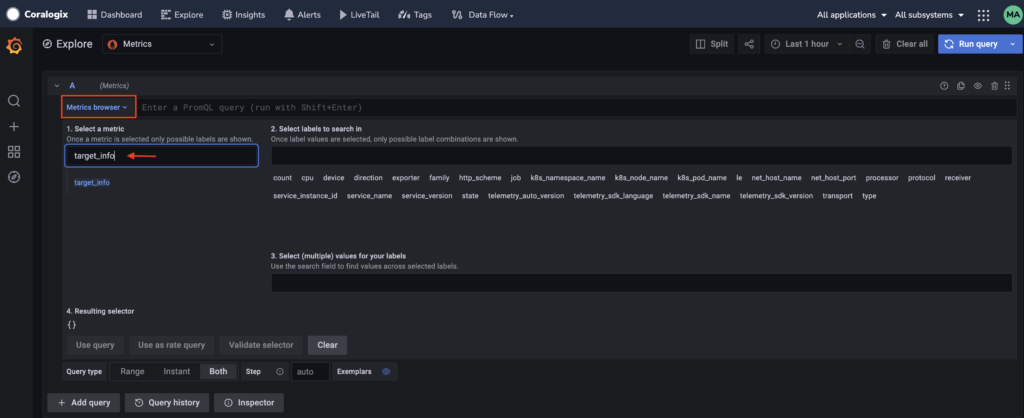
- Once you’ve accessed your Coralogix-Grafana dashboard, click on Explore tab in the left-hand browser.
- Click on the drop-down arrow of the Metrics browser and input
target_infoin the "Select a Metric" column.
- Click on the "Use Query" button in the bottom left-hand corner.
The query above should return metrics similar to the following:
To discover all Redis metrics, use the following PromQL:
This should result in:
...
redis_total_connections_received{__meta_applicationname="<redis-namespace>", __meta_subsystem="redis-0", cx_tenant_id="32680", env="ci", host="redis-0", hostname="redis-0", namespace="<redis-namespace>", nodename="rock64-1", port="6379", replication_role="master", server="localhost", type="infra"}
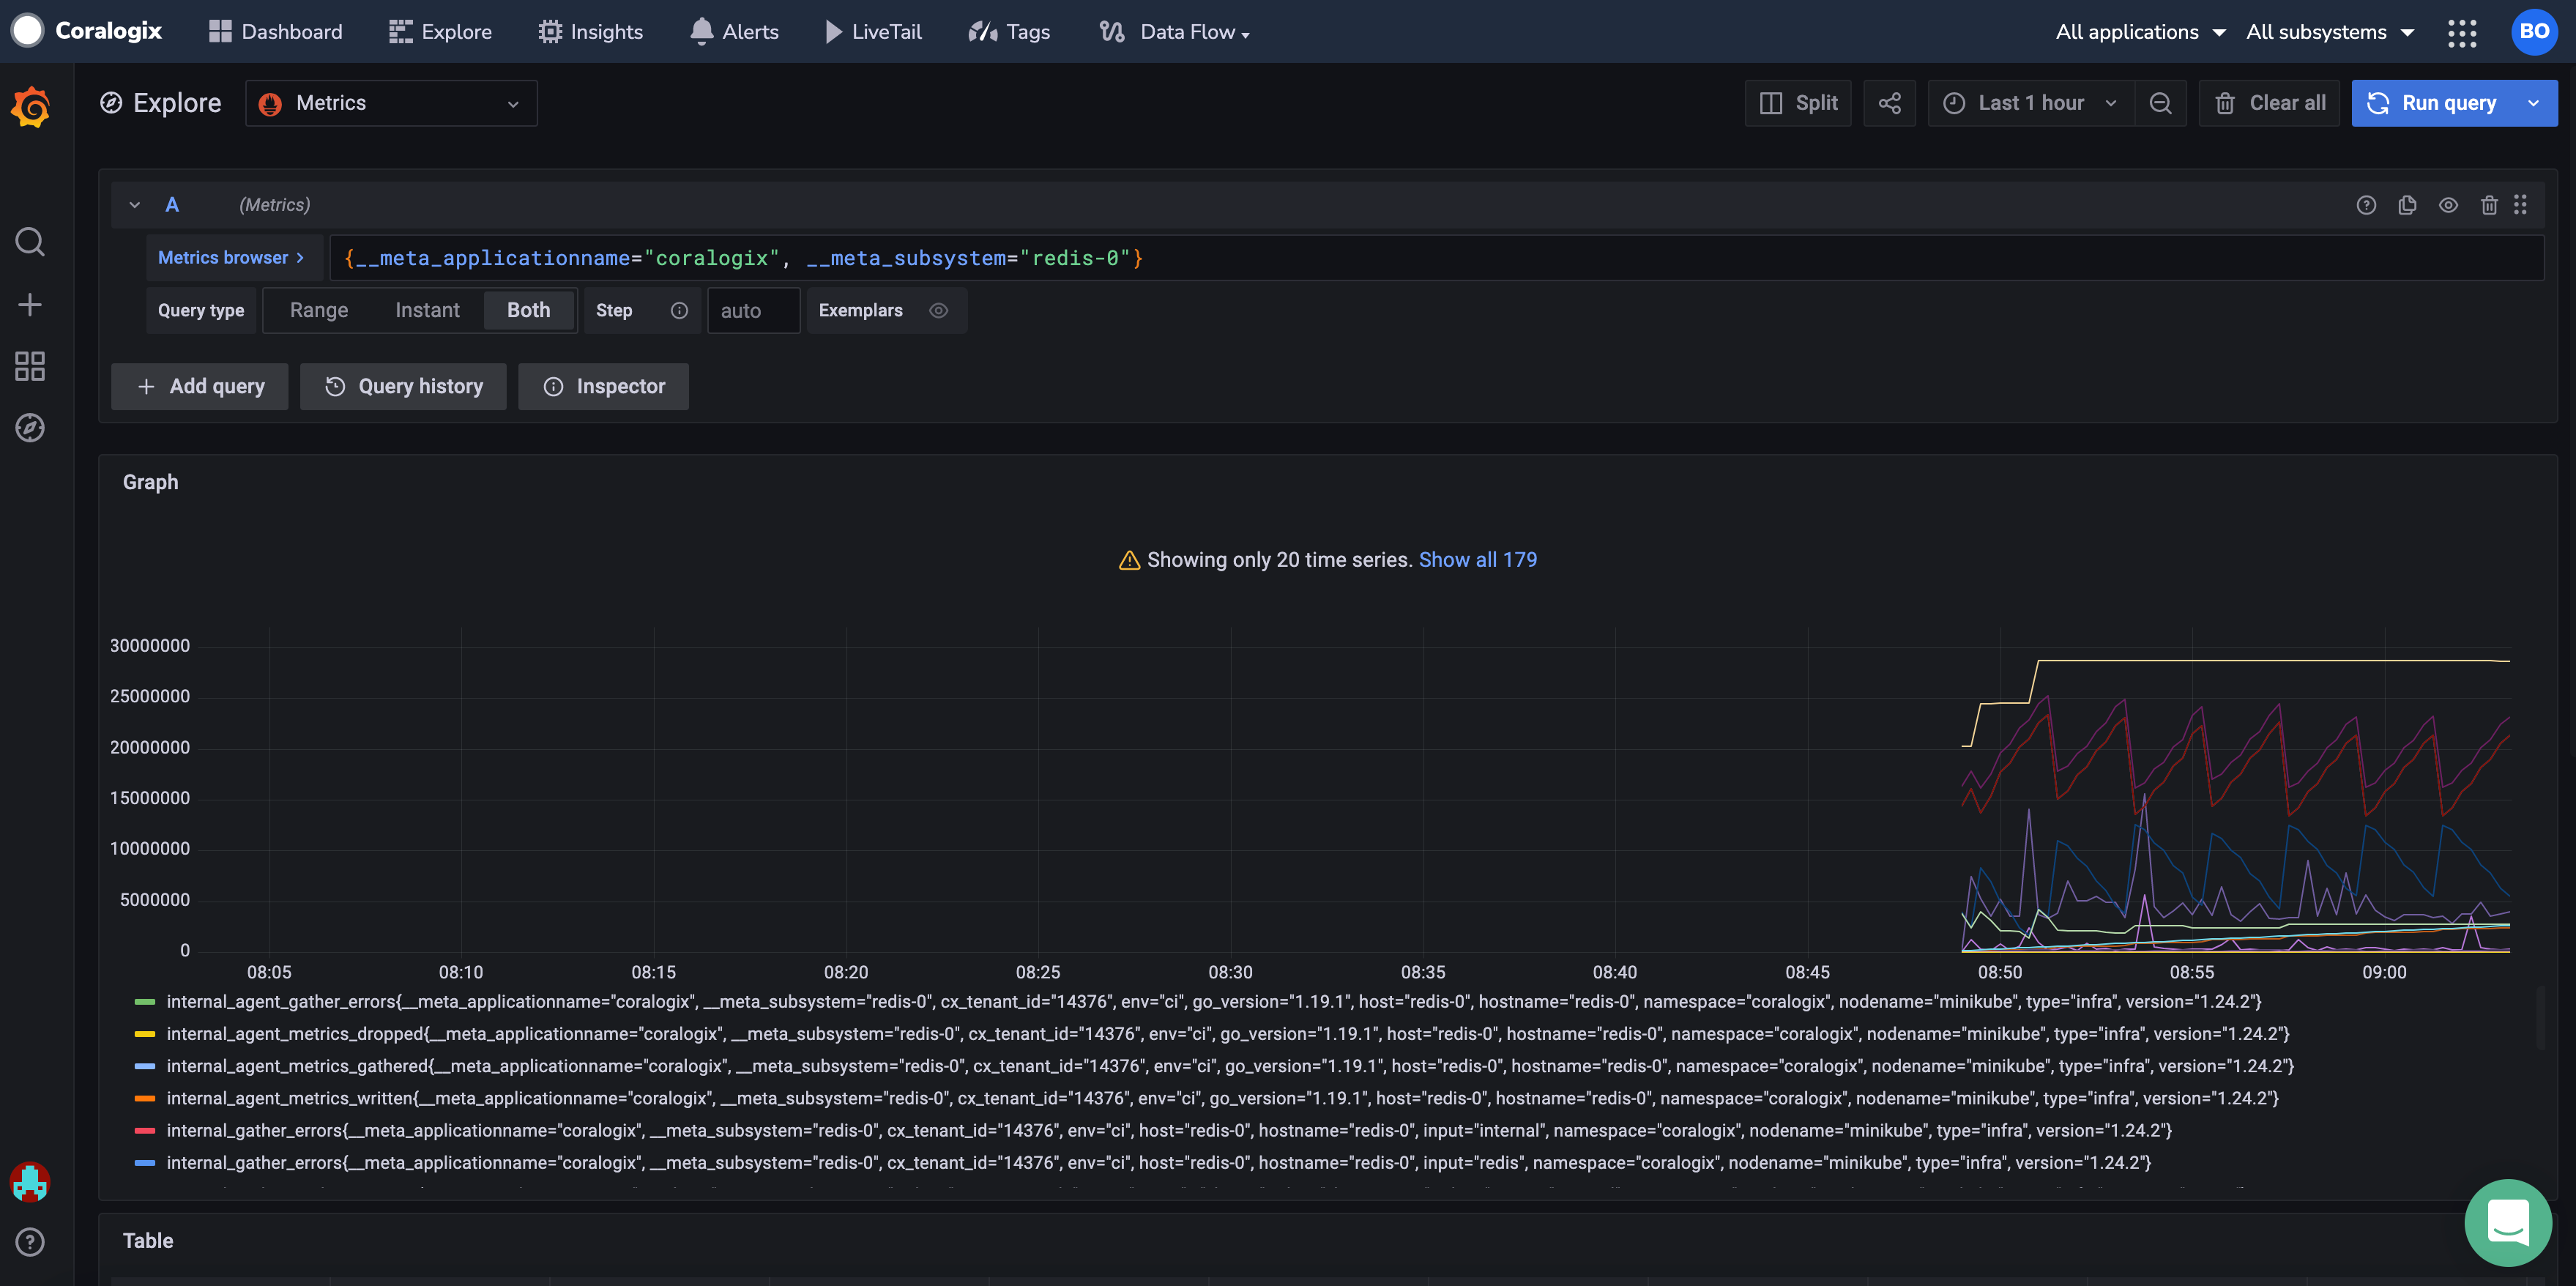
Here is a display of the expected result:
Once you have tested and validated your configuration with the Redis instance, delete this service by running the following command:
Additional References
| Github | Official Telegraf-Operator Documentation Offical Influxdata Chart Repo |
Support
Need help?
Our world-class customer success team is available 24/7 to walk you through your setup and answer any questions that may come up.
Feel free to reach out to us via our in-app chat or by sending us an email at [email protected].


