Heroku Logs
Use our logging add-on to seamlessly forward all Heroku logging output to Coralogix.
This tutorial demonstrates how to:
Create a sample application
Configure your Heroku Shield private space to send logs to Coralogix
Attach multiple Heroku apps to one Coralogix account
Overview
Logging add-on
Coralogix offers a logging add-on that forwards all Heroku output to a Coralogix account that you specify.Alternatively, you can use the CLI with the following:
heroku addons:create coralogix:test
Within seconds, any logs that your application generates will feed right into Coralogix, paving the way for using our high scale, high-speed search, and analytics.
Extension package
In addition, Coralogix offers an extension package for Heroku logging that includes a set of Heroku parsing rules to parse the unstructured data streaming from your Heroku app, a set of predefined Heroku alerts, and a predefined dashboard for your Heroku Router logs. What you will need to do to get those is go to Coralogix Extension Packages and deploy the Heroku extension package and then, with a click of a button, you will get tremendous value out of your Heroku Router logs.
Here’s a basic example that shows that even with a small application generating simple log records, as soon it starts scaling, logs become hard to traverse and understand.
Sample application
The sample application consists of a Python and Ruby application that randomly generates a Cat from the Cat API every 2 seconds and logs the value.
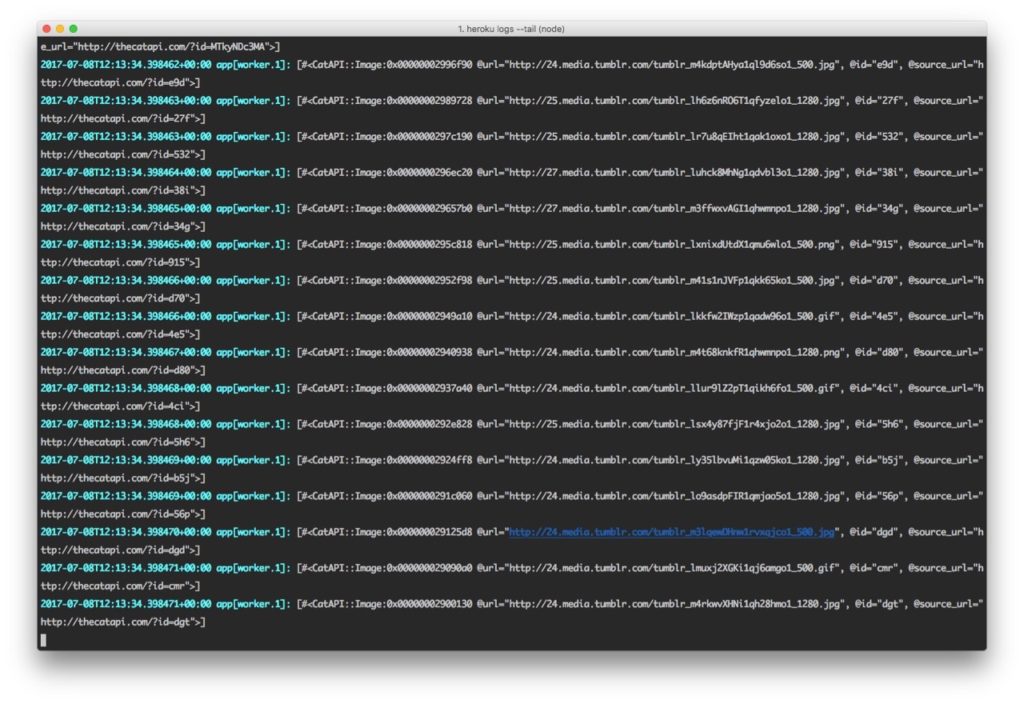
I started with one instance of each, then scaled to three instances. Here are the logs using heroku logs on one instance.
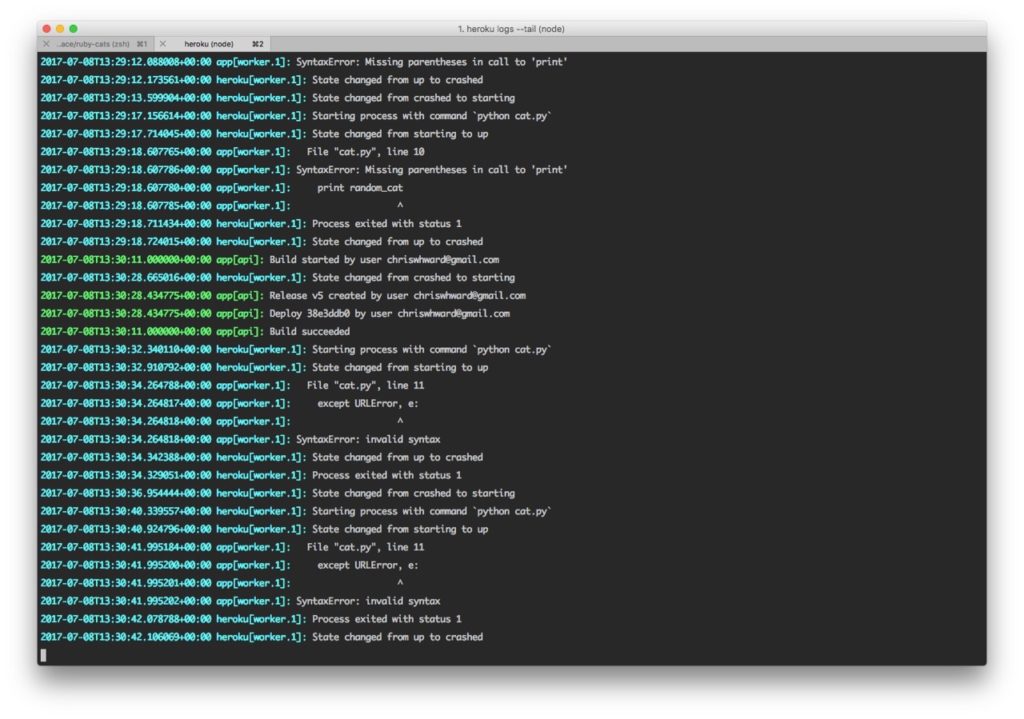
Here's an example of mixed logs with messages from Heroku, debug messages, and errors. It's already getting confusing.
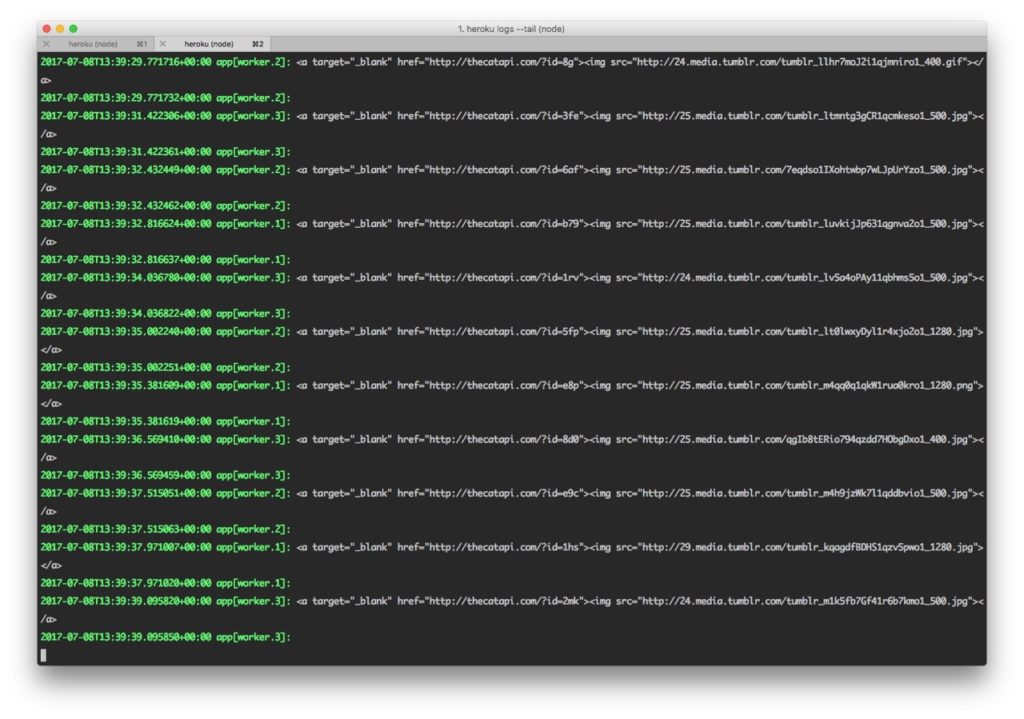
Throw in two more workers and tracking down the source of messages becomes even more confusing. The sample application has two applications running three workers each.
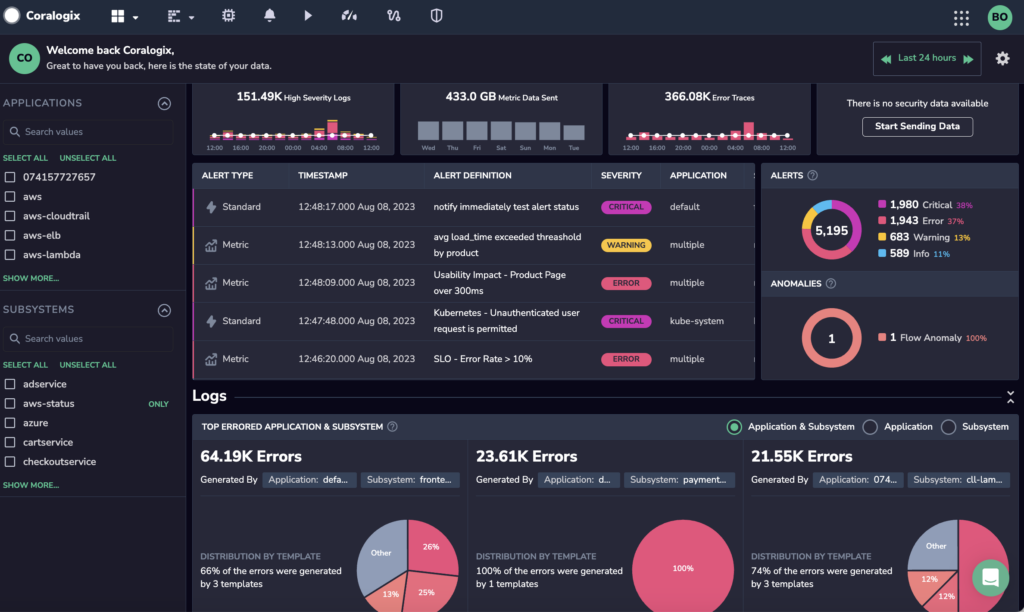
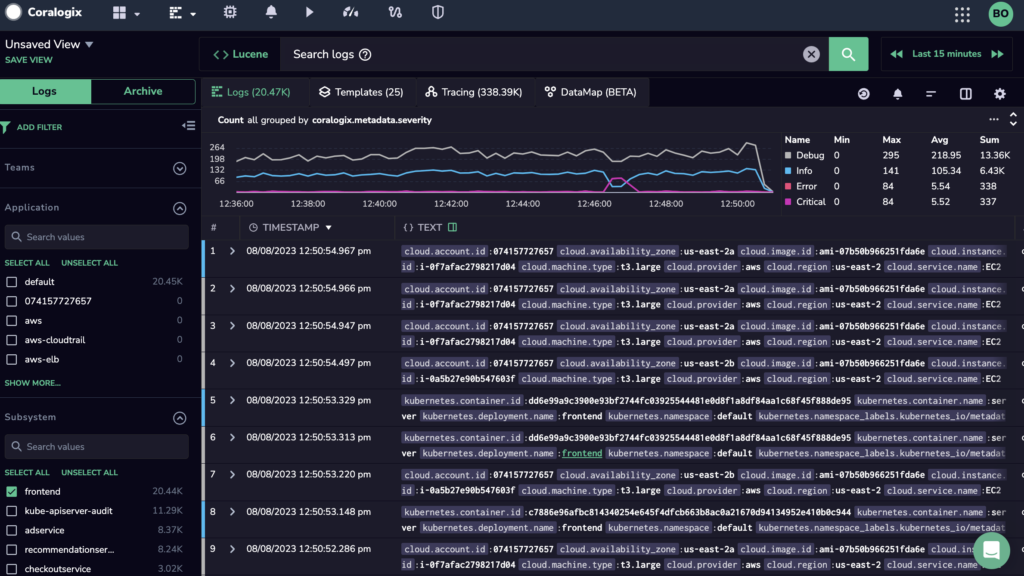
We can do this a lot more efficiently using Coralogix. To begin, open the dashboard page, or use the CLI and check the initial display right after you start sending logs:
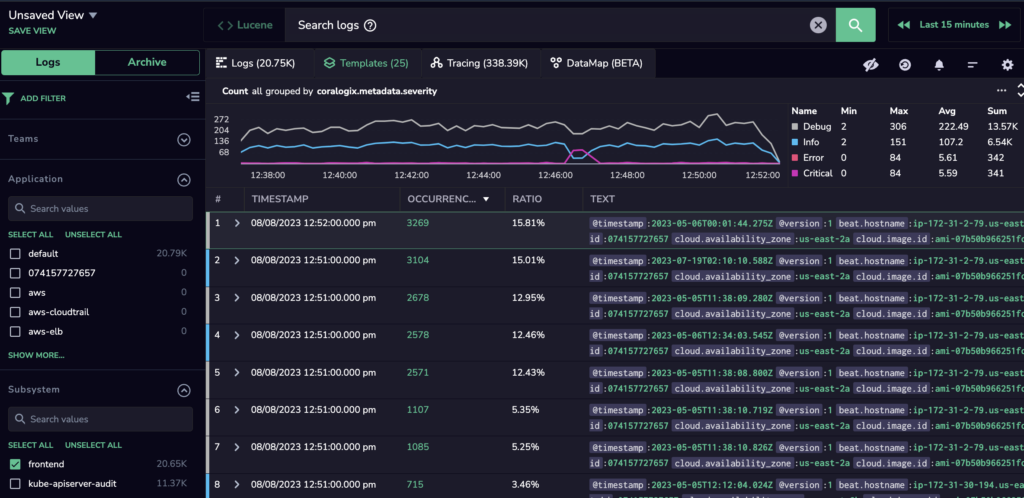
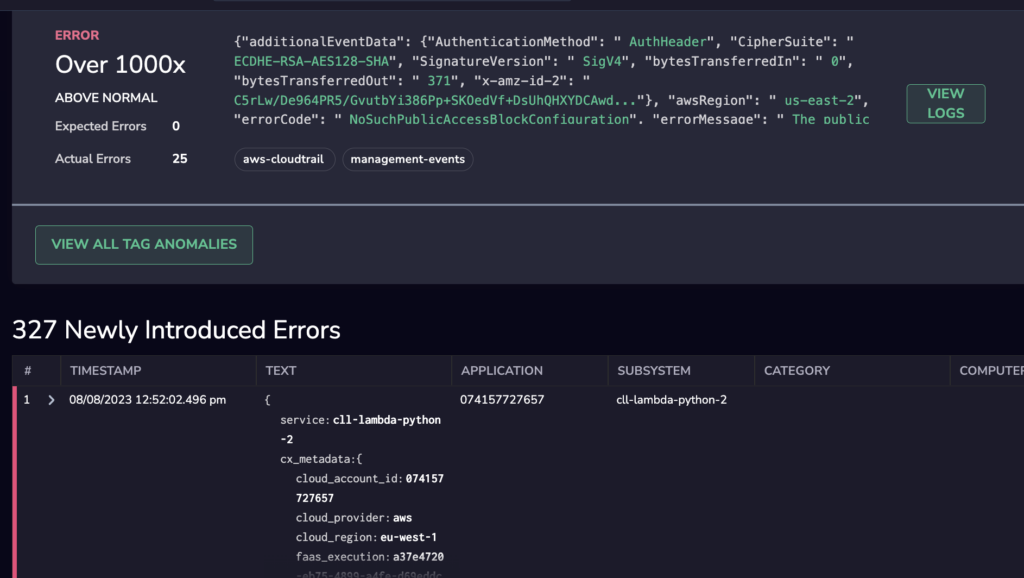
After 24 hours, the Coralogix Loggregation feature automatically clusters log entries – which makes finding what you need faster and powers our ML-powered anomalies. In the screenshot below, you can see that Loggregation has identified that despite being ‘random’, the CatAPI repeats itself a lot, outputting the same value over 1,000 times. In this case, it’s not important, but in a mission-critical application, this helps you identify patterns clearly.
Errors and broken flows are often introduced by new versions and application builds. The Coralogix Heroku integration includes integration to Heroku Pipelines and offers an automatic status for new Heroku builds (i.e. tags in Coralogix). Coralogix presents the suspicious and common errors introduced since that build as well as the alerts and anomalies which might be related to the new version release, thus allowing you to correlate issues to particular versions and points in time.
After 5 days of learning, Coralogix will start to send a daily report highlighting new anomalies (errors and critical messages), further helping you identify new errors, and not constantly bombard you with logging noise.
In addition to the machine learning aspect, Coralogix offers a complete set of logging capabilities, including Log Query, a centralized live tail, user-defined alerts to email or slack, and dashboard creation.
Provision the Coralogix addon and start enjoying 3rd generation Log analytics
Private space logging
You may configure your Heroku Shield private space to send logs to Coralogix by pointing the Heroku log drain to the appropriate Coralogix destination. This destination is a combination of your Company ID, Private Key, Application Name and the cluster-dependent Endpoint.
Refer to Coralogix endpoints to select the correct Coralogix endpoint for the domain associated with your Coralogix account. Use the obtained endpoint to replace the <Endpoint> section of the URL below. Replace the <CompanyId> and <PrivateKey> sections of the URL below with your Coralogix Company ID and Private Key.
You can then use this URL to add or remove log drains via the Heroku CLI as follows:
Add:
heroku drains:add https://<CompanyId>:<PrivateKey>@<Endpoint>/logs/heroku/private?appName=<applicationName> -a myapp
Remove:
heroku drains:remove https://<CompanyId>:<PrivateKey>@<Endpoint>/logs/heroku/private?appName=<applicationName> -a myapp
Find out how to find Heroku messages from a specific app here.
Attaching multiple apps to a single Coralogix account
You can add multiple apps to the same Coralogix account you created when provisioning your first Heroku app with the Coralogix add-on. All apps will have a unified billing and you will be able to filter by our tag of "application name".
To attach multiple apps to the same Coralogix account using CLI, follow this link. Or from your Heroku dashboard: configure addons -> open details for Coralogix -> attach another app.
Note
Removing your parent Heroku app, to which Coralogix was provisioned originally, will remove the Coralogix addon from all other apps that were attached to this Coralogix account in the past.
Support
Need help?
Our world-class customer success team is available 24/7 to walk you through your setup and answer any questions that may come up.
Feel free to reach out to us via our in-app chat or by sending us an email at support@coralogix.com.
