Provider Status Monitoring
This feature is available for early-access customers. To request access and confirm your organization meets the feature criteria, contact your account representative or Support.
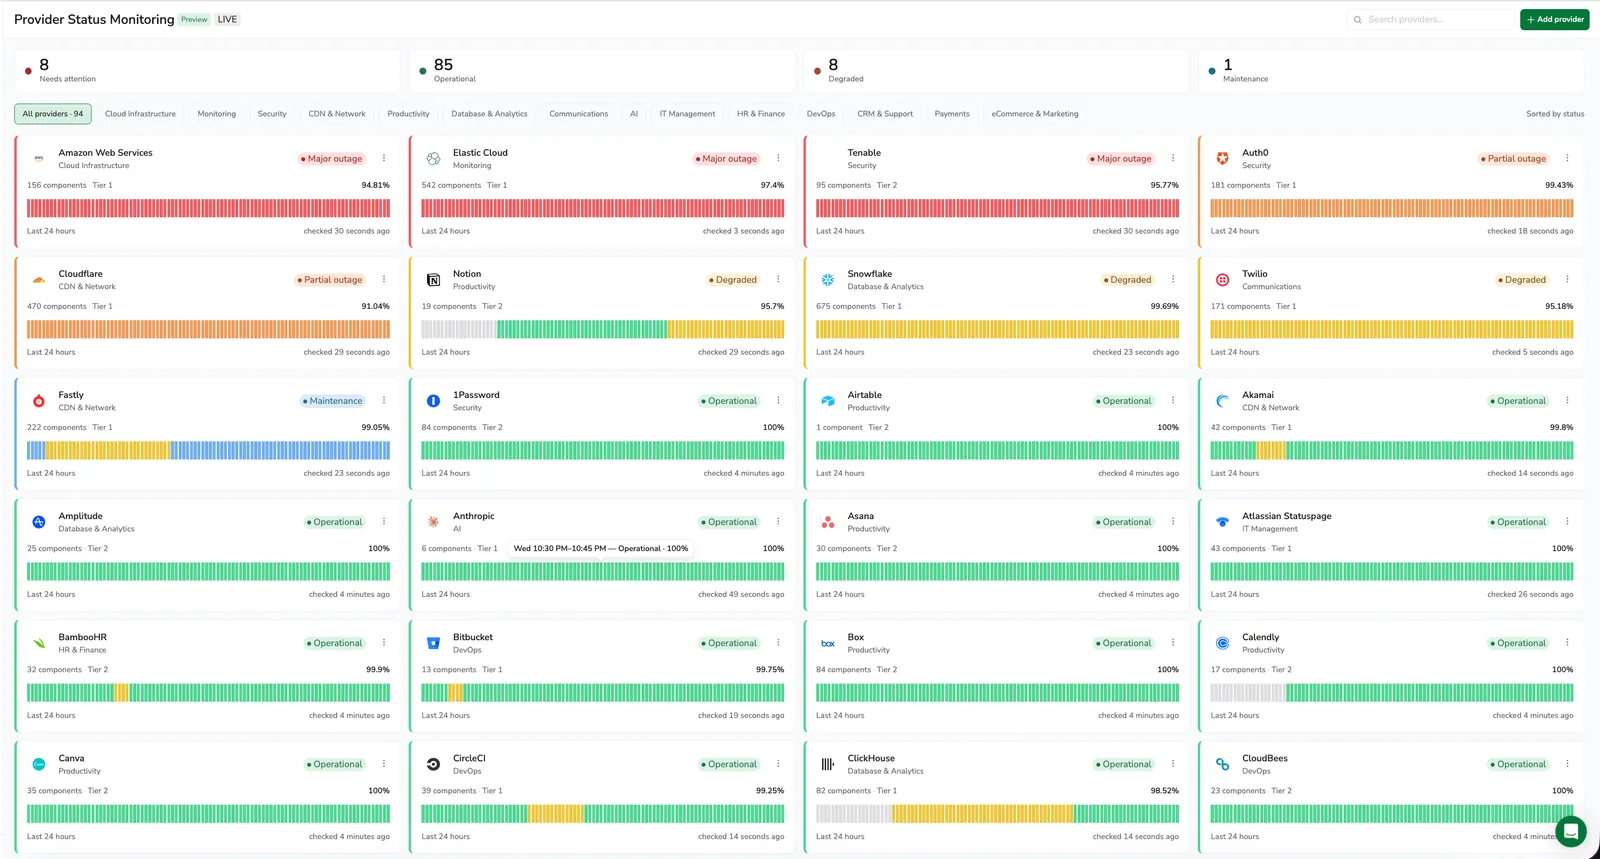
The Provider Status Monitoring page gives you a single view of the third-party services your applications depend on, such as cloud platforms, SaaS applications, developer tools, and other external providers. Rather than checking each dependency separately, you can track them all in one place.
To open the Provider Status Monitoring page, select Integrations, then Provider Status Monitoring in the navigation sidebar. The page lists providers sorted by their status. For each provider, you can see how many components are monitored, its uptime over the last 24 hours, and when its status was last checked. Use it to quickly determine whether a problem in your environment coincides with a known outage at one of your dependencies.
What you need
Before you start monitoring providers, make sure you have:
- These permissions:
INTEGRATIONS:READCONFIGto view the Provider Status Monitoring page.INTEGRATIONS:DEPLOYto add, edit, or delete a provider.
- An archive configured on your storage service, to view a provider's recent incidents and maintenance periods. Learn more about configuring your Amazon S3 or connecting a Google Cloud Storage archive bucket.
How Coralogix reports provider status
Status and severity
A provider or component might report any of the following statuses, sorted by increasing severity:
- Operational: Service is operating normally.
- Degraded: One or more monitored components report degraded performance.
- Partial outage: Service is partially unavailable.
- Major outage: Provider reports a significant outage.
A provider's status reflects the most severe status of any of its components. Similarly, a component group's status reflects the most severe status of any component it contains, and a component's status reflects the most severe status of any of its regions.
A provider or component can also report:
- Maintenance: Provider is in a scheduled maintenance window.
- No data: Coralogix does not have status information for the component yet.
Provider category and tier
Coralogix assigns each provider a category and a tier.
The category describes what kind of service the provider offers, such as DevOps, Security, or Cloud Infrastructure. You cannot change a provider's category, but you can use categories to filter the provider list or search for providers in a specific category.
The tier determines how often Coralogix checks the provider's status page: Tier 1 providers are checked every minute, and Tier 2 providers every five minutes. While a provider has an active incident, Coralogix checks its status every 30 seconds regardless of tier, and returns to the regular tier frequency after three consecutive checks find no active incident.
Manage providers
You can add providers, edit existing ones, and delete providers you no longer want to monitor.
Add a provider
To add a provider:
-
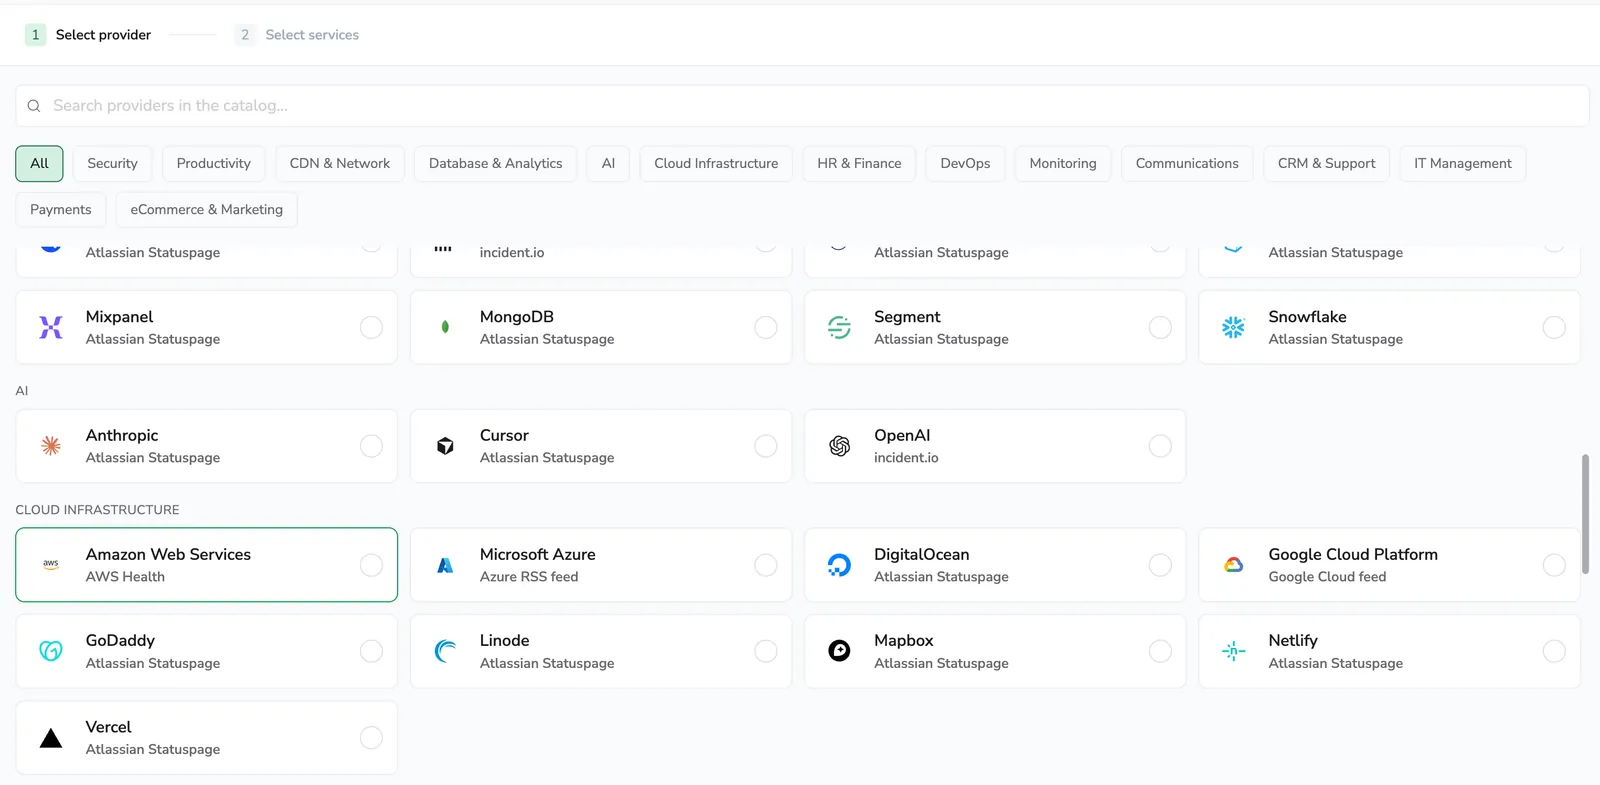
In the top right corner of the page, select Add provider, then select the provider you want to monitor.
-
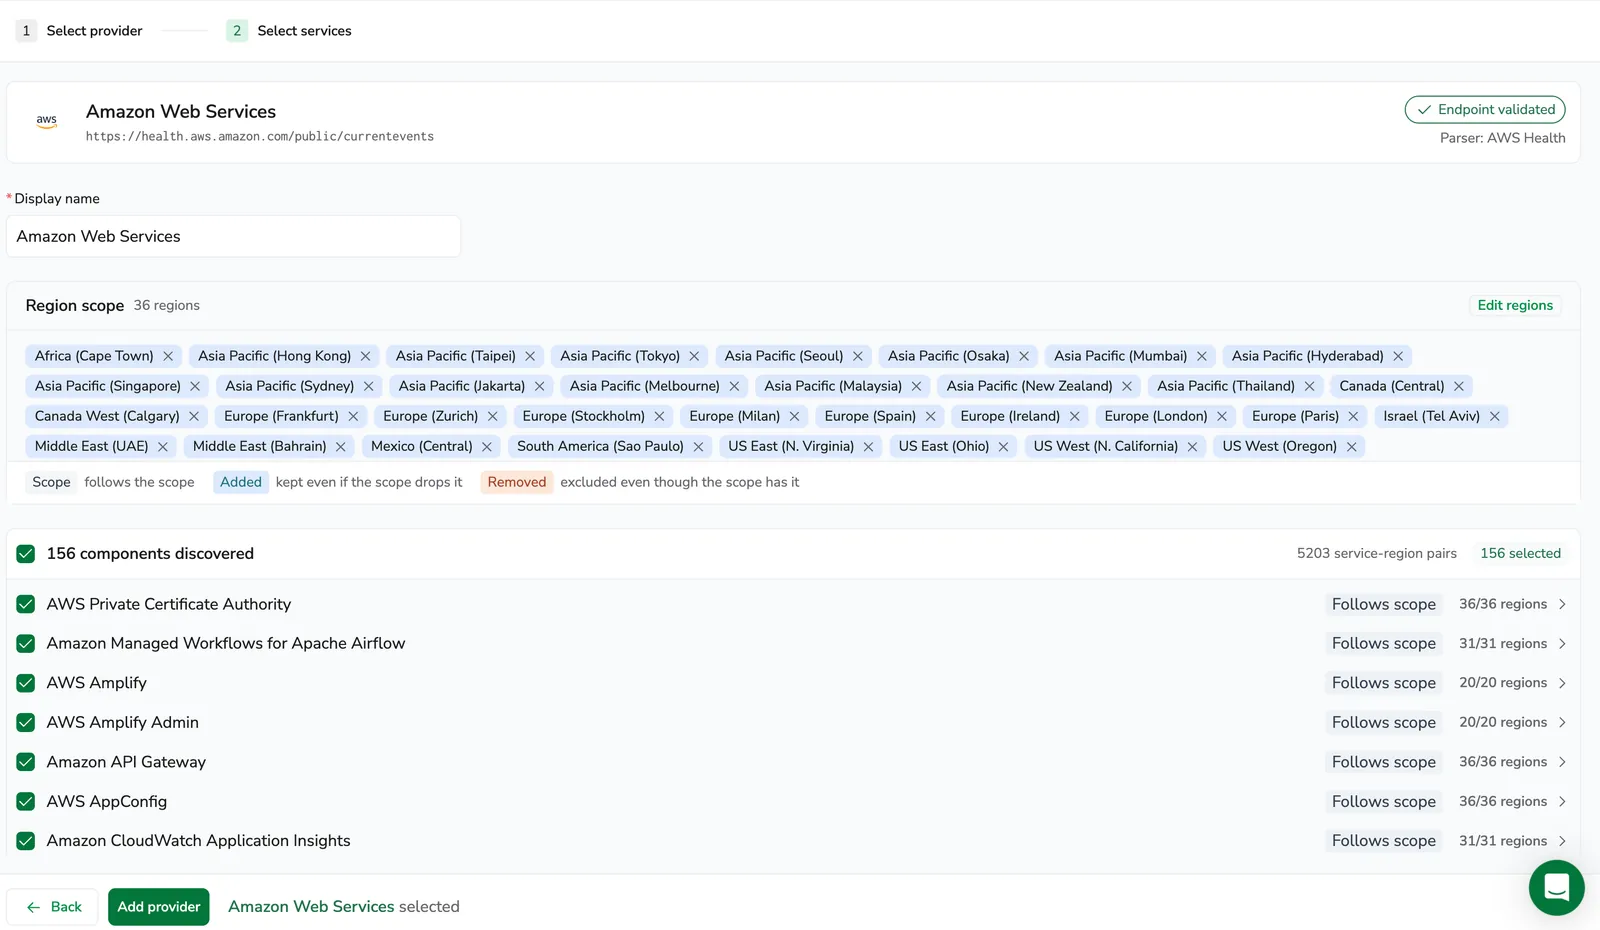
On Select services, set what to monitor:
- Components: every component the provider publishes is selected by default. Search the list, or clear the ones you do not need. Providers that organize their components into groups show them as an expandable tree.
- Region scope: providers that report per region have a region scope that every selected component inherits, starting with all regions. Select Edit regions to narrow it, and expand an individual component to override the scope for that component alone.
-
Select Add provider.
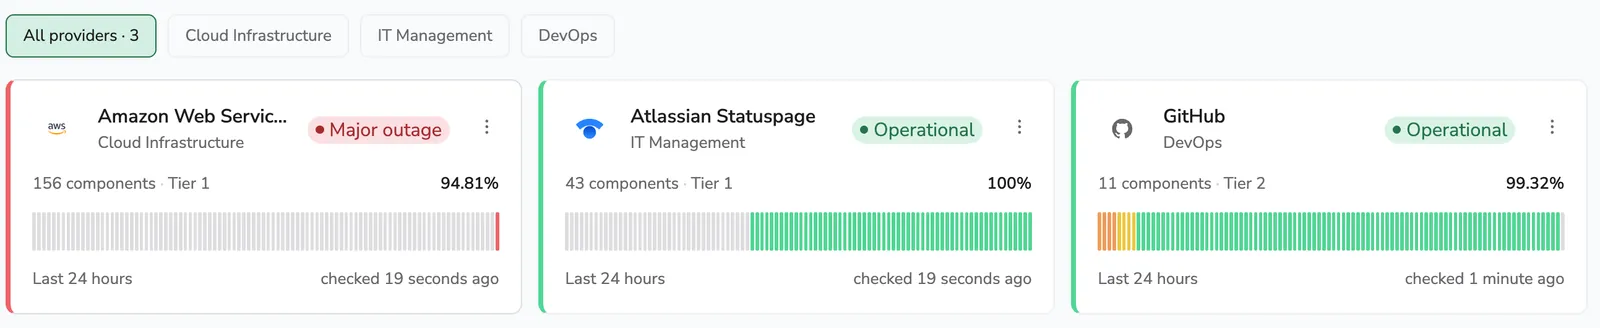
The provider appears on the Provider Status Monitoring page.
Edit or delete a provider
Editing a provider lets you change its region scope and monitored components. To edit or delete a provider, select the more actions menu on the provider's card, then select Edit or Delete.

View provider details
Select any provider to view its summary, the components being monitored, and a list of recent incidents and maintenance periods.
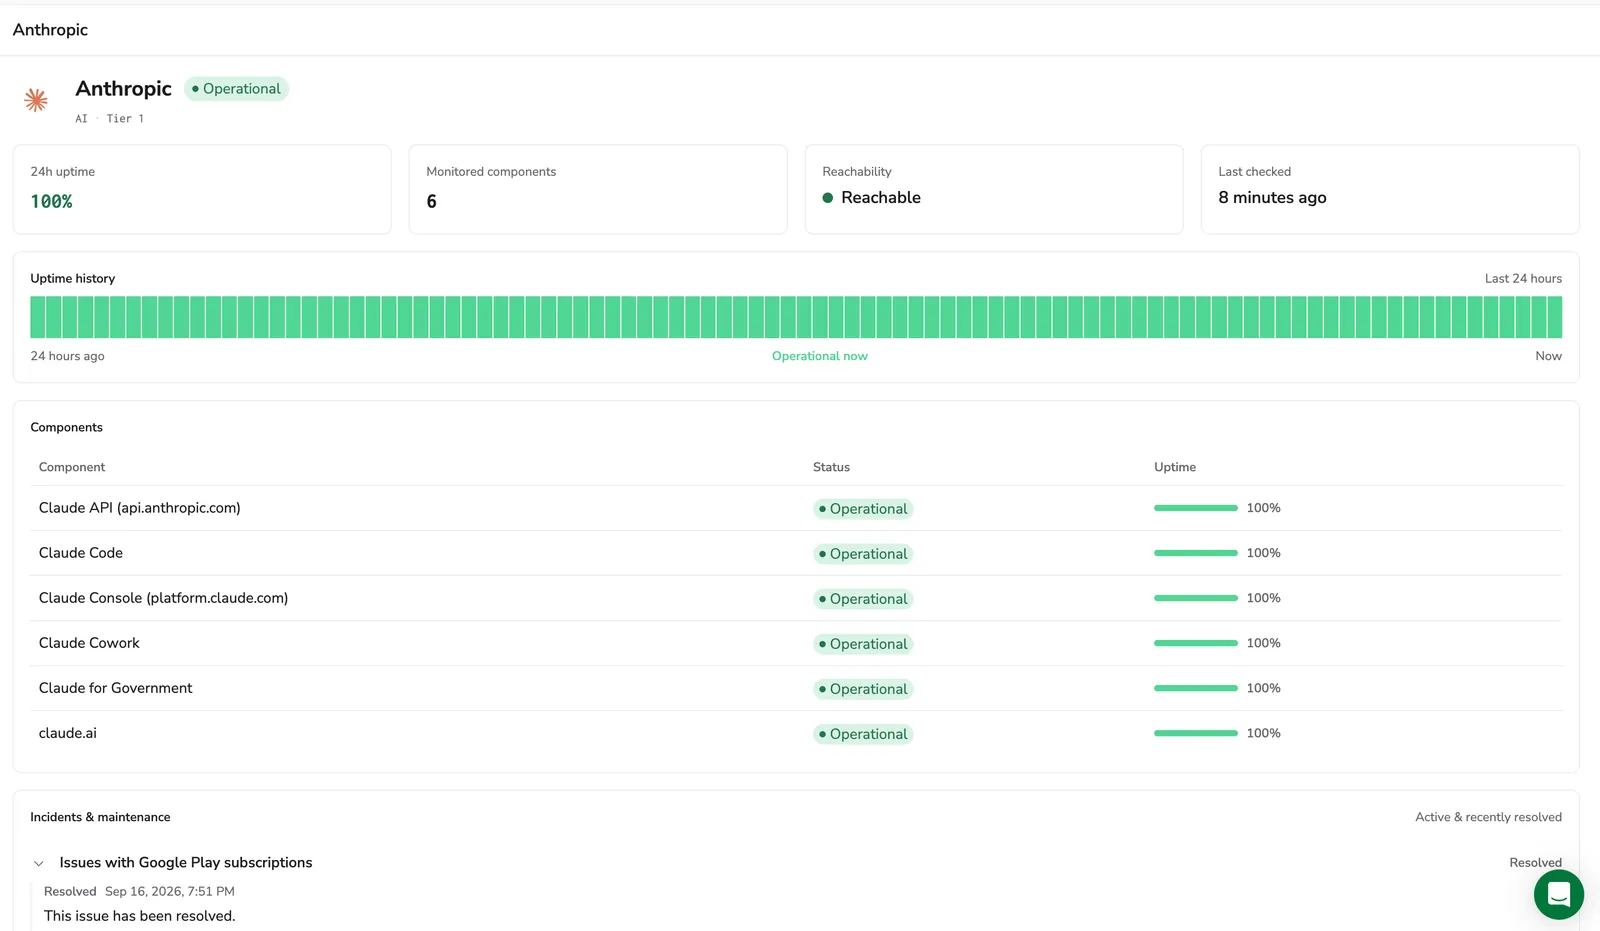
The summary shows the following information:
- 24h uptime: Provider's uptime over the last 24 hours.
- Monitored components: Number of components being monitored.
- Reachability: Whether Coralogix can reach the provider's status page for updates. It does not reflect the provider's health. While a provider is unreachable, its components report No data.
- Last checked: When the provider's status was last checked.
The Uptime history bar reflects the same 24 hours, segmented into 15-minute blocks. Each block is color-coded to reflect the provider's status during that time.
The Components section shows the status and uptime of each monitored component.
When your storage service has an archive configured, the Incidents & maintenance section lists recent incidents and maintenance periods.
Limitations
- Availability history starts when you add the provider. Status updates that occurred before you added the provider are not reported.
- Editing which components you monitor takes effect immediately, but past uptime is not recalculated. The Uptime history bar keeps the segments already recorded and reflects the new configuration from the moment you save. It does not indicate where the change occurred.