Explore
Explore is your home base for investigating, troubleshooting, and analyzing your logs and spans.
- Begin from the Zero state — a quick-action tile (for example, Log volume over time or Error spans over time), a recent query, a saved view, or arrive here from another entry point across the platform.
- From there, you can search and filter results, and easily group and aggregate data with the Query Builder. Advanced users can execute advanced queries with Coralogix's DataPrime query syntax.
- Visualize the results of your filters and aggregations to better understand your data and drill down into specific logs or spans to investigate further.
- Use tabs to run queries in parallel, compare results across different filters or services, and then save and share specific views and queries.
 Explore overview animation
Instantly create a query and begin your exploration. Start by selecting a dataset.
Zero state
When you open Explore on a fresh tab, the results area shows the Zero state — "What would you like to explore?" — instead of a results grid. Use it to launch a query from a preset, jump back into a recent query, or reopen a recent saved view.
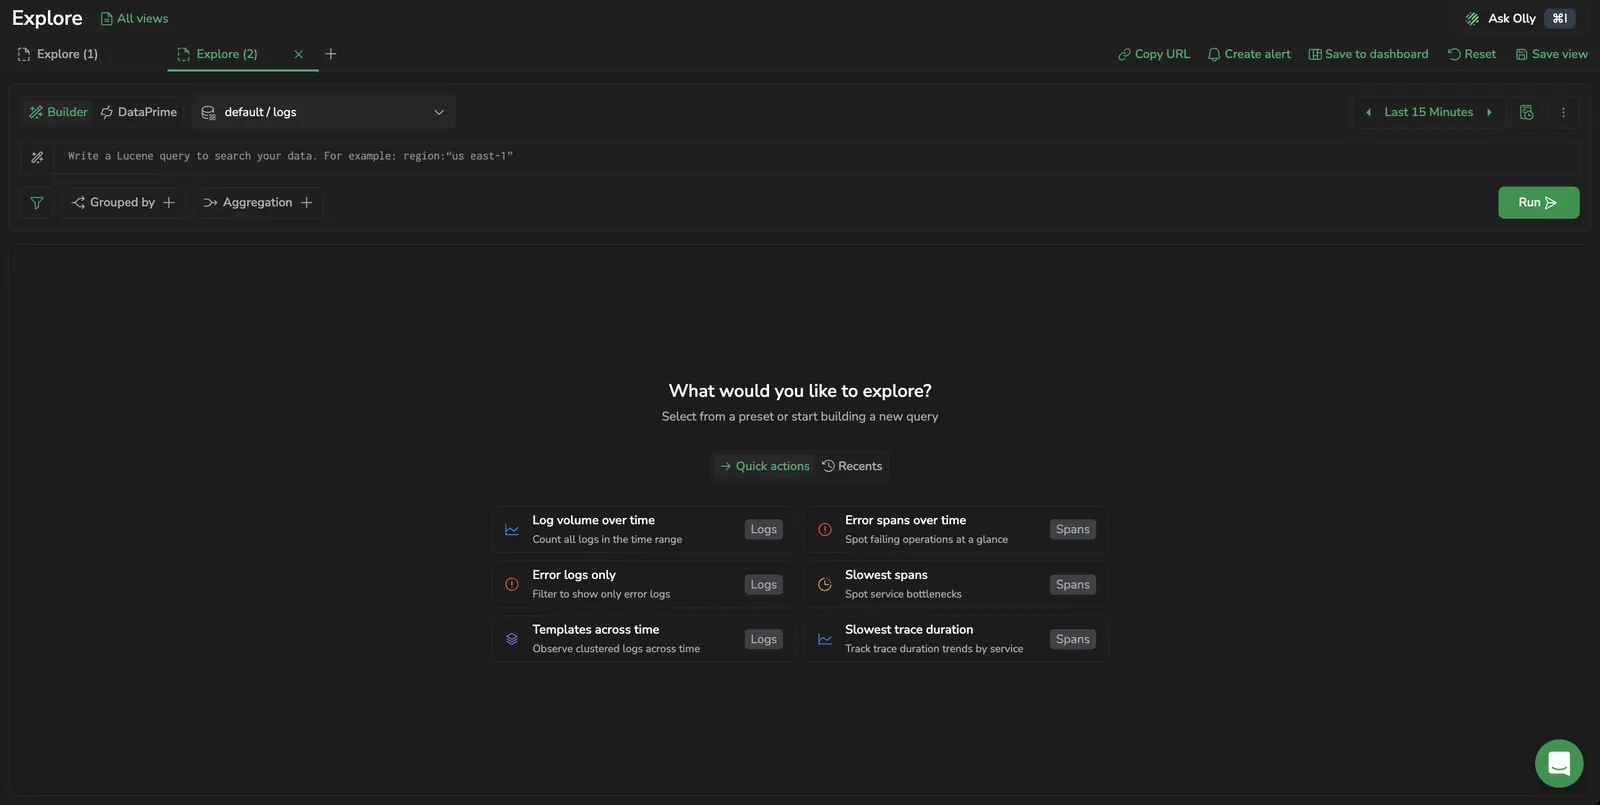
The Zero state has two tabs:
- Quick actions: pre-built tiles that pre-fill a query.
- Recents: your recent queries and recent saved views.
The tab switcher only appears once you have at least one recent query or saved view. Until then, Explore shows the Quick actions list directly.
Quick actions
The Quick actions tab is split into Logs and Spans sections. Each tile runs against the right dataset and lands you on the right results view.
| Section | Tile | What it runs |
|---|---|---|
| Logs | Log volume over time | Count of all logs in the time range, on the logs dataset. |
| Logs | Error logs only | Logs filtered to severity Error or Critical, on the logs dataset. |
| Logs | Templates across time | Logs grouped by template, opened on the Templates tab. |
| Spans | Error spans over time | Spans filtered to errors only, on the spans dataset. |
| Spans | Slowest spans | Spans grouped by service and operation, ordered by avg(duration) descending — opens on the Overview tab. |
| Spans | Slowest trace duration | Trace roots grouped by service, ordered by max(duration) descending — opens on the Traces tab. |
Recents
The Recents tab has two columns:
- Recent queries: your most recent queries from query history (up to 5). Empty queries and pure group-by/aggregate selections are filtered out so the list always carries something you can re-run.
- Recent views: your most recently opened saved views (up to 5).
Select any entry to load it into the current tab. For more entries — or to manage them — open the Query catalog or the All views panel.
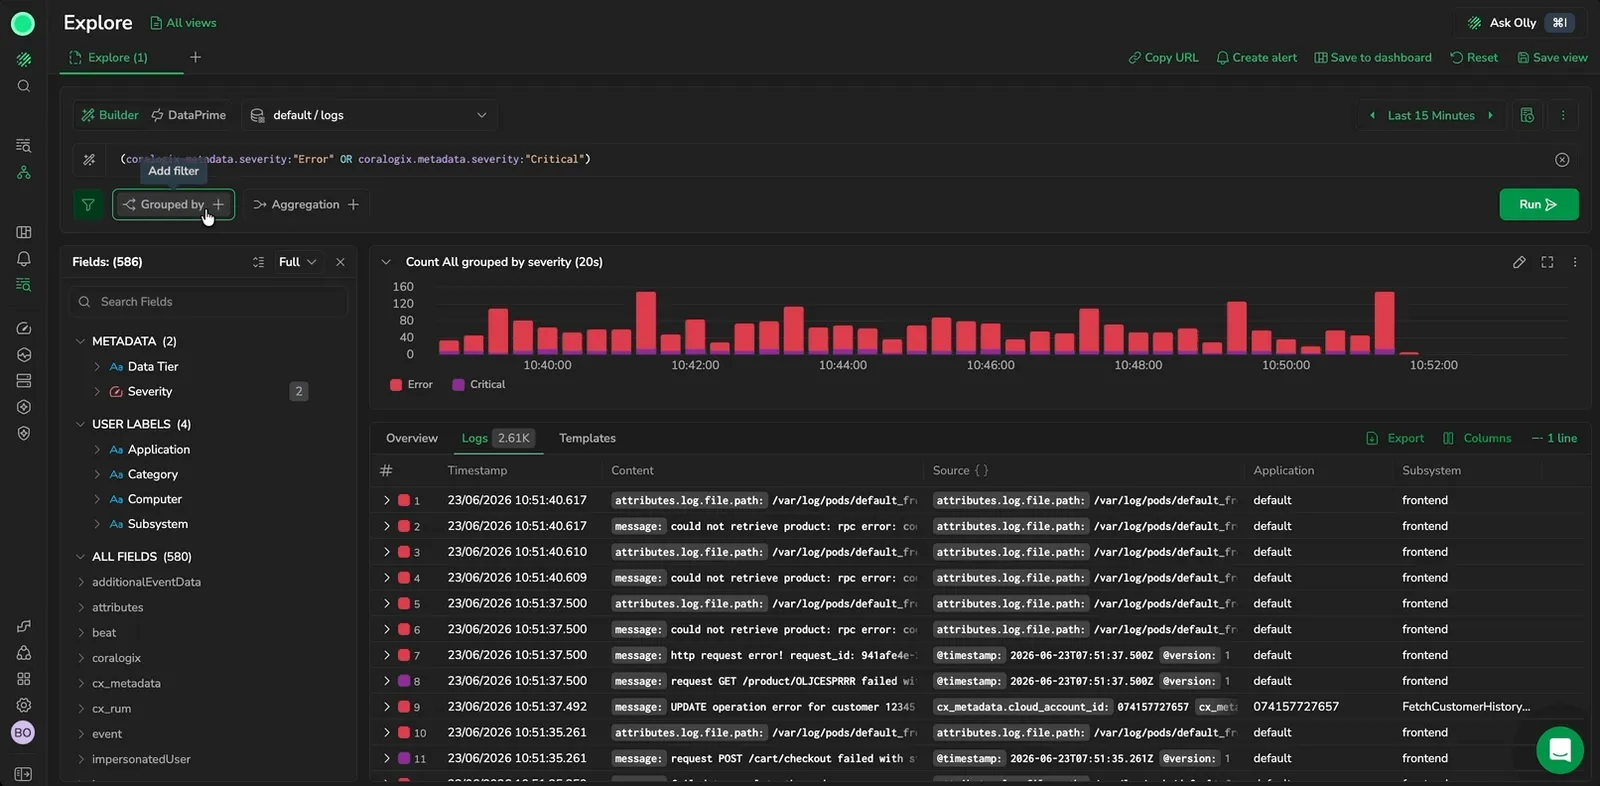
Lucene search and log filter
Search logs and spans of interest by inputting a Lucene query in the search bar.
Narrow down, broaden, or shift your focus on a subset of logs tailored to your current interest using Fields to filter.
Make big data small
Logs
Use Templates to group high-volume logs into meaningful patterns so you can quickly identify new, rare, and abnormal errors, reduce noise during investigations, and operationalize error discovery with alerts and automation.
Spans and traces
When querying the spans dataset, use the Spans and Traces tabs to control the granularity of your investigation. The Spans view also offers Overview, Flows, Highlights, and Signals tabs alongside them. Select any span or trace to open the span drilldown for detailed analysis, including visualization modes, span attributes, related data, and quick actions.
Query and analyze
In Builder mode, use the Query Builder to group your queried logs and spans into higher-level entities such as fields, patterns, and transactions in order to derive or consolidate information.
You can query individual entries to inspect a specific event in detail, or query groups of data to aggregate and analyze patterns at scale.
Use tabs to run queries in parallel and compare results across different filters or services.
See aggregated results with the Overview tab
The Overview tab presents your query's results as a sortable, aggregated view — top contributors, distributions, and bar or pie visualizations — alongside the other result tabs available for your dataset. Adding a Grouped by or Aggregation clause auto-switches you to Overview, and the Order by and Limit chips in the Query Builder apply only to that tab.
See Overview tab for logs or Overview tab for spans for the dataset-specific behavior.
Drill down to investigate further
Once you have your results, drill down further into logs grouped by a specific field or a specific log in the Log details panel.
Or, select any trace or span to access the span drilldown.
Execute advanced queries with DataPrime
Coralogix's custom DataPrime query language uses a pipeline syntax to filter, transform, and aggregate log data. Emphasizing flexibility and precision, it allows users to write complex queries, view raw and aggregated results, and visualize data – all within one unified workspace.
Switch the query syntax to DataPrime to write a DataPrime query without leaving the current Explore view.
Manage views and queries
Save your Explore view or specific query to reuse it later. Investigate without opening multiple browser windows or rebuilding queries.
- Use tabs to explore multiple scenarios in parallel during an active investigation.
- Use saved views to preserve a complete screen configuration, including filters, layout, and time range.
- Use saved queries to reuse pure query logic across screens and workflows.
- Use query history to revisit queries you have run recently without re-entering them.
Explore actions
Use the action buttons in the top-right corner — Copy URL, Create alert, Save to dashboard, Reset, and Save view — to manage your current investigation, share queries, or easily create alerts. See Explore actions for details on each action.
Additional resources
| Blog | The new Explore: faster answers, less friction, and a better way to investigate your data |
| Product page | Coralogix Explore |
Next steps
Learn how to select the right data source for your query in Select a data source.