Threshold alerts
A metric threshold alert triggers when a PromQL query crosses a value you define and holds that breach for a duration you define. Use this type to catch sustained problems, such as CPU climbing above a limit, error rates rising, or a queue staying backed up, rather than reacting to a single sample.
What you need
- Access to Coralogix with permission to create alerts
- Metrics ingesting into Coralogix, from sources such as Prometheus and CloudWatch, or metrics extracted from logs with Events2Metrics
- A PromQL query that returns the values you want to evaluate
Create the alert
Go to Alerts, then select Create alert. The alert creation wizard opens on the Query step.
Query step
In the wizard, select the Threshold alert type, then define the metric signal.
- Switch between Builder and Query to construct a PromQL expression. Builder lets you select metrics, filters, and functions without writing raw PromQL; Query mode shows the generated expression for direct editing.
- Group by metric labels with the
byaggregation operator to evaluate and notify per label combination, for examplesum by(instance) (node_filesystem_size_bytes).
A result preview appears as you build. It evaluates the full alert definition over the last 24 hours, highlights the time frames that would have triggered, and respects the duration requirement you set in the Condition step. When the query returns more than 20 series, the preview shows a sample of up to 20 permutations: narrow the grouping or add filters to evaluate a specific one.
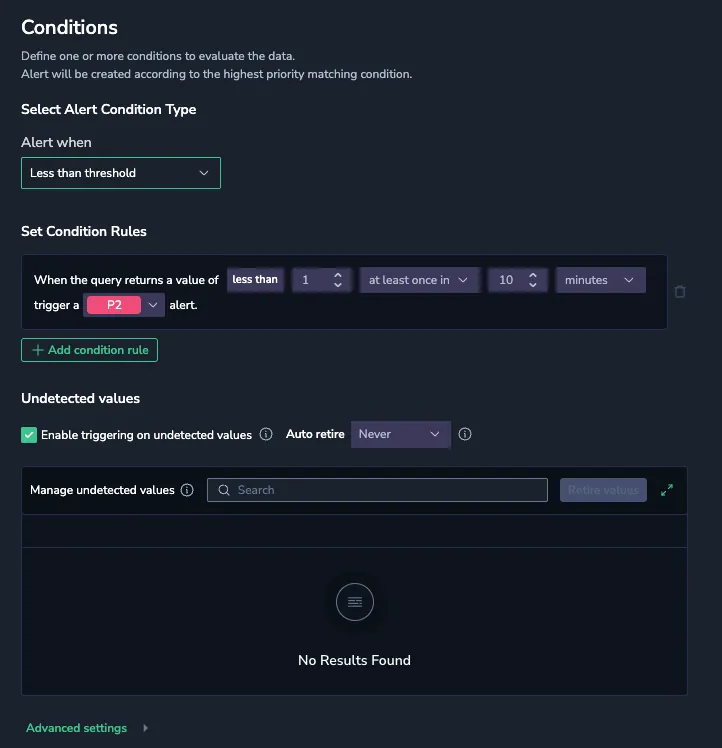
Condition step
The Condition step turns the query into a rule: which operator, what value, and how long the breach must hold.
Select the operator and threshold
In Alert when, select one of the following:
- Less than threshold
- Less than or equals threshold
- More than threshold
- More than or equals threshold
- More than usual (dynamic alert)
- Less than usual (dynamic alert)
Dynamic alerts use behavior-based baselines. All other operators evaluate against the static value you enter. You can add more than one condition rule for tiered severity from a single query; the highest-priority rule that evaluates true wins.
Set the duration
The duration controls how long the threshold must hold within the selected timeframe before the alert triggers.
- for at least: the threshold must stay true for the entire timeframe with no interruptions. For example,
more than 1 for at least 5 minutesrequires the metric to stay above 1 continuously for all 5 minutes. - at least once in: the threshold must be met at least once in the timeframe. For example,
at least once in 10 minutestriggers if the metric crosses the threshold a single time in that window. - for over x%: the threshold must hold for more than a set percentage of the timeframe. For example,
for over 10% of 10 minutesrequires more than 1 minute above the threshold. At 0% a single crossing triggers; at 100% every value in the window must meet the threshold.
The timeframe accepts a custom duration, not only the preset values, so you can match the time window to your metric's resolution and how quickly you need to detect a change.
Handle missing data
When a query returns no data, for example because a metric stops reporting, a resource is removed, or ingestion lags, configure the state the alert holds. In Advanced settings, set When there is no data:
| Option | Behavior |
|---|---|
| Set OK | The alert resolves when no data is received. Use for expected gaps such as ephemeral jobs or scaling events. |
| Set alerting | The alert triggers when the metric stops reporting. Use to detect stopped services or missing components. |
| Keep last state | The alert holds its previous state until data resumes. Use to ride out brief ingestion delays. |
| Set no data state | The alert enters a dedicated no-data state, distinct from healthy or unhealthy. |
Enable Auto retire to stop tracking a missing series after a defined period, so resources that no longer exist do not trigger repeated evaluations.
For a Less than operator, an Undetected values section also appears. A label permutation that stops sending data can otherwise trigger the alert for every timeframe it stays absent. Use these controls to enable or disable triggering on undetected values and to auto-retire them after a selected period.
Managing alerts as code? In alert manifests (Coralogix Operator or Terraform), When there is no data maps to noDataPolicy (query level), and Undetected values maps to undetectedValuesManagement (series level, for Less than). Set the field that matches your alert schema version; using a field that does not belong to the version you are managing can cause validation errors.
You can also delay evaluation by a fixed number of seconds in Advanced settings to absorb late-arriving data. See Custom evaluation delay for when this matters.
Set routing and naming
Set routing and naming in the alert creation wizard Notification and Details steps.
When everything is in place, select Create alert. The alert becomes active within 15 minutes.
Limitations
- New and edited alerts can take up to 15 minutes to become active.
- The number of group by permutations is limited to 1000; only the first 1000 are tracked when more exist.
- Coralogix is deprecating Lucene-based metric alerts and converts them automatically to PromQL as part of the transition from Logs2Metrics to Events2Metrics.
Related resources
Next steps
Set up latency and service-based alerting for traces in Tracing alerts.