Java
This tutorial demonstrates how to instrument your Java applications to capture OpenTelemetry traces and send them to Coralogix.
OpenTelemetry-Java automatic instrumentation is the most efficient method for adding instrumentation to Java applications. Requiring minimal modifications to the code, it uses a Java agent that can be attached to any Java 8+ application and dynamically injects bytecode to capture telemetry from several popular libraries and frameworks.
With the OpenTelemetry Java agent attached, the same setup can also report JVM runtime metrics — heap, garbage collection, threads, CPU, and class loading. See Send JVM metrics to enable the metrics exporter, then view the data in the Runtime metrics tab in Service Catalog.
Installation
The instructions below conform to the latest OpenTelemetry Java Auto Instrumentation, currently Java agent version 1.22.1.
STEP 1. Download and distribute the agent JAR.
-
Download the latest OpenTelemetry Java agent.
-
Apply the agent to each service host or container that requires access to it.
-
The JVM will require access to the agent to function properly.
STEP 2. Update the JVM configuration.
Either of the following options may be used as the template, with the following changes:
-
JAVA_TOOL_OPTIONS: Replace the path to the java agent JAR and thecoralogix-opentelemetryJAR files with the file's location downloaded and distributed in STEP 1 above. -
OTEL_EXPORTER_OTLP_ENDPOINT: Choose the ingress.:443 endpoint that corresponds to your Coralogix domain using the domain selector at the top of the page. -
OTEL_RESOURCE_ATTRIBUTES: Specify your Service.Name. -
OTEL_RESOURCE_ATTRIBUTES: Specify Your Coralogix Send-Your-Data API key, application, and subsystem name. -
Specify 4 RESOURCE_ATTRIBUTES for application and subsystem:
-
application.name: Replace with the name used for the identification of your Coralogix application name -
api.name: Replace with the name used for the identification of your Coralogix subsystem name -
cx.application.name: Replace with the name used for the identification of your Coralogix application name -
cx.subsystem.name: Replace with the name used for the identification of your Coralogix subsystem name
-
Option 1 (recommended): Leveraging environment variables
- Pass the Configuration parameters as system properties environment variables in the JVM:
export JAVA_TOOL_OPTIONS="-javaagent:path/to/opentelemetry-javaagent.jar —Dotel.javaagent.extensions=build/libs/opentelemetry-java-instrumentation-extension-demo-1.0-all.jar"

export OTEL_TRACES_EXPORTER="otlp"
export OTEL_METRICS_EXPORTER="none"
export OTEL_LOGS_EXPORTER="none"
export OTEL_EXPORTER_OTLP_TRACES_PROTOCOL="grpc"
export OTEL_EXPORTER_OTLP_ENDPOINT="ingress.eu2.coralogix.com:443"
export OTEL_EXPORTER_OTLP_HEADERS="Authorization=Bearer <CXPrivateKey>"
export OTEL_RESOURCE_ATTRIBUTES=service.name=<ServiceName>,application.name=<CXApplicationName>,api.name=<CXSubsystemName>,cx.application.name=<CXApplicationName>,cx.subsystem.name=<CXSubsystemName>

java -javaagent:</path/to/>opentelemetry-javaagent.jar -jar myapp.jar
- View the full range of configuration options here.
Option 2: Changing the Java command line
- Enable the instrumentation agent using the
-javaagentflag to the JVM and pass the Configuration parameters as Java system properties (-Dflags):
java -javaagent:path/to/opentelemetry-javaagent.jar \
	—Dotel.javaagent.extensions=build/libs/opentelemetry-java-instrumentation-extension-demo-1.0-all.jar" \
    -Dotel.traces.exporter=otlp \
    -Dotel.metrics.exporter=none \
    -Dotel.logs.exporter=none \
    -Dotel.exporter.otlp.traces.protocol=grpc \
    -Dotel.exporter.otlp.traces.endpoint="ingress.eu2.coralogix.com:443" \
    -Dotel.exporter.otlp.traces.headers=Authorization=Bearer "<CXPrivateKey>" \
    -Dotel.resource.attributes=service.name=<ServiceName>,application.name=<CXApplicationName>,api.name=<CXSubsystemName>,cx.application.name=<CXApplicationName>,cx.subsystem.name=<CXSubsystemName> \
    -jar myapp.jar
Troubleshooting
Confirm that the instrumentation was installed by looking for the following log lines in your console:
[otel.javaagent 2023-02-14 10:40:00:811 +0000] [main] INFO io.opentelemetry.javaagent.tooling.VersionLogger - opentelemetry-javaagent - version: 1.21.1
Example
JPetStore 6 is a full web application built on top of MyBatis 3, Spring 5, and Stripes.
STEP 1. Install a version of the Java Development Kit. It will not deploy when using only the Java Runtime Environment.
STEP 2. Download the JDK for your platform.
STEP 3. Clone the jpetstore git repo:
git clone <https://github.com/kazuki43zoo/mybatis-spring-boot-jpetstore.git>
STEP 4. Run the following:
./mvnw clean package -DskipTests=true
STEP 5. Download the OpenTelemetry agent.
STEP 6. Apply the environment variables:
export OTEL_TRACES_EXPORTER="otlp"
export OTEL_EXPORTER_OTLP_TRACES_PROTOCOL="grpc"
export OTEL_EXPORTER_OTLP_ENDPOINT="ingress.eu2.coralogix.com:443"
export OTEL_EXPORTER_OTLP_HEADERS="Authorization=Bearer <CXPrivateKey>"
export OTEL_RESOURCE_ATTRIBUTES=service.name=<ServiceName>,application.name=<CXApplicationName>,api.name=<CXSubsystemName>,cx.application.name=<CXApplicationName>,cx.subsystem.name=<CXSubsystemName>
STEP 7. Run the project with the agent:
java -javaagent:</path/to/>opentelemetry-javaagent.jar -jar mybatis-spring-boot-jpetstore-2.0.0-SNAPSHOT.jar
STEP 8. Navigate to http://localhost:8080/.
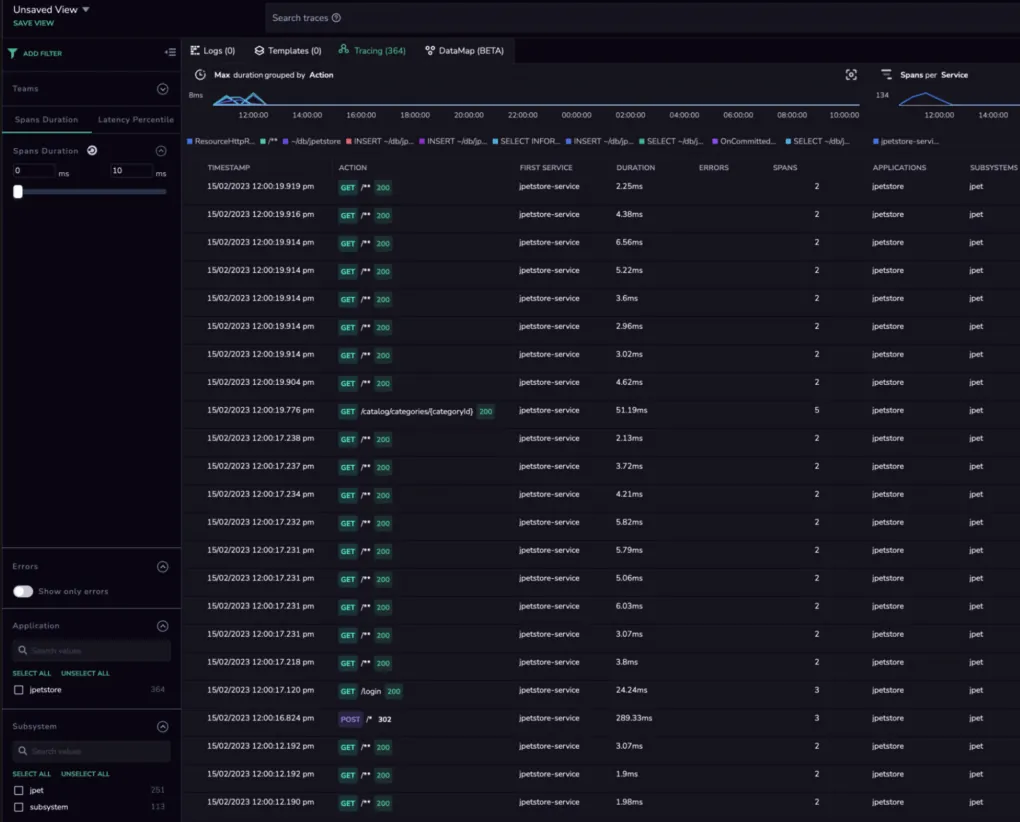
STEP 9. View the traces in your Coralogix dashboard.
Additional instrumentation using annotations
STEP 1. Open the project with your favorite IDE/text editor.
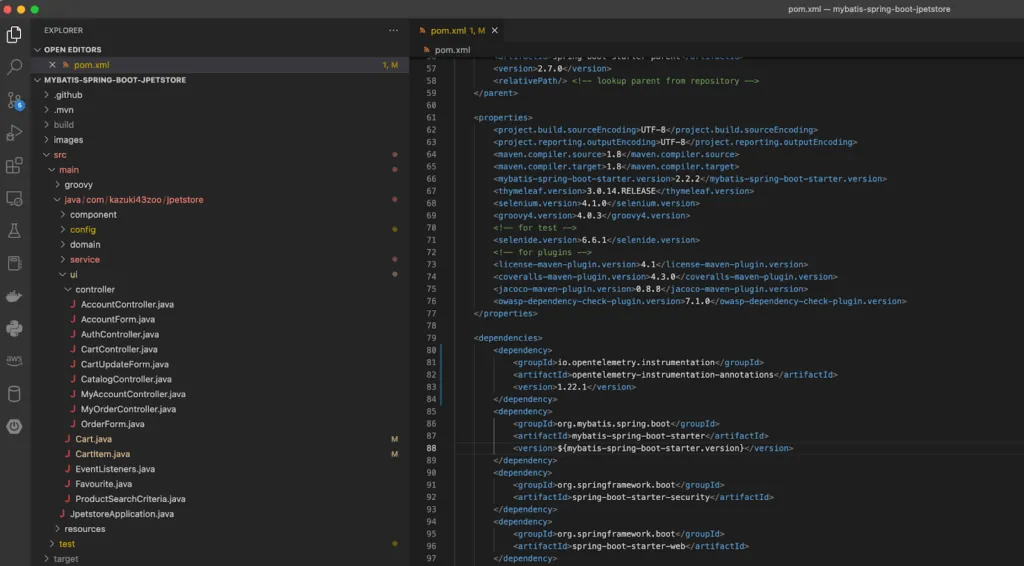
STEP 2. Edit the pom.xml file and add the following maven dependency:
<dependency>
	<groupId>io.opentelemetry.instrumentation</groupId>
	<artifactId>opentelemetry-instrumentation-annotations</artifactId>
	<version>1.22.1</version>
</dependency>
STEP 3. Edit file src/main/java/com/kazuki43zoo/jpetstore/ui/Cart.java.
STEP 4. Add this import to the Java file where the methods you want to trace are present.
import io.opentelemetry.instrumentation.annotations.WithSpan;
STEP 5. Before the function you wish to trace, add the annotation "WithSpan".
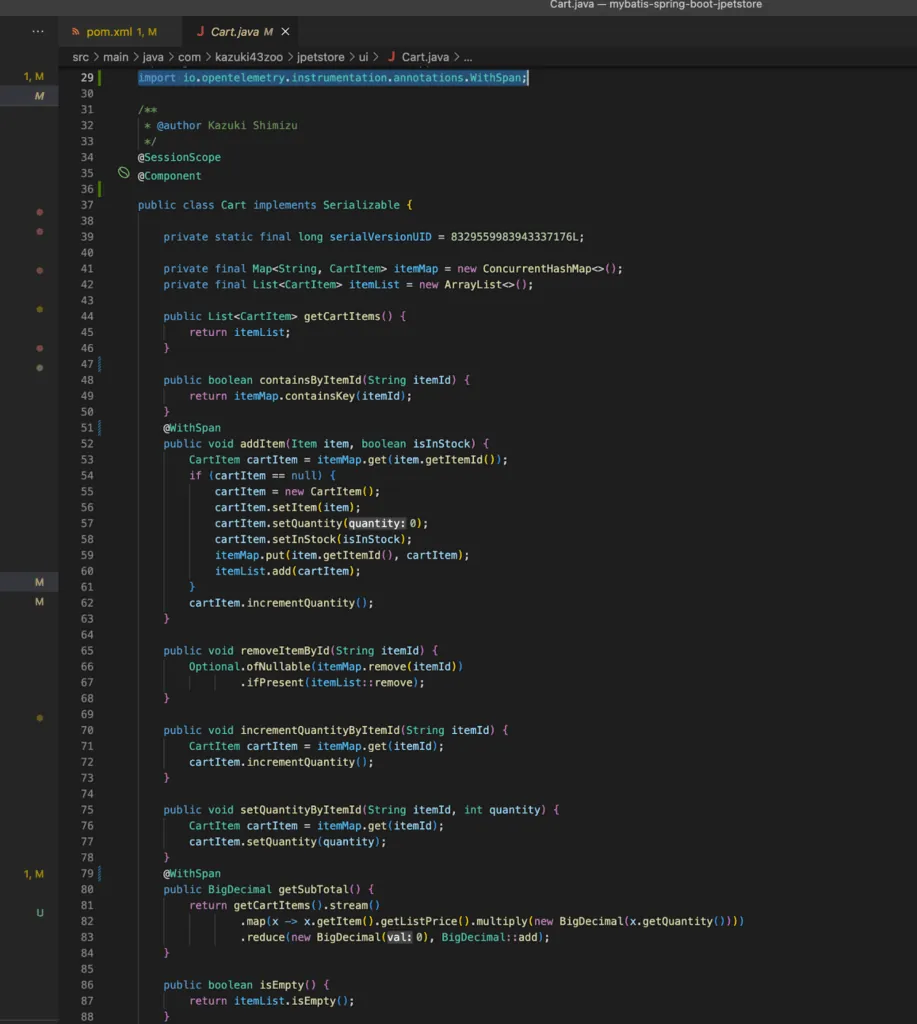
Example: cart.java
STEP 6. Rebuild your springboot application applying the changes (using either your IDE or command line).
STEP 7. Run your application again with the OTel agent:
java -javaagent:</path/to/>opentelemetry-javaagent.jar -jar mybatis-spring-boot-jpetstore-2.0.0-SNAPSHOT
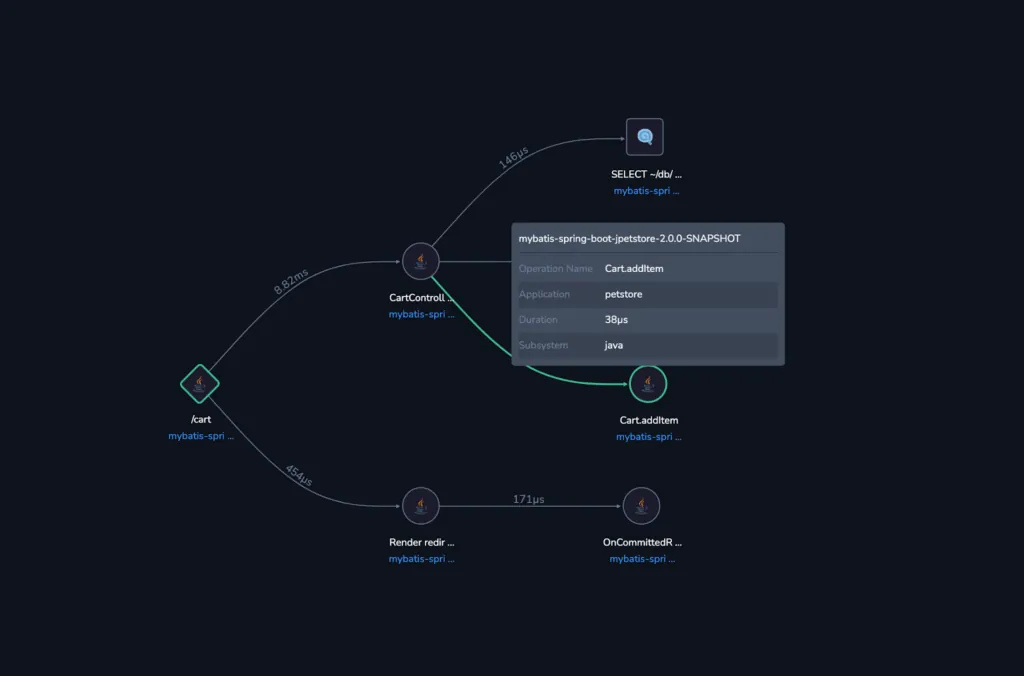
Validation
Access Explore > Tracing to view the traces generated by your application.
Your traces should now contain additional spans on annotated methods.

Exceptions
Java exception logging is available through the OpenTelemetry Logs API and through the Log4j appender instrumentation. When an exception is attached to a log record, the exported log follows the OpenTelemetry semantic conventions for exceptions in logs.
OpenTelemetry Java API
The stable LogRecordBuilder.setException() API is available in io.opentelemetry:opentelemetry-api starting in version 1.60.0. If you are using the incubator logs API, ExtendedLogRecordBuilder.setException() is available starting in 1.50.0-alpha.
STEP 1. Add the required dependencies:
<dependency>
  <groupId>io.opentelemetry</groupId>
  <artifactId>opentelemetry-api</artifactId>
  <version>1.60.0</version>
</dependency>
<dependency>
  <groupId>io.opentelemetry</groupId>
  <artifactId>opentelemetry-sdk</artifactId>
  <version>1.60.0</version>
</dependency>
<dependency>
  <groupId>io.opentelemetry</groupId>
  <artifactId>opentelemetry-sdk-logs</artifactId>
  <version>1.60.0</version>
</dependency>
<dependency>
  <groupId>io.opentelemetry</groupId>
  <artifactId>opentelemetry-exporter-logging</artifactId>
  <version>1.60.0</version>
</dependency>
STEP 2. Configure a LoggerProvider and emit a log with an exception:
import io.opentelemetry.api.OpenTelemetry;
import io.opentelemetry.api.logs.Logger;
import io.opentelemetry.api.logs.Severity;
import io.opentelemetry.exporter.logging.SystemOutLogRecordExporter;
import io.opentelemetry.sdk.OpenTelemetrySdk;
import io.opentelemetry.sdk.logs.SdkLoggerProvider;
import io.opentelemetry.sdk.logs.export.SimpleLogRecordProcessor;

SdkLoggerProvider loggerProvider =
    SdkLoggerProvider.builder()
        .addLogRecordProcessor(
            SimpleLogRecordProcessor.create(SystemOutLogRecordExporter.create()))
        .build();

OpenTelemetry openTelemetry =
    OpenTelemetrySdk.builder().setLoggerProvider(loggerProvider).build();

Logger logger =
    openTelemetry.getLogsBridge().loggerBuilder("java-exceptions-example").build();

IllegalStateException error =
    new IllegalStateException("database connection failed");

logger
    .logRecordBuilder()
    .setSeverity(Severity.ERROR)
    .setBody("request failed")
    .setException(error)
    .emit();
Log4j 2
The io.opentelemetry.instrumentation:opentelemetry-log4j-appender-2.17 artifact supports Log4j 2.17 and higher and is published as an alpha artifact. Exception mapping is available in this artifact starting in 1.14.0-alpha.
STEP 1. Add the required dependencies:
<dependency>
  <groupId>io.opentelemetry</groupId>
  <artifactId>opentelemetry-sdk</artifactId>
  <version>1.60.0</version>
</dependency>
<dependency>
  <groupId>io.opentelemetry</groupId>
  <artifactId>opentelemetry-sdk-logs</artifactId>
  <version>1.60.0</version>
</dependency>
<dependency>
  <groupId>io.opentelemetry</groupId>
  <artifactId>opentelemetry-exporter-logging</artifactId>
  <version>1.60.0</version>
</dependency>
<dependency>
  <groupId>io.opentelemetry.instrumentation</groupId>
  <artifactId>opentelemetry-log4j-appender-2.17</artifactId>
  <version>2.26.1-alpha</version>
</dependency>
STEP 2. Configure the Log4j appender in log4j2.xml:
<?xml version="1.0" encoding="UTF-8"?>
<Configuration status="WARN">
  <Appenders>
    <OpenTelemetry name="OpenTelemetryAppender"/>
  </Appenders>
  <Loggers>
    <Root level="all">
      <AppenderRef ref="OpenTelemetryAppender"/>
    </Root>
  </Loggers>
</Configuration>
STEP 3. Install the appender during application startup:
import io.opentelemetry.exporter.logging.SystemOutLogRecordExporter;
import io.opentelemetry.instrumentation.log4j.appender.v2_17.OpenTelemetryAppender;
import io.opentelemetry.sdk.OpenTelemetrySdk;
import io.opentelemetry.sdk.logs.SdkLoggerProvider;
import io.opentelemetry.sdk.logs.export.SimpleLogRecordProcessor;

SdkLoggerProvider loggerProvider =
    SdkLoggerProvider.builder()
        .addLogRecordProcessor(
            SimpleLogRecordProcessor.create(SystemOutLogRecordExporter.create()))
        .build();

OpenTelemetrySdk openTelemetry =
    OpenTelemetrySdk.builder().setLoggerProvider(loggerProvider).build();

OpenTelemetryAppender.install(openTelemetry);
STEP 4. Log the exception:
import org.apache.logging.log4j.LogManager;
import org.apache.logging.log4j.Logger;

Logger logger = LogManager.getLogger("java-log4j-exceptions-example");
IllegalStateException error =
    new IllegalStateException("database connection failed");

logger.error("request failed", error);
SLF4J with Log4j 2
When SLF4J is configured to use the Log4j 2 backend, the same Log4j appender setup is used. SLF4J to Log4j 2 support is available starting in 1.23.0-alpha.
STEP 1. Add the SLF4J API and the Log4j 2 binding:
<dependency>
  <groupId>org.slf4j</groupId>
  <artifactId>slf4j-api</artifactId>
  <version>2.0.17</version>
</dependency>
<dependency>
  <groupId>org.apache.logging.log4j</groupId>
  <artifactId>log4j-slf4j2-impl</artifactId>
  <version>2.25.2</version>
</dependency>
STEP 2. Reuse the log4j2.xml and OpenTelemetryAppender.install(...) configuration from the Log4j 2 section, and log the exception through SLF4J:
import org.slf4j.Logger;
import org.slf4j.LoggerFactory;

Logger logger = LoggerFactory.getLogger("java-slf4j-exceptions-example");
IllegalStateException error =
    new IllegalStateException("database connection failed");

logger.error("request failed", error);