Lambda
Coralogix offers coralogix-*-wrapper-and-exporter-* Lambda layers enable you to generate logs, metrics, and traces, providing insights into triggers, invocation times, and interconnections. These features work out-of-the-box, without requiring any modification of the monitored Lambda functions' code. Once the configuration is complete, view your data using our cutting-edge Serverless Monitoring feature.
-
This integration is one of two options - complete and basic - for monitoring Lambda, a requirement for enjoying Serverless Monitoring. This tutorial demonstrates how to set up Lambda monitoring to get complete telemetry, including traces.
-
To set up Lambda monitoring to get only basic telemetry, including logs, you are only required to set up the Coralogix AWS Lambda Telemetry Exporter. View the relevant documentation here.
Overview
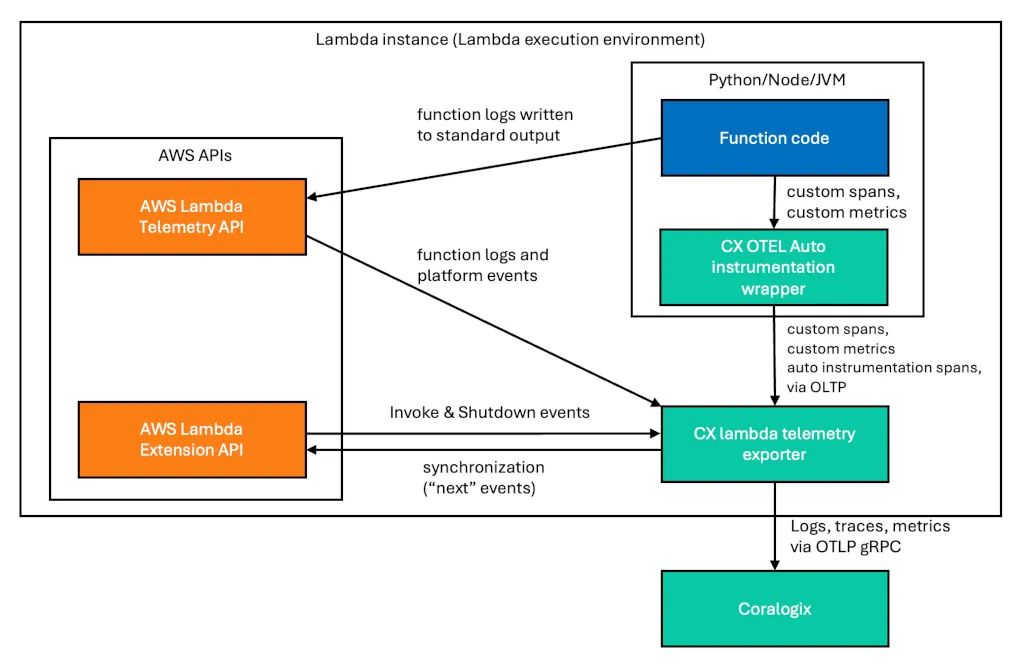
The Lambda instrumentation layers (coralogix-*-wrapper-and-exporter-*) contain modified versions of OpenTelemetry Lambda auto instrumentation wrappers, bundled together with the Coralogix AWS Lambda Telemetry Exporter.
OpenTelemetry Lambda auto instrumentation wrappers instrument the handler function, AWS SDK, and other client libraries to produce traces out-of-the-box. They also provide a configured Otel SDK through which the function code can produce custom spans and metrics.
The telemetry produced by the auto instrumentation wrapper is forwarded to the Coralogix AWS Lambda Telemetry Exporter, which supplements it with information obtained from the Lambda Telemetry API and sends it all to Coralogix.
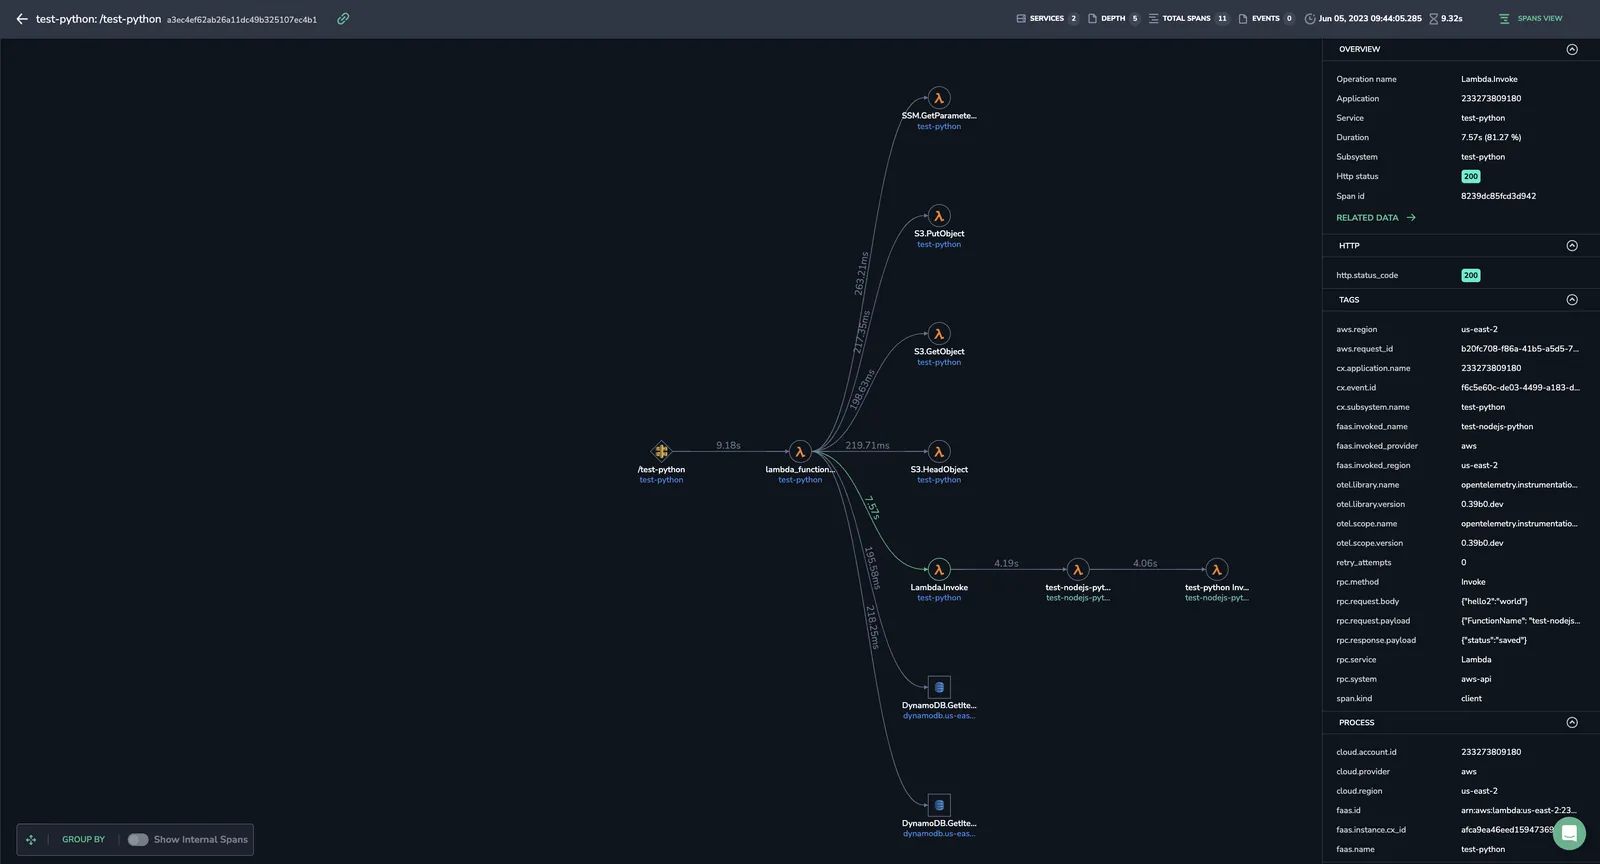
Once fully set up, the auto instrumentation will produce traces, as shown below. The traces will help you discover:
-
What invoked/triggered the lambda function
-
What Lambda functions and other AWS services were called by the function
-
How long did different parts of the invocation take
Differences compared to upstream OpenTelemetry Lambda instrumentation
- Coralogix instrumentation captures request and response payloads and puts them under
rpc.request.payload/rpc.response.payloadspan attributes. By default the length of the captured payload is limited to ~50kB. That number can be adjusted withOTEL_PAYLOAD_SIZE_LIMIT. SettingOTEL_PAYLOAD_SIZE_LIMIT=0effectively disables this feature. - Coralogix instrumentation creates an extra "trigger" span as a parent of the invocation/handler span which indicates what triggered the lambda function.
- Coralogix instrumentation extracts trace context from incoming invocations/messages and injects trace context into downstream calls. This results in coherent traces spanning multiple functions, or a set of linked traces (in case of batched messaging).
- Coralogix instrumentation preconfigures traces and metrics exporter, which makes it easy for users to define custom metrics and spans. (The support for this varies between languages and versions of the upstream OTLP auto instrumentation)
- Coralogix instrumentation doesn't export traces/metrics periodically. It only does it at the end of an invocation.
- Coralogix instrumentation sends extra copies of spans at the beginning of an invocation (we call this the Early Spans feature) which improves traces in case of timeouts and crashes.
- Coralogix node.js instrumentation has a custom way of instrumenting the handler function which works with both CommonJS and ES modules.
- Coralogix node.js instrumentation supports extra env variables with which instrumentation libraries can be enabled/disabled.
- Coralogix node.js instrumentation warms-up OTEL exporter during initialization to improve cold invocation performance.
Supported features & Limitations
Supported triggers
The instrumentation will generate a trigger spans corresponding to those triggers.
| trigger | python | node.js | java |
|---|---|---|---|
| Api Gateway Rest (V1) | ✅ | ✅ | ✅ |
| Api Gateway HTTP (V2) | ✅ | ✅ | ✅ |
| S3 | ✅ | ✅ | ✅ |
| SQS | ✅ | ✅ | ✅ |
| Dynamo DB | ✅ | ✅ | ✅ |
| Cognito | ✅ | ✅ | ✅ |
| EventBridge | ✅ | ✅ | ✅ |
| SNS | ✅ | ✅ | ✅ |
| Kinesis | ✅ | ✅ | ✅ |
| Step functions | ✅ | ✅ | ✅ |
Step functions support
To enable Step Functions instrumentation, you need to add the following payload configuration to your Step Functions task:
"Payload": {
    "executionContext.$": "$$.Execution",
    "stateContext.$": "$$.State",
    "stateMachineContext.$": "$$.StateMachine"
    ...
}
This configuration ensures that the Step Functions context is properly passed to the downstream component, allowing the instrumentation to work correctly.
Supported trace propagation scenarios
The instrumentation will propagate trace context via the request/message, so that both ends of the communication will either become visible in Coralogix as one trace or two linked traces.
| scenario | python | node.js | java |
|---|---|---|---|
| Lambda invoking Lambda via AWS SDK | ✅ | ✅ | ✅ |
| SQS | ✅ | ✅ | ✅ |
| SNS | ✅ | - | - |
| EventBridge with JSON payload | ✅ | ✅ | - |
| Kinesis with JSON payload | ✅ | - | - |
Included OTEL instrumentation libraries
Python (v0.63.0): instrumentation-aiohttp-client, util-http, instrumentation-asgi, instrumentation-boto, instrumentation-asyncpg, instrumentation-celery, instrumentation-dbapi, instrumentation-django, instrumentation-elasticsearch, instrumentation-fastapi, instrumentation-falcon, instrumentation-flask, instrumentation-grpc, instrumentation-jinja2, instrumentation-mysql, instrumentation-psycopg2, instrumentation-pymemcache, instrumentation-pymongo, instrumentation-pymysql, instrumentation-pyramid, instrumentation-redis, instrumentation-requests, instrumentation-sqlalchemy, instrumentation-sqlite3, instrumentation-starlette, instrumentation-tornado, instrumentation-wsgi
Node.js : instrumentation-dns (v0.59.0), instrumentation-express (v0.64.0), instrumentation-graphql (v0.64.0), instrumentation-grpc (v0.216.0), instrumentation-hapi (v0.62.0), instrumentation-http (v0.216.0), instrumentation-ioredis (v0.64.0), instrumentation-koa (v0.64.0), instrumentation-mongodb (v0.73.0), instrumentation-mysql (v0.62.0), instrumentation-net (v0.60.0), instrumentation-pg (v0.68.0), instrumentation-redis (v0.64.0), instrumentation-aws-sdk (v0.75.0)
Java (SDK version 2.28.0): aws-lambda-events, aws-sdk
Recommendations
Python
When using AWS Lambda with the Serverless framework, your Python dependency layer should be last, ensuring that AWS Lambda provides your application dependencies instead of the wrapper's. Not doing so might cause application crashes with [ERROR] AttributeError: partially initialized module 'charset_normalizer' due to collisions between the Python wrapper and application dependencies.
Node.js
Node.js auto instrumentation can't instrument code that has been moved or renamed by webpack. It will still instrument the handler function.
Using esbuild with OpenTelemetry instrumentation
When using esbuild to bundle your Lambda functions, you need to use the OpenTelemetry esbuild plugin to ensure proper instrumentation. This approach allows you to bundle your code while maintaining full tracing capabilities.
Package configuration
Add the following dependencies to your package.json:
{
"devDependencies": {
"opentelemetry-esbuild-plugin-node": "4.3.0",
"@opentelemetry/auto-instrumentations-node": "0.78.0"
},
"overrides": {
}
}
Important: The overrides section is crucial as it replaces the standard OpenTelemetry instrumentation libraries with Coralogix-enhanced versions that provide additional features like payload capture and enhanced trace context propagation.
Build script configuration
Create a build.js file with the following configuration:
const path = require('path');
const { openTelemetryPlugin } = require('opentelemetry-esbuild-plugin-node');
const esbuild = require('esbuild');
const { getNodeAutoInstrumentations } = require('@opentelemetry/auto-instrumentations-node');

// ...

esbuild
  .build({
    // ...
    format: 'cjs',
    plugins: [
      openTelemetryPlugin({
        instrumentations: getNodeAutoInstrumentations()
      }),
    ],
  })
  .catch((error) => {
    console.error('esbuild failed', error);
    process.exit(1);
  });
The key elements in this configuration are:
- openTelemetryPlugin: Integrates OpenTelemetry instrumentation into the esbuild bundling process
- getNodeAutoInstrumentations(): Enables automatic instrumentation for common Node.js libraries (HTTP, AWS SDK, databases, etc.)
- format: 'cjs': Use CommonJS format for Lambda compatibility
- sourcemap: true: Enables source maps for better debugging
After building with this configuration, deploy the bundled function with the Coralogix Lambda layer as described in the installation sections above.
Java
Java auto-instrumentation adds significant overhead during cold invocations. In order to maintain reasonable latencies we strongly recommend configuring Java functions with:
- at least 1024MB of memory
JAVA_TOOL_OPTIONS=-XX:+TieredCompilation -XX:TieredStopAtLevel=1(as suggested by AWS documentation)
Set up Lambda Monitoring
Follow these steps in order to monitor AWS Lambda functions with Coralogix.
STEP 1. Set up the Coralogix AWS resource metadata collection.
STEP 2. Set up the OpenTelemetry Lambda auto instrumentation, as described in this tutorial. This is available for Node.js, Python, and Java. For other runtimes, opt for the Coralogix AWS Lambda Telemetry Exporter setup to view basic telemetry.
Amazon Resource Name
To deploy or update the Coralogix OpenTelemetry wrapper, select the Amazon Resource Name (ARN) corresponding to your AWS region, Lambda runtime and Architecture from the following lists.
Python x86_64
arn:aws:lambda:ap-south-1:625240141681:layer:coralogix-python-wrapper-and-exporter-x86_64:32
arn:aws:lambda:eu-north-1:625240141681:layer:coralogix-python-wrapper-and-exporter-x86_64:32
arn:aws:lambda:eu-west-3:625240141681:layer:coralogix-python-wrapper-and-exporter-x86_64:32
arn:aws:lambda:eu-west-2:625240141681:layer:coralogix-python-wrapper-and-exporter-x86_64:32
arn:aws:lambda:eu-west-1:625240141681:layer:coralogix-python-wrapper-and-exporter-x86_64:32
arn:aws:lambda:ap-northeast-3:625240141681:layer:coralogix-python-wrapper-and-exporter-x86_64:32
arn:aws:lambda:ap-northeast-2:625240141681:layer:coralogix-python-wrapper-and-exporter-x86_64:32
arn:aws:lambda:ap-northeast-1:625240141681:layer:coralogix-python-wrapper-and-exporter-x86_64:32
arn:aws:lambda:ca-central-1:625240141681:layer:coralogix-python-wrapper-and-exporter-x86_64:32
arn:aws:lambda:sa-east-1:625240141681:layer:coralogix-python-wrapper-and-exporter-x86_64:32
arn:aws:lambda:ap-southeast-1:625240141681:layer:coralogix-python-wrapper-and-exporter-x86_64:32
arn:aws:lambda:ap-southeast-2:625240141681:layer:coralogix-python-wrapper-and-exporter-x86_64:32
arn:aws:lambda:eu-central-1:625240141681:layer:coralogix-python-wrapper-and-exporter-x86_64:32
arn:aws:lambda:us-east-1:625240141681:layer:coralogix-python-wrapper-and-exporter-x86_64:32
arn:aws:lambda:us-east-2:625240141681:layer:coralogix-python-wrapper-and-exporter-x86_64:32
arn:aws:lambda:us-west-1:625240141681:layer:coralogix-python-wrapper-and-exporter-x86_64:32
arn:aws:lambda:us-west-2:625240141681:layer:coralogix-python-wrapper-and-exporter-x86_64:32
arn:aws:lambda:af-south-1:625240141681:layer:coralogix-python-wrapper-and-exporter-x86_64:32
arn:aws:lambda:ap-east-1:625240141681:layer:coralogix-python-wrapper-and-exporter-x86_64:32
arn:aws:lambda:ap-southeast-3:625240141681:layer:coralogix-python-wrapper-and-exporter-x86_64:32
arn:aws:lambda:eu-south-1:625240141681:layer:coralogix-python-wrapper-and-exporter-x86_64:32
arn:aws:lambda:me-south-1:625240141681:layer:coralogix-python-wrapper-and-exporter-x86_64:32
arn:aws:lambda:ap-south-2:625240141681:layer:coralogix-python-wrapper-and-exporter-x86_64:32
arn:aws:lambda:ap-southeast-4:625240141681:layer:coralogix-python-wrapper-and-exporter-x86_64:32
arn:aws:lambda:eu-central-2:625240141681:layer:coralogix-python-wrapper-and-exporter-x86_64:32
arn:aws:lambda:eu-south-2:625240141681:layer:coralogix-python-wrapper-and-exporter-x86_64:32
arn:aws:lambda:me-central-1:625240141681:layer:coralogix-python-wrapper-and-exporter-x86_64:32
arn:aws:lambda:il-central-1:625240141681:layer:coralogix-python-wrapper-and-exporter-x86_64:32
arn:aws:lambda:ca-west-1:625240141681:layer:coralogix-python-wrapper-and-exporter-x86_64:32
arn:aws:lambda:ap-southeast-5:625240141681:layer:coralogix-python-wrapper-and-exporter-x86_64:32
arn:aws:lambda:mx-central-1:625240141681:layer:coralogix-python-wrapper-and-exporter-x86_64:32
arn:aws:lambda:ap-southeast-7:625240141681:layer:coralogix-python-wrapper-and-exporter-x86_64:32
arn:aws:lambda:ap-east-2:625240141681:layer:coralogix-python-wrapper-and-exporter-x86_64:32
arn:aws:lambda:ap-southeast-6:625240141681:layer:coralogix-python-wrapper-and-exporter-x86_64:32
Python arm64
arn:aws:lambda:ap-south-1:625240141681:layer:coralogix-python-wrapper-and-exporter-arm64:32
arn:aws:lambda:eu-north-1:625240141681:layer:coralogix-python-wrapper-and-exporter-arm64:32
arn:aws:lambda:eu-west-3:625240141681:layer:coralogix-python-wrapper-and-exporter-arm64:32
arn:aws:lambda:eu-west-2:625240141681:layer:coralogix-python-wrapper-and-exporter-arm64:32
arn:aws:lambda:eu-west-1:625240141681:layer:coralogix-python-wrapper-and-exporter-arm64:32
arn:aws:lambda:ap-northeast-3:625240141681:layer:coralogix-python-wrapper-and-exporter-arm64:32
arn:aws:lambda:ap-northeast-2:625240141681:layer:coralogix-python-wrapper-and-exporter-arm64:32
arn:aws:lambda:ap-northeast-1:625240141681:layer:coralogix-python-wrapper-and-exporter-arm64:32
arn:aws:lambda:ca-central-1:625240141681:layer:coralogix-python-wrapper-and-exporter-arm64:32
arn:aws:lambda:sa-east-1:625240141681:layer:coralogix-python-wrapper-and-exporter-arm64:32
arn:aws:lambda:ap-southeast-1:625240141681:layer:coralogix-python-wrapper-and-exporter-arm64:32
arn:aws:lambda:ap-southeast-2:625240141681:layer:coralogix-python-wrapper-and-exporter-arm64:32
arn:aws:lambda:eu-central-1:625240141681:layer:coralogix-python-wrapper-and-exporter-arm64:32
arn:aws:lambda:us-east-1:625240141681:layer:coralogix-python-wrapper-and-exporter-arm64:32
arn:aws:lambda:us-east-2:625240141681:layer:coralogix-python-wrapper-and-exporter-arm64:32
arn:aws:lambda:us-west-1:625240141681:layer:coralogix-python-wrapper-and-exporter-arm64:32
arn:aws:lambda:us-west-2:625240141681:layer:coralogix-python-wrapper-and-exporter-arm64:32
arn:aws:lambda:af-south-1:625240141681:layer:coralogix-python-wrapper-and-exporter-arm64:32
arn:aws:lambda:ap-east-1:625240141681:layer:coralogix-python-wrapper-and-exporter-arm64:32
arn:aws:lambda:ap-southeast-3:625240141681:layer:coralogix-python-wrapper-and-exporter-arm64:32
arn:aws:lambda:eu-south-1:625240141681:layer:coralogix-python-wrapper-and-exporter-arm64:32
arn:aws:lambda:me-south-1:625240141681:layer:coralogix-python-wrapper-and-exporter-arm64:32
arn:aws:lambda:ap-south-2:625240141681:layer:coralogix-python-wrapper-and-exporter-arm64:32
arn:aws:lambda:ap-southeast-4:625240141681:layer:coralogix-python-wrapper-and-exporter-arm64:32
arn:aws:lambda:eu-central-2:625240141681:layer:coralogix-python-wrapper-and-exporter-arm64:32
arn:aws:lambda:eu-south-2:625240141681:layer:coralogix-python-wrapper-and-exporter-arm64:32
arn:aws:lambda:me-central-1:625240141681:layer:coralogix-python-wrapper-and-exporter-arm64:32
arn:aws:lambda:il-central-1:625240141681:layer:coralogix-python-wrapper-and-exporter-arm64:32
arn:aws:lambda:ca-west-1:625240141681:layer:coralogix-python-wrapper-and-exporter-arm64:32
arn:aws:lambda:ap-southeast-5:625240141681:layer:coralogix-python-wrapper-and-exporter-arm64:32
arn:aws:lambda:mx-central-1:625240141681:layer:coralogix-python-wrapper-and-exporter-arm64:32
arn:aws:lambda:ap-southeast-7:625240141681:layer:coralogix-python-wrapper-and-exporter-arm64:32
arn:aws:lambda:ap-east-2:625240141681:layer:coralogix-python-wrapper-and-exporter-arm64:32
arn:aws:lambda:ap-southeast-6:625240141681:layer:coralogix-python-wrapper-and-exporter-arm64:32
Node.js x86_64
arn:aws:lambda:ap-south-1:625240141681:layer:coralogix-nodejs-wrapper-and-exporter-x86_64:37
arn:aws:lambda:eu-north-1:625240141681:layer:coralogix-nodejs-wrapper-and-exporter-x86_64:37
arn:aws:lambda:eu-west-3:625240141681:layer:coralogix-nodejs-wrapper-and-exporter-x86_64:37
arn:aws:lambda:eu-west-2:625240141681:layer:coralogix-nodejs-wrapper-and-exporter-x86_64:37
arn:aws:lambda:eu-west-1:625240141681:layer:coralogix-nodejs-wrapper-and-exporter-x86_64:37
arn:aws:lambda:ap-northeast-3:625240141681:layer:coralogix-nodejs-wrapper-and-exporter-x86_64:37
arn:aws:lambda:ap-northeast-2:625240141681:layer:coralogix-nodejs-wrapper-and-exporter-x86_64:37
arn:aws:lambda:ap-northeast-1:625240141681:layer:coralogix-nodejs-wrapper-and-exporter-x86_64:37
arn:aws:lambda:ca-central-1:625240141681:layer:coralogix-nodejs-wrapper-and-exporter-x86_64:37
arn:aws:lambda:sa-east-1:625240141681:layer:coralogix-nodejs-wrapper-and-exporter-x86_64:37
arn:aws:lambda:ap-southeast-1:625240141681:layer:coralogix-nodejs-wrapper-and-exporter-x86_64:37
arn:aws:lambda:ap-southeast-2:625240141681:layer:coralogix-nodejs-wrapper-and-exporter-x86_64:37
arn:aws:lambda:eu-central-1:625240141681:layer:coralogix-nodejs-wrapper-and-exporter-x86_64:37
arn:aws:lambda:us-east-1:625240141681:layer:coralogix-nodejs-wrapper-and-exporter-x86_64:37
arn:aws:lambda:us-east-2:625240141681:layer:coralogix-nodejs-wrapper-and-exporter-x86_64:37
arn:aws:lambda:us-west-1:625240141681:layer:coralogix-nodejs-wrapper-and-exporter-x86_64:37
arn:aws:lambda:us-west-2:625240141681:layer:coralogix-nodejs-wrapper-and-exporter-x86_64:37
arn:aws:lambda:af-south-1:625240141681:layer:coralogix-nodejs-wrapper-and-exporter-x86_64:37
arn:aws:lambda:ap-east-1:625240141681:layer:coralogix-nodejs-wrapper-and-exporter-x86_64:37
arn:aws:lambda:ap-southeast-3:625240141681:layer:coralogix-nodejs-wrapper-and-exporter-x86_64:37
arn:aws:lambda:eu-south-1:625240141681:layer:coralogix-nodejs-wrapper-and-exporter-x86_64:37
arn:aws:lambda:ap-south-2:625240141681:layer:coralogix-nodejs-wrapper-and-exporter-x86_64:37
arn:aws:lambda:ap-southeast-4:625240141681:layer:coralogix-nodejs-wrapper-and-exporter-x86_64:37
arn:aws:lambda:eu-central-2:625240141681:layer:coralogix-nodejs-wrapper-and-exporter-x86_64:37
arn:aws:lambda:eu-south-2:625240141681:layer:coralogix-nodejs-wrapper-and-exporter-x86_64:37
arn:aws:lambda:me-central-1:625240141681:layer:coralogix-nodejs-wrapper-and-exporter-x86_64:37
arn:aws:lambda:il-central-1:625240141681:layer:coralogix-nodejs-wrapper-and-exporter-x86_64:37
arn:aws:lambda:ca-west-1:625240141681:layer:coralogix-nodejs-wrapper-and-exporter-x86_64:37
arn:aws:lambda:ap-southeast-5:625240141681:layer:coralogix-nodejs-wrapper-and-exporter-x86_64:37
arn:aws:lambda:mx-central-1:625240141681:layer:coralogix-nodejs-wrapper-and-exporter-x86_64:37
arn:aws:lambda:ap-southeast-7:625240141681:layer:coralogix-nodejs-wrapper-and-exporter-x86_64:37
arn:aws:lambda:ap-east-2:625240141681:layer:coralogix-nodejs-wrapper-and-exporter-x86_64:37
arn:aws:lambda:ap-southeast-6:625240141681:layer:coralogix-nodejs-wrapper-and-exporter-x86_64:37
Node.js arm64
arn:aws:lambda:ap-south-1:625240141681:layer:coralogix-nodejs-wrapper-and-exporter-arm64:37
arn:aws:lambda:eu-north-1:625240141681:layer:coralogix-nodejs-wrapper-and-exporter-arm64:37
arn:aws:lambda:eu-west-3:625240141681:layer:coralogix-nodejs-wrapper-and-exporter-arm64:37
arn:aws:lambda:eu-west-2:625240141681:layer:coralogix-nodejs-wrapper-and-exporter-arm64:37
arn:aws:lambda:eu-west-1:625240141681:layer:coralogix-nodejs-wrapper-and-exporter-arm64:37
arn:aws:lambda:ap-northeast-3:625240141681:layer:coralogix-nodejs-wrapper-and-exporter-arm64:37
arn:aws:lambda:ap-northeast-2:625240141681:layer:coralogix-nodejs-wrapper-and-exporter-arm64:37
arn:aws:lambda:ap-northeast-1:625240141681:layer:coralogix-nodejs-wrapper-and-exporter-arm64:37
arn:aws:lambda:ca-central-1:625240141681:layer:coralogix-nodejs-wrapper-and-exporter-arm64:37
arn:aws:lambda:sa-east-1:625240141681:layer:coralogix-nodejs-wrapper-and-exporter-arm64:37
arn:aws:lambda:ap-southeast-1:625240141681:layer:coralogix-nodejs-wrapper-and-exporter-arm64:37
arn:aws:lambda:ap-southeast-2:625240141681:layer:coralogix-nodejs-wrapper-and-exporter-arm64:37
arn:aws:lambda:eu-central-1:625240141681:layer:coralogix-nodejs-wrapper-and-exporter-arm64:37
arn:aws:lambda:us-east-1:625240141681:layer:coralogix-nodejs-wrapper-and-exporter-arm64:37
arn:aws:lambda:us-east-2:625240141681:layer:coralogix-nodejs-wrapper-and-exporter-arm64:37
arn:aws:lambda:us-west-1:625240141681:layer:coralogix-nodejs-wrapper-and-exporter-arm64:37
arn:aws:lambda:us-west-2:625240141681:layer:coralogix-nodejs-wrapper-and-exporter-arm64:37
arn:aws:lambda:af-south-1:625240141681:layer:coralogix-nodejs-wrapper-and-exporter-arm64:37
arn:aws:lambda:ap-east-1:625240141681:layer:coralogix-nodejs-wrapper-and-exporter-arm64:37
arn:aws:lambda:ap-southeast-3:625240141681:layer:coralogix-nodejs-wrapper-and-exporter-arm64:37
arn:aws:lambda:eu-south-1:625240141681:layer:coralogix-nodejs-wrapper-and-exporter-arm64:37
arn:aws:lambda:ap-south-2:625240141681:layer:coralogix-nodejs-wrapper-and-exporter-arm64:37
arn:aws:lambda:ap-southeast-4:625240141681:layer:coralogix-nodejs-wrapper-and-exporter-arm64:37
arn:aws:lambda:eu-central-2:625240141681:layer:coralogix-nodejs-wrapper-and-exporter-arm64:37
arn:aws:lambda:eu-south-2:625240141681:layer:coralogix-nodejs-wrapper-and-exporter-arm64:37
arn:aws:lambda:me-central-1:625240141681:layer:coralogix-nodejs-wrapper-and-exporter-arm64:37
arn:aws:lambda:il-central-1:625240141681:layer:coralogix-nodejs-wrapper-and-exporter-arm64:37
arn:aws:lambda:ca-west-1:625240141681:layer:coralogix-nodejs-wrapper-and-exporter-arm64:37
arn:aws:lambda:ap-southeast-5:625240141681:layer:coralogix-nodejs-wrapper-and-exporter-arm64:37
arn:aws:lambda:mx-central-1:625240141681:layer:coralogix-nodejs-wrapper-and-exporter-arm64:37
arn:aws:lambda:ap-southeast-7:625240141681:layer:coralogix-nodejs-wrapper-and-exporter-arm64:37
arn:aws:lambda:ap-east-2:625240141681:layer:coralogix-nodejs-wrapper-and-exporter-arm64:37
arn:aws:lambda:ap-southeast-6:625240141681:layer:coralogix-nodejs-wrapper-and-exporter-arm64:37
Java x86_64
arn:aws:lambda:ap-south-1:625240141681:layer:coralogix-java-wrapper-and-exporter-x86_64:18
arn:aws:lambda:eu-north-1:625240141681:layer:coralogix-java-wrapper-and-exporter-x86_64:18
arn:aws:lambda:eu-west-3:625240141681:layer:coralogix-java-wrapper-and-exporter-x86_64:18
arn:aws:lambda:eu-west-2:625240141681:layer:coralogix-java-wrapper-and-exporter-x86_64:18
arn:aws:lambda:eu-west-1:625240141681:layer:coralogix-java-wrapper-and-exporter-x86_64:18
arn:aws:lambda:ap-northeast-3:625240141681:layer:coralogix-java-wrapper-and-exporter-x86_64:18
arn:aws:lambda:ap-northeast-2:625240141681:layer:coralogix-java-wrapper-and-exporter-x86_64:18
arn:aws:lambda:ap-northeast-1:625240141681:layer:coralogix-java-wrapper-and-exporter-x86_64:18
arn:aws:lambda:ca-central-1:625240141681:layer:coralogix-java-wrapper-and-exporter-x86_64:18
arn:aws:lambda:sa-east-1:625240141681:layer:coralogix-java-wrapper-and-exporter-x86_64:18
arn:aws:lambda:ap-southeast-1:625240141681:layer:coralogix-java-wrapper-and-exporter-x86_64:18
arn:aws:lambda:ap-southeast-2:625240141681:layer:coralogix-java-wrapper-and-exporter-x86_64:18
arn:aws:lambda:eu-central-1:625240141681:layer:coralogix-java-wrapper-and-exporter-x86_64:18
arn:aws:lambda:us-east-1:625240141681:layer:coralogix-java-wrapper-and-exporter-x86_64:18
arn:aws:lambda:us-east-2:625240141681:layer:coralogix-java-wrapper-and-exporter-x86_64:18
arn:aws:lambda:us-west-1:625240141681:layer:coralogix-java-wrapper-and-exporter-x86_64:18
arn:aws:lambda:us-west-2:625240141681:layer:coralogix-java-wrapper-and-exporter-x86_64:18
arn:aws:lambda:af-south-1:625240141681:layer:coralogix-java-wrapper-and-exporter-x86_64:18
arn:aws:lambda:ap-east-1:625240141681:layer:coralogix-java-wrapper-and-exporter-x86_64:18
arn:aws:lambda:ap-southeast-3:625240141681:layer:coralogix-java-wrapper-and-exporter-x86_64:18
arn:aws:lambda:eu-south-1:625240141681:layer:coralogix-java-wrapper-and-exporter-x86_64:18
arn:aws:lambda:me-south-1:625240141681:layer:coralogix-java-wrapper-and-exporter-x86_64:18
arn:aws:lambda:ap-south-2:625240141681:layer:coralogix-java-wrapper-and-exporter-x86_64:18
arn:aws:lambda:ap-southeast-4:625240141681:layer:coralogix-java-wrapper-and-exporter-x86_64:18
arn:aws:lambda:eu-central-2:625240141681:layer:coralogix-java-wrapper-and-exporter-x86_64:18
arn:aws:lambda:eu-south-2:625240141681:layer:coralogix-java-wrapper-and-exporter-x86_64:18
arn:aws:lambda:me-central-1:625240141681:layer:coralogix-java-wrapper-and-exporter-x86_64:18
arn:aws:lambda:il-central-1:625240141681:layer:coralogix-java-wrapper-and-exporter-x86_64:18
arn:aws:lambda:ca-west-1:625240141681:layer:coralogix-java-wrapper-and-exporter-x86_64:18
arn:aws:lambda:ap-southeast-5:625240141681:layer:coralogix-java-wrapper-and-exporter-x86_64:18
arn:aws:lambda:mx-central-1:625240141681:layer:coralogix-java-wrapper-and-exporter-x86_64:18
arn:aws:lambda:ap-southeast-7:625240141681:layer:coralogix-java-wrapper-and-exporter-x86_64:18
arn:aws:lambda:ap-east-2:625240141681:layer:coralogix-java-wrapper-and-exporter-x86_64:18
arn:aws:lambda:ap-southeast-6:625240141681:layer:coralogix-java-wrapper-and-exporter-x86_64:18
Java arm64
arn:aws:lambda:ap-south-1:625240141681:layer:coralogix-java-wrapper-and-exporter-arm64:18
arn:aws:lambda:eu-north-1:625240141681:layer:coralogix-java-wrapper-and-exporter-arm64:18
arn:aws:lambda:eu-west-3:625240141681:layer:coralogix-java-wrapper-and-exporter-arm64:18
arn:aws:lambda:eu-west-2:625240141681:layer:coralogix-java-wrapper-and-exporter-arm64:18
arn:aws:lambda:eu-west-1:625240141681:layer:coralogix-java-wrapper-and-exporter-arm64:18
arn:aws:lambda:ap-northeast-3:625240141681:layer:coralogix-java-wrapper-and-exporter-arm64:18
arn:aws:lambda:ap-northeast-2:625240141681:layer:coralogix-java-wrapper-and-exporter-arm64:18
arn:aws:lambda:ap-northeast-1:625240141681:layer:coralogix-java-wrapper-and-exporter-arm64:18
arn:aws:lambda:ca-central-1:625240141681:layer:coralogix-java-wrapper-and-exporter-arm64:18
arn:aws:lambda:sa-east-1:625240141681:layer:coralogix-java-wrapper-and-exporter-arm64:18
arn:aws:lambda:ap-southeast-1:625240141681:layer:coralogix-java-wrapper-and-exporter-arm64:18
arn:aws:lambda:ap-southeast-2:625240141681:layer:coralogix-java-wrapper-and-exporter-arm64:18
arn:aws:lambda:eu-central-1:625240141681:layer:coralogix-java-wrapper-and-exporter-arm64:18
arn:aws:lambda:us-east-1:625240141681:layer:coralogix-java-wrapper-and-exporter-arm64:18
arn:aws:lambda:us-east-2:625240141681:layer:coralogix-java-wrapper-and-exporter-arm64:18
arn:aws:lambda:us-west-1:625240141681:layer:coralogix-java-wrapper-and-exporter-arm64:18
arn:aws:lambda:us-west-2:625240141681:layer:coralogix-java-wrapper-and-exporter-arm64:18
arn:aws:lambda:af-south-1:625240141681:layer:coralogix-java-wrapper-and-exporter-arm64:18
arn:aws:lambda:ap-east-1:625240141681:layer:coralogix-java-wrapper-and-exporter-arm64:18
arn:aws:lambda:ap-southeast-3:625240141681:layer:coralogix-java-wrapper-and-exporter-arm64:18
arn:aws:lambda:eu-south-1:625240141681:layer:coralogix-java-wrapper-and-exporter-arm64:18
arn:aws:lambda:me-south-1:625240141681:layer:coralogix-java-wrapper-and-exporter-arm64:18
arn:aws:lambda:ap-south-2:625240141681:layer:coralogix-java-wrapper-and-exporter-arm64:18
arn:aws:lambda:ap-southeast-4:625240141681:layer:coralogix-java-wrapper-and-exporter-arm64:18
arn:aws:lambda:eu-central-2:625240141681:layer:coralogix-java-wrapper-and-exporter-arm64:18
arn:aws:lambda:eu-south-2:625240141681:layer:coralogix-java-wrapper-and-exporter-arm64:18
arn:aws:lambda:me-central-1:625240141681:layer:coralogix-java-wrapper-and-exporter-arm64:18
arn:aws:lambda:il-central-1:625240141681:layer:coralogix-java-wrapper-and-exporter-arm64:18
arn:aws:lambda:ca-west-1:625240141681:layer:coralogix-java-wrapper-and-exporter-arm64:18
arn:aws:lambda:ap-southeast-5:625240141681:layer:coralogix-java-wrapper-and-exporter-arm64:18
 arn:aws:lambda:mx-central-1:625240141681:layer:coralogix-java-wrapper-and-exporter-arm64:18
arn:aws:lambda:ap-southeast-7:625240141681:layer:coralogix-java-wrapper-and-exporter-arm64:18
arn:aws:lambda:ap-east-2:625240141681:layer:coralogix-java-wrapper-and-exporter-arm64:18
arn:aws:lambda:ap-southeast-6:625240141681:layer:coralogix-java-wrapper-and-exporter-arm64:18
Installation: published layer ARN
In your AWS Management console, navigate to AWS Lambda.
STEP 1. Access the Lambda function that you would like to monitor. Check the list of Layers. If you already have a coralogix-aws-lambda-telemetry-exporter-* layer added, remove it. In the following steps, you will install a coralogix-*-wrapper-and-exporter-* layer that already contains the telemetry exporter.
STEP 2. Access the Lambda function that you would like to monitor. Select Layers > Add a layer.

STEP 3. Specify an ARN by pasting one from the list above > Add
STEP 4. Access the Lambda function that you would like to monitor and configure the environment variables: Configuration > Environment variables
-
Set
AWS_LAMBDA_EXEC_WRAPPER=/opt/otel-handlerto enable the auto-instrumentation wrapper. -
Set
CX_DOMAINto the Coralogix domain within which you've set up your account. For example,us1.coralogix.com(do NOT add protocol, port, team name etc. to the domain). -
Set
CX_API_KEYto the Coralogix Send-Your-Data API key. -
Set
CX_REPORTING_STRATEGY = REPORT_AFTER_INVOCATION- See AWS Lambda Telemetry Exporter documentation to learn more about reporting strategies.
STEP 5. [Optional] Fine-tune the telemetry-exporter to match your preferences. See all available configuration options here.
Installation: container Image Lambda
This instruction applies to container images based on the official AWS Lambda images.
STEP 1. Add the coralogix auto instrumentation to your docker image. See the examples below.
# Python auto-instrumentation (wrapper-and-exporter) based on official AWS Lambda image
FROM coralogixrepo/coralogix-python-wrapper-and-exporter:30 as coralogix
FROM public.ecr.aws/lambda/python:3.12
WORKDIR /opt
COPY /opt/ .
WORKDIR $LAMBDA_TASK_ROOT
COPY app.py ./
# This only works with official AWS Lambda base images
ENV AWS_LAMBDA_EXEC_WRAPPER=/opt/otel-handler
CMD ["app.lambda_handler"]
# Node.js auto-instrumentation (wrapper-and-exporter) based on official AWS Lambda image
FROM coralogixrepo/coralogix-nodejs-wrapper-and-exporter:37 as coralogix
FROM public.ecr.aws/lambda/nodejs:20
WORKDIR /opt
COPY /opt/ .
WORKDIR $LAMBDA_TASK_ROOT
COPY app.js ./
# This only works with official AWS Lambda base images
ENV AWS_LAMBDA_EXEC_WRAPPER=/opt/otel-handler
CMD ["app.lambdaHandler"]
# Java auto-instrumentation (wrapper-and-exporter) based on official AWS Lambda image
FROM coralogixrepo/coralogix-java-wrapper-and-exporter:18 as coralogix
FROM public.ecr.aws/lambda/java:21
WORKDIR /opt
COPY /opt/ .
WORKDIR $LAMBDA_TASK_ROOT
COPY java-simple-all.jar $LAMBDA_TASK_ROOT/lib/
# This only works with official AWS Lambda base images
ENV AWS_LAMBDA_EXEC_WRAPPER=/opt/otel-handler
CMD ["app.App::handleRequest"]
STEP 2. Access the Lambda function that you would like to monitor and configure the environment variables: Configuration > Environment variables
-
Set
CX_DOMAINto the Coralogix domain within which you've set up your account. For exampleus1.coralogix.com(do NOT add protocol, port, team name etc. to the domain) -
Set
CX_API_KEYto the Coralogix Send-Your-Data API key. -
Set
CX_REPORTING_STRATEGY = REPORT_AFTER_INVOCATION(If the function is invoked frequently consider setting it toLOW_OVERHEADinstead. See AWS Lambda Telemetry Exporter to learn more about reporting strategies)
STEP 3. [Optional] Fine-tune the telemetry-exporter to match your preferences. See all available configuration options here.
Validating the results
Assuming you've already configured the Coralogix AWS resource metadata collection, you're ready to take advantage of the Serverless Monitoring feature. Validate that your setup works.
STEP 1. Invoke the function.
STEP 2. Access APM and select the Serverless tab. Select the function of interest.
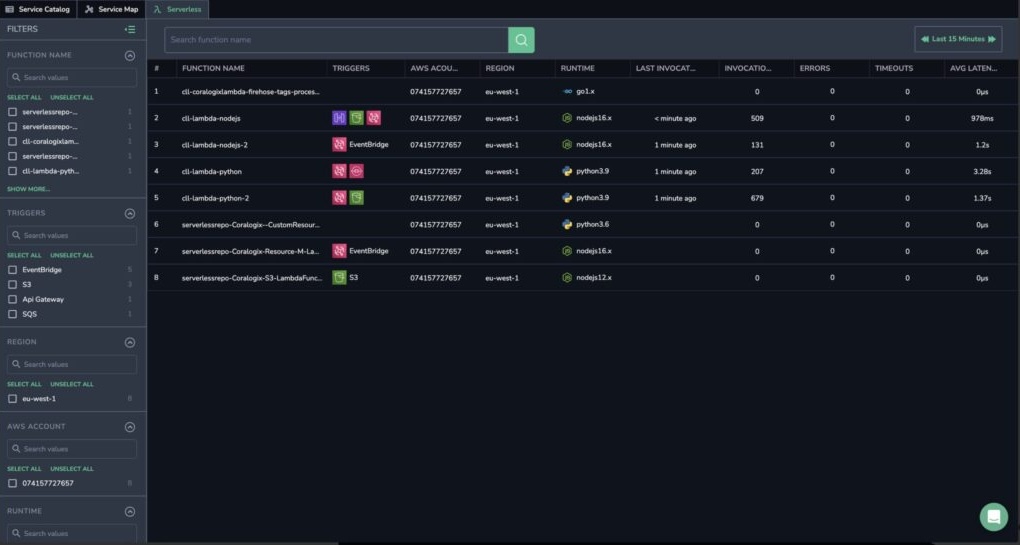
STEP 3. View Lambda invocations in the INVOCATIONS table.
It may take up to 1 minute for your telemetry to fully process.
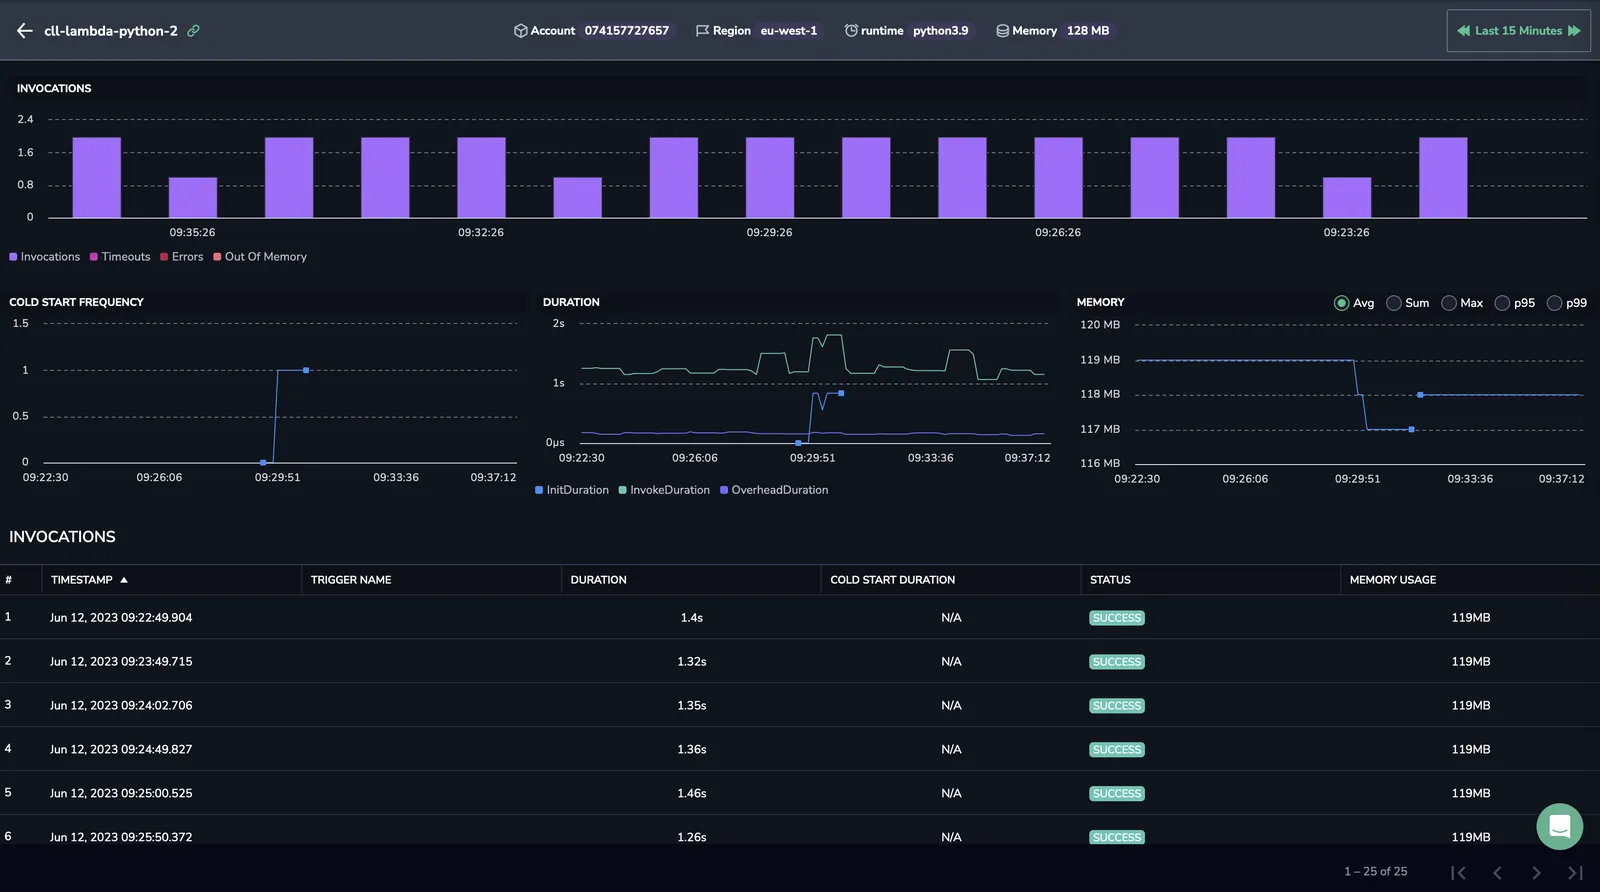
STEP 4. Select an invocation to drill down using our Spans View.

Additional resources
| Documentation | AWS Lambda Telemetry Exporter AWS Resource Metadata Collection Serverless Monitoring |
| GitHub | Node.js wrapper Python wrapper Java wrapper |
Additional resources
Manual Telemetry (Custom Metrics and Traces)
Coralogix’s AWS Lambda layer automatically includes and configures the OpenTelemetry language SDKs. This means you can manually instrument your Lambda functions using the standard OpenTelemetry APIs, without installing any additional packages. No need to install or import your own SDK — just use the standard opentelemetry APIs.
Python
How to create custom spans
from opentelemetry import trace

tracer = trace.get_tracer(__name__)

def lambda_handler(event, context):
    with tracer.start_as_current_span("myspan"):
        # Your business logic here
        print("Inside custom span")

    return {"status": "ok"}
How to create custom metrics
from opentelemetry import metrics

meter = metrics.get_meter(__name__)
counter = meter.create_counter(
    name="my_counter",
    unit="1",
    description="Custom metrics from AWS Lambda"
)

def lambda_handler(event, context):
    counter.add(1, {"function": "my_lambda"})
    return {"status": "ok"}