PHP
This tutorial demonstrates how to instrument PHP applications to capture logs, metrics, and traces using OpenTelemetry and send them to Coralogix. It relies on a Slim micro framework application, but other web frameworks – such as WordPress, Symfony, or Laravel – can also be used.
Instrumentation can be accomplished automatically or manually. Automatic instrumentation is the most efficient way to add instrumentation to PHP applications, injecting bytecode via an agent to capture telemetry. Manual instrumentation involves adding observability code to an app yourself. While this is more labor intensive, it provides the most control over the SDK configuration.
Prerequisites
A Coralogix account, set up on the Coralogix domain corresponding to the region where your data is stored
PHP 8.0+ for auto-instrumentation, and at least PHP 7.4 for manual-instrumentation.
PECL - a repository for PHP Extensions.
Composer - a dependency manager for PHP packages.
Extension and package installation
STEP 1. As the extension needs to be built from source, certain build tools are needed.
STEP 2. Install the OpenTelemetry extension with PECL.
STEP 3. Add the extension to your php.ini file (e.g. /etc/php.in).
STEP 4. Verify that the extension is installed and enabled.
STEP 5. Add the following packages to your application.
composer init \
  --no-interaction \
  --stability beta \
    --require slim/slim:"^4" \
  --require slim/psr7:"^1"
composer config allow-plugins.php-http/discovery false
composer update
Notes:
- If requested to "Do you trust "php-http/discovery" to execute code…", select No.
Send Data to Coralogix
Coralogix provides OTLP endpoints for various regions. Using the gRPC exporter can improve data transmission performance. Install the additional extensions via terminal.
STEP 1. Install gRPC.
Notes:
- Installing gRPC make take several minutes, as the extension builds from source.
STEP 2. Add the following extension to your php.ini file (e.g. /etc/php.in).
Notes:
- gRPC is a code generator for a remote procedure call (RPC) framework.
STEP 3. Install the following packages.
composer require \
  open-telemetry/transport-grpc \
  open-telemetry/exporter-otlp \
  php-http/guzzle7-adapter
Automatic instrumentation
Out of the box, zero-code instrumentation injects an OpenTelemetry PHP agent into the application and generates traces**.**
STEP 1. Install Slim framework’s auto-instrumentation library.
Notes:
open-telemetry/sdkprovides an implementation of the OpenTelemetry API, and can be set up and configured in a number of ways.open-telemetry/opentelemetry-auto-slimis required to auto-instrument the Slim micro framework.
STEP 2. The dependencies should be described in the composer.json file as shown below.
{
    "require": {
        "slim/slim": "^4",
        "slim/psr7": "^1",
                "open-telemetry/transport-grpc": "^1.0",
        "open-telemetry/exporter-otlp": "^1.0",
        "php-http/guzzle7-adapter": "^1.0"
                "open-telemetry/sdk": "^1.0"
                "open-telemetry/opentelemetry-auto-slim": "^1.0@beta",
    },
    "minimum-stability": "beta",
    "config": {
        "allow-plugins": {
            "php-http/discovery": false
        }
    }
}
Notes:
To enable automatic instrumentation of other popular PHP frameworks, you need to install the respective "auto" packages via
composer:Laravel Framework - Contrib Repo
composer require open-telemetry/opentelemetry-auto-laravelSymfony Framework - Contrib Repo
composer require open-telemetry/opentelemetry-auto-symfonyWordpress Framework - Contrib Repo
composer require open-telemetry/opentelemetry-auto-wordpress
For more information about the various PHP library instrumentations, refer to the OpenTelemetry PHP Registry.
STEP 3. Once you have installed the necessary extensions and packages, configure the instrumentation as environment variables to enable it. This follows the OpenTelemetry SDK Environment Variable Specification.
export OTEL_PHP_AUTOLOAD_ENABLED=true
export OTEL_TRACES_EXPORTER=otlp
export OTEL_METRICS_EXPORTER=none
export OTEL_LOGS_EXPORTER=none
export OTEL_EXPORTER_OTLP_PROTOCOL=grpc
export OTEL_EXPORTER_OTLP_ENDPOINT="https://ingress.:443"
export OTEL_EXPORTER_OTLP_HEADERS="Authorization=Bearer <CXPrivateKey>"
export OTEL_RESOURCE_ATTRIBUTES=service.name=<ServiceName>,application.name=<CXApplicationName>,api.name=<CXSubsystemName>,cx.application.name=<CXApplicationName>,cx.subsystem.name=<CXSubsystemName>
OTEL_PHP_AUTOLOAD_ENABLED: For OpenTelemetry PHP, set totrueto enable automatic instrumentation and globally register the SDK.OTEL_TRACES_EXPORTER: As auto-instrumentation currently works on traces only, set the traces exporter tootlpto send it.OTEL_EXPORTER_OTLP_ENDPOINT: Choose the ingress.:443 endpoint that corresponds to your Coralogix domain using the domain selector at the top of the page.OTEL_EXPORTER_OTLP_HEADERS: Input your Coralogix Send-Your-Data API key in the Authorization header for authentication.OTEL_RESOURCE_ATTRIBUTES: Input the names of your application and subsystem. Theservice.nameis used to name your service. These will be added to resource attributes:service.name=<ServiceName>application.name=<CXApplicationName>api.name=<CXSubSystemName>cx.application.name=<CXApplicationName>cx.subsystem.name=<CXSubSystemName>
STEP 4. Run the instrumentation.
The index.php script below is a simple demo of a dice roll. It does not contain any code from the OpenTelemetry SDK.
<?php
use Psr\Http\Message\ResponseInterface as Response;
use Psr\Http\Message\ServerRequestInterface as Request;
use Slim\Factory\AppFactory;

require __DIR__ . '/vendor/autoload.php';

$app = AppFactory::create();

$app->get('/rolldice', function (Request $request, Response $response) {
    $result = random_int(1,6);
    $response->getBody()->write(strval($result));
    return $response;
});

$app->run();
STEP 5. Open a terminal window and run the instrumentation as a web server. Once the server is running, make HTTP calls to the application route using a browser or the curl command-line tool.
STEP 6. Explore your traces in the Coralogix app.
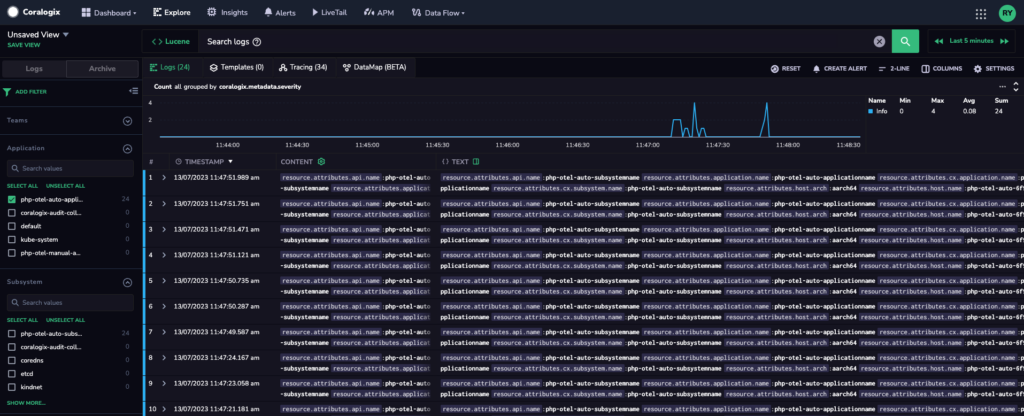
Access Explore > Tracing. You should now see traces generated by your application.
STEP 7. To add logging capabilities, the instrumentation code needs to be configured with a logger such as monolog. To do this, add the required dependencies.
STEP 8. Replace index.php script as follows. The command manually deploys the OpenTelemetry loggerProvider and attaches it to the OpenTelemetry Monolog Handler.
<?php
use Monolog\Logger;
use OpenTelemetry\API\Common\Instrumentation\Globals;
use OpenTelemetry\Contrib\Logs\Monolog\Handler;
use Psr\Http\Message\ResponseInterface as Response;
use Psr\Http\Message\ServerRequestInterface as Request;
use Psr\Log\LogLevel;
use Slim\Factory\AppFactory;

require __DIR__ . '/vendor/autoload.php';

$loggerProvider = Globals::loggerProvider();
$handler = new Handler(
    $loggerProvider,
    LogLevel::INFO
);
$monolog = new Logger('otel-php-monolog', [$handler]);

$app = AppFactory::create();

$app->get('/rolldice', function (Request $request, Response $response) use ($monolog) {
    $result = random_int(1,6);
    $response->getBody()->write(strval($result));
    $monolog->info('dice rolled', ['result' => $result]);
    return $response;
});

$app->run();
STEP 9. To enable traces and logs, configure the environment variables and set the respective telemetry exporters to use the otlp protocol.
export OTEL_PHP_AUTOLOAD_ENABLED=true
export OTEL_TRACES_EXPORTER=otlp
export OTEL_METRICS_EXPORTER=none
export OTEL_LOGS_EXPORTER=otlp
export OTEL_EXPORTER_OTLP_PROTOCOL=grpc
export OTEL_EXPORTER_OTLP_ENDPOINT="https://ingress.:443"
export OTEL_EXPORTER_OTLP_HEADERS="Authorization=Bearer <CXPrivateKey>"
export OTEL_RESOURCE_ATTRIBUTES=service.name=<ServiceName>,application.name=<CXApplicationName>,api.name=<CXSubsystemName>,cx.application.name=<CXApplicationName>,cx.subsystem.name=<CXSubsystemName>
STEP 10. Start the built-in web server and call the "rolldice" route.
STEP 11. To view logs, access Explore > Logs. The generated logs will be displayed.
Manual instrumentation
By adding observability code to an application using the OpenTelemetry PHP SDK, you gain greater control over which telemetry to provision and send. This approach also enables you to integrate OpenTelemetry with popular PHP libraries available in the community repository.
Common configuration
Before creating the respective providers for each type of observability, configure the Instrumentation SDK as environment variables using system export commands or within the PHP code using putenv. Set all observability exporters to none initially until manual instrumentation for each type is completed.
export OTEL_EXPORTER_OTLP_ENDPOINT="ingress.:443"
export OTEL_TRACES_EXPORTER=none
export OTEL_METRICS_EXPORTER=none
export OTEL_LOGS_EXPORTER=none
export OTEL_EXPORTER_OTLP_PROTOCOL=grpc
export OTEL_EXPORTER_OTLP_HEADERS="Authorization=Bearer <CXPrivateKey>"
export OTEL_RESOURCE_ATTRIBUTES=service.name=<ServiceName>,application.name=<CXApplicationName>,api.name=<CXSubsystemName>,cx.application.name=<CXApplicationName>,cx.subsystem.name=<CXSubsystemName>
- Set all traces, metrics and logs (e.g.
OTEL_<OBSERVABILITY>_EXPORTER) tononefirst.
Traces
STEP 1: Set the otlp exporter for traces
STEP 2: Replace the index.php script with the following code. This code manually creates spans with additional information that provides insights to the trace telemetry.
<?php
use OpenTelemetry\SDK\Trace\TracerProviderFactory;
use Psr\Http\Message\ResponseInterface as Response;
use Psr\Http\\Message\ServerRequestInterface as Request;
use Psr\Log\LogLevel;
use Slim\Factory\AppFactory;

require __DIR__ . '/vendor/autoload.php';

//Initialize TraceProvider and Tracer
$tracerFactory = new TracerProviderFactory();
$tracerProvider = $tracerFactory->create();
$tracer = $tracerProvider->getTracer('demo_trace');

$app = AppFactory::create();

$app->get('/rolldice', function (Request $request, Response $response) use ($tracer) {
    //create spans
    $span = $tracer->spanBuilder("roll_event")->startSpan();

    $result = random_int(1,6);
    $response->getBody()->write(strval($result));

    //set attributes and events to span
    $span->setAttribute("dice_roll", $result);
    $span->addEvent('rolled_event', [
        /key:value
                'roll_value' => $result,
    ]);

    //end span to send
    $span->end();
    return $response;
});

$app->run();

//shutdown providers
$tracerProvider->shutdown();
Notes:
The
TracerProviderFactoryclass from the SDK provides a way to create the necessaryTracerProviderby using system environment variables as the default.getTracer()creates instances of$tracerwith a required name (and other attributes) to propagate Context information about the system.You can add information to spans using
setAttributeandaddEventto provide additional details to the trace. Span Attributes store specific operation properties, while Span Events can carry zero or more Span Attributes, which are themselves key:value maps.It is necessary to call
end()at the end of a any code logic to ensure that it gets sent.It is important to call
shutdown()at the end of the instrumentation to allow theTracerProviderto do any necessary cleanup and export telemetry.
STEP 3: To generate traces, run the PHP web-server in the directory. Once the server is running, make HTTP calls to the application route using a browser or the curl command-line tool.
STEP 4: To view the traces generated by your demo rolldice application, go to your Coralogix dashboard and click on Explore > Traces.
Metrics
STEP 1: Set the otlp exporter for metrics.
STEP 2: Replace the index.php script with the following code to add meter and metrics instrument. Instrumenting metrics via the OpenTelemetry SDK.
<?php
use OpenTelemetry\SDK\Metrics\MeterProviderFactory;
use Psr\Http\Message\ResponseInterface as Response;
use Psr\Http\Message\ServerRequestInterface as Request;
use Slim\Factory\AppFactory;

require __DIR__ . '/vendor/autoload.php';

//Initialize Meters
$meterFactory = new MeterProviderFactory();
$meterProvider = $meterFactory->create();
$meter = $meterProvider->getMeter('demo_meter');

//Initialise Histogram
$histogram = $meter->createHistogram('roll', 'num', 'The output of roll result');

$app = AppFactory::create();

$app->get('/rolldice', function (Request $request, Response $response) use ($histogram) {

    $result = random_int(1,6);
    $response->getBody()->write(strval($result));

    //add to the metric counter
    $histogram->record($result);

    return $response;
});

$app->run();

//shutdown providers
$meterProvider->shutdown();
The
MeterProviderFactoryclass in the SDK provides a way to create the necessaryMeterProviderby using system environment variables as the default.Calling
getMeter()creates instances of$meterwith a required name, and other optional attributes such asversionandschema_url, to define the instrumentation scope of emitted telemetry. Meters are identified by these fields, and are considered identical if all identifying fields are equal.To create a histogram instrument, use the
createHistogramfunction. Other types of instruments can also be created; see Meter Operations for details.Use
record()to store data related to the meter instrument.Metrics are exported when either
forceFlush()orshutdown()is called on the meter provider. It is important to callshutdown()at the end of the instrumentation to allow theMeterProviderto do any necessary cleanup and export telemetry.
STEP 3: To generate metrics, run the PHP web-server in the directory. Once the server is running, make HTTP calls to the application route using a browser or the curl command-line tool.
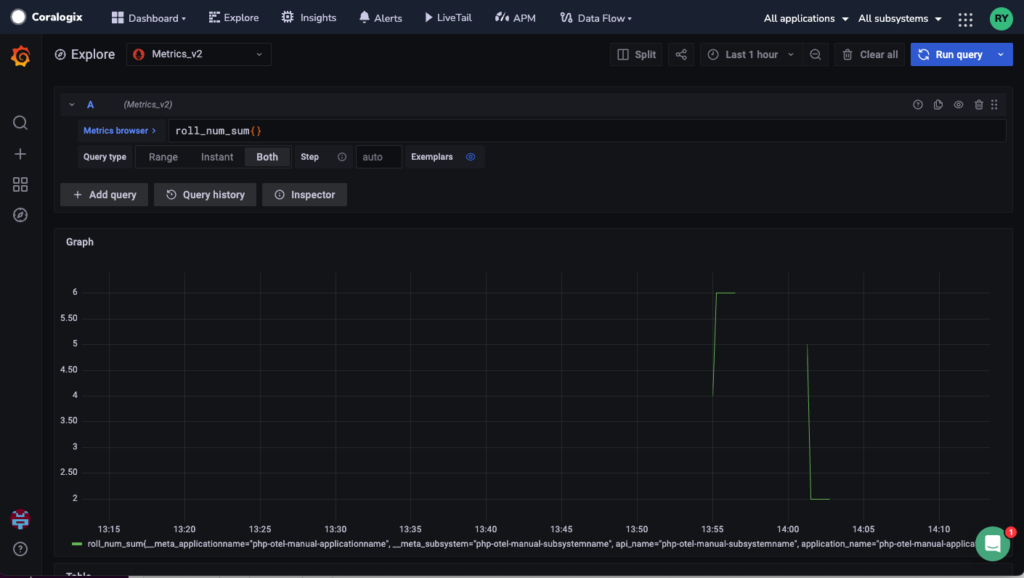
STEP 4: To view the metrics, access the Grafana Dashboard on Coralogix. Click on Explore, then select "roll_num_sum" in the metrics browser. Next, use the roll_num_sum{} or any other relevant "roll_num" metric and click on Run query.
Logs
STEP 1: Set the otlp exporter for logs.
STEP 2: Install the following packages:
As logging is a mature and well-established function, OpenTelemetry's Logger approach is not intended to be used directly but rather to be integrated into existing loggers, such as Monolog.
The Monolog package and OpenTelemetry's logger integration with Monolog are required.
The OpenTelemetry handler, configured with an OpenTelemetry
LoggerProvider, is used to send MonologLogRecords to OpenTelemetry.
STEP 3: Add logs via Monolog:
Replace the index.php script with the following code.
<?php
use Monolog\Logger;
use OpenTelemetry\Contrib\Logs\Monolog\Handler as MonologHandler;
use OpenTelemetry\SDK\Logs\LoggerProviderFactory;

use Psr\Http\Message\ResponseInterface as Response;
use Psr\Http\Message\ServerRequestInterface as Request;
use Psr\Log\LogLevel;
use Slim\Factory\AppFactory;

require __DIR__ . '/vendor/autoload.php';

//Initialize Logger
$loggerFactory = new LoggerProviderFactory();
$loggerProvider = $loggerFactory->create();
$handler = new MonologHandler(
    $loggerProvider,
    LogLevel::DEBUG,
);

//Initialize Monolog
$monolog = new Logger('logger', [$handler]);
$monolog->info('hello world');

$app = AppFactory::create();

$app->get('/rolldice', function (Request $request, Response $response) use ($monolog) {

    $result = random_int(1,6);
    $response->getBody()->write(strval($result));

    //log results
    $monolog->debug('result rolled ' . strval($result));

    return $response;
});

$app->run();

//shutdown providers
$loggerProvider->shutdown();
The
LoggerProviderFactoryclass in the SDK provides a way to create the necessaryLoggerProviderby using system environment variables as the default.Thus
MonologHandleris configured with the OpenTelemetryLoggerProviderto send log records from Monolog to OpenTelemetry by setting as the default handler for$monolog.Send logs at different levels (e.g. debug, info, error) with the
$monologlogger.It is important to call
shutdown()at the end of the instrumentation to allow theLoggerProviderto do any necessary cleanup and export telemetry.
STEP 3: To generate logs, run the PHP web-server in the directory. Once the server is running, make HTTP calls to the application route using a browser or the curl command-line tool.
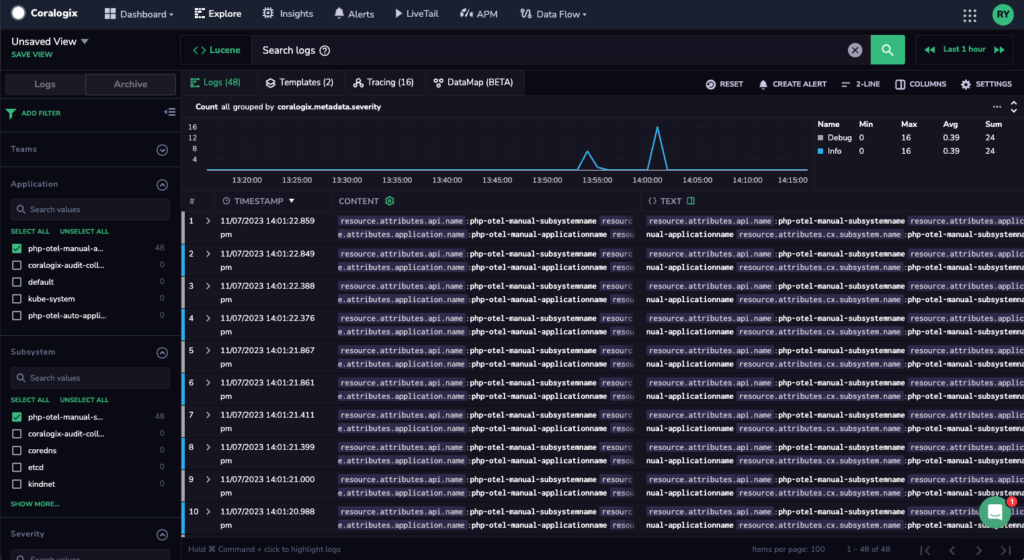
STEP 4: To view the logs generated by your demo rolldice application, go to your Coralogix dashboard and click on Explore > Logs and search logs.
Troubleshooting
PHP extensions
To ensure that the
opentelemetry-beta,grpc, andprotobufmodules are installed and declared correctly in thephp.inifile, run the commandphp -mto list all the loaded PHP modules.If the
grpcmodule takes too long to install, it is because it compiles from source. However, building on Docker and using the docker-php-extension-installer can help create a base layer or image, so that all the modules do not need to be re-installed.
Telemetry not sending
If traces, metrics or logs are not appearing in Coralogix, use the following to check your instrumentation:
To verify that all OpenTelemetry environment variables are configured properly, use the
printenvcommand in the terminal.Check that all dependencies are properly included in the
composer.jsonfile. You can runcomposer show --installedto see the list of installed packages.Check that telemetry is getting generated via the console by changing the respective exporters to
console.
export OTEL_LOGS_EXPORTER=console
export OTEL_TRACES_EXPORTER=console
export OTEL_METRICS_EXPORTER=console
Expected output of traces
[
  {
    "name": "GET /rolldice",
    "context": {
      "trace_id": "16d7c6da7c021c574205736527816eb7",
      "span_id": "268e52331de62e33",
      "trace_state": ""
    },
    "resource": {
      "service.name": "__root__",
      "service.version": "1.0.0+no-version-set",
      "telemetry.sdk.name": "opentelemetry",
      "telemetry.sdk.language": "php",
      "telemetry.sdk.version": "1.0.0beta10",
      "telemetry.auto.version": "1.0.0beta5",
      "process.runtime.name": "cli-server",
      "process.runtime.version": "8.2.6",
      "process.pid": 24435,
      "process.executable.path": "/bin/php",
      "process.owner": "php",
      "os.type": "darwin",
      "os.description": "22.4.0",
      "os.name": "Darwin",
      "os.version": "Darwin Kernel Version 22.4.0: Mon Mar  6 20:59:28 PST 2023; root:xnu-8796.101.5~3/RELEASE_ARM64_T6000",
      "host.name": "OPENTELEMETRY-PHP",
      "host.arch": "arm64"
    },
    "parent_span_id": "",
    "kind": "KIND_SERVER",
    "start": 1684749478068582482,
    "end": 1684749478072715774,
    "attributes": {
      "code.function": "handle",
      "code.namespace": "Slim\App",
      "code.filepath": "/vendor/slim/slim/Slim/App.php",
      "code.lineno": 197,
      "http.url": "http://localhost:8080/rolldice",
      "http.method": "GET",
      "http.request_content_length": "",
      "http.scheme": "http",
      "http.status_code": 200,
      "http.flavor": "1.1",
      "http.response_content_length": ""
    },
    "status": {
      "code": "Unset",
      "description": ""
    },
    "events": [],
    "links": []
  }
]
For more information, please refer to the SDK Specification for Environment Variables and the OpenTelemetry PHP Documentation.
Additional resources
| External | SDK Specification for Environment Variables OpenTelemetry PHP Documentation |
Support
Need help?
Our world-class customer success team is available 24/7 to walk you through your setup and answer any questions that may come up.
Feel free to reach out to us via our in-app chat or by sending us an email at [email protected].


