APM using OpenTelemetry Collector with Kubernetes
Coralogix application performance monitoring can attach pod and host context to every pillar of your observability data, so a slow span shows you the pod that served it and what that pod's memory was doing at the time.
The mechanism is resource attributes: the OpenTelemetry Collector's Kubernetes processor stamps each signal with the pod and node it came from, and Coralogix joins on those.
What you need
- Kubernetes with kubectl.
- Helm installed and configured.
- A metrics bucket.
- OpenTelemetry for Kubernetes installed and configured.
Send logs, metrics, and traces. APM correlates across all three, with any one missing, the joins this page relies on do not resolve.
View the correlated data
Select Explore, then Tracing, and select the trace you want to investigate.
In the span detail pane, select the POD and HOST tabs, alongside RELATED LOGS and SPAN LOGS. Both Spans view and Dependencies view carry them.
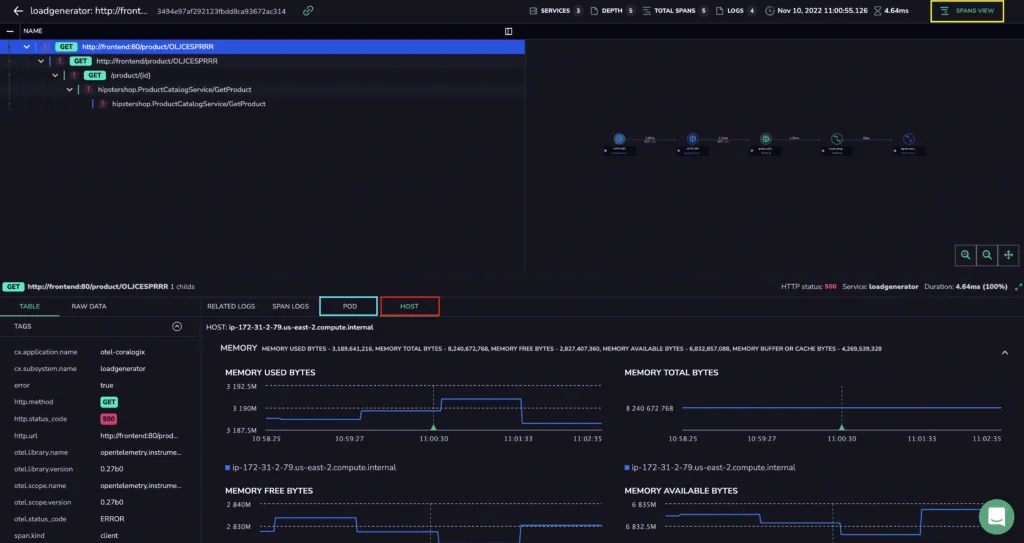
Shows a span alongside the memory behavior of the node that ran it.
Validate the correlation
If any check below returns empty or unexpected results, the data being sent needs review.
Resource attributes on spans
Coralogix APM looks for k8s.pod.name and k8s.node.name on each span and uses them to find matching metrics and logs. If either is unset, correlation does not work.
Open a span in the Tracing UI and expand its resources.
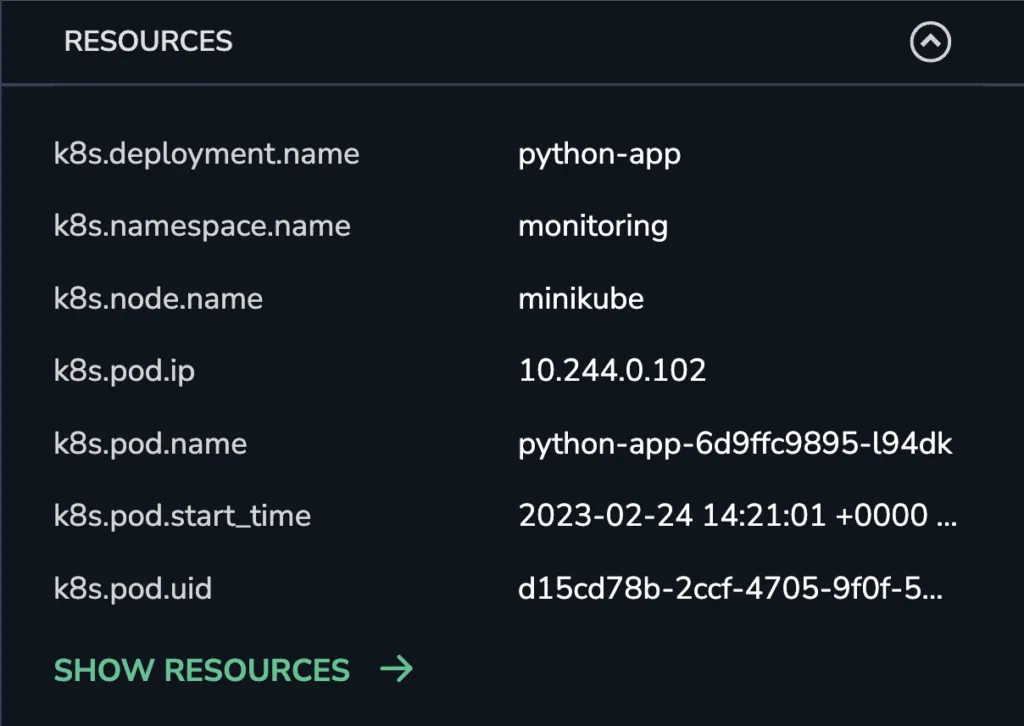
Shows the attribute set a correctly configured Collector produces.
Host metrics
APM needs metrics from Kube State Metrics and the Node Exporter. Both ship with the Coralogix Prometheus Operator.
Run these in the Coralogix Grafana console, in order, each one's output feeds the next.
Confirm the KSM labels match the k8s.node.name attribute on your spans. The result carries an internal_ip label you need next.
kube_node_info{node="<your node name>"}
Use the internal_ip from the previous result:
count(node_cpu_seconds_total{instance=~"<internal_ip>.+"}) by (instance)
Confirm pod metrics arrive from KSM, and that the Collector's own pod metrics arrive in the expected format:
kube_pod_info{pod=~"<partialpodname>.*"}
k8s_pod_cpu_time_total{k8s_pod_name=~"<partialpodname>.*"}