Basic
Overview
Coralogix offers Kubernetes Observability using OpenTelemetry for comprehensive Kubernetes and application observability. With our OpenTelemetry Chart, you can collect logs, metrics, and traces from the running application in your pods to the cluster-level components of your Kubernetes cluster.
Instead of spending hours hand-editing YAML manifests, you can rely on our guided interface to automatically generate a tailored values.yaml file based on your environment and use case. This eliminates guesswork and repetitive editing, allowing you to enable logs, metrics, traces, and advanced features like Profiling and eBPF with just a few clicks—no YAML fatigue, no manual patchwork.
Integration overview
- Application monitoring - Collect traces, generate metrics from spans, apply sampling strategies, and enable profiling—all to monitor application performance efficiently.
- Advanced log and event handling - Ingest structured Kubernetes events, support multiline logs, and reduce payload size by removing unused metadata.
- Infrastructure & metrics - Capture system metrics at all levels—hosts, nodes, pods, clusters—alongside StatsD ingestion and internal collector telemetry. Scale scraping with target allocation.
- Platform & fleet controls - Add Kubernetes metadata for infrastructure visibility and manage collectors centrally through OpAMP-based fleet management.
Coralogix features enabled
Unlock deep observability and cost-efficient monitoring with a single toggle—no manual configuration needed.
- APM - End-to-end tracing using OpenTelemetry with optional eBPF auto-instrumentation for zero-code coverage. Includes head and tail sampling strategies to control volume and focus on high-value traces. Automatically generates span metrics to transform and aggregate trace data into metrics, ensuring 100% APM metric coverage regardless of the sampling strategy.
- Continuous Profiling - Analyzes software behavior over time by collecting data on its execution. This includes measuring function execution times, CPU usage, and other system resource consumption along with relevant metadata. Continuous Profiling enables teams to correlate resource inefficiencies or performance issues, offering granular insights into application behavior.
- Logs and metrics - Collection of enriched application logs, multiline stack traces, Kubernetes events (
events.k8s.io), and system metrics from hosts, pods, containers, and clusters—all tagged with Kubernetes metadata for context-aware filtering and analysis. Once ingested, logs and metrics become a powerful input across the Coralogix platform—powering alerts, dashboards, and many other features. - Infrastructure Explorer - Explore a live, searchable inventory of your Kubernetes clusters and cloud resources—including AWS EC2 instances and Azure Virtual Machines—with full real-time context. See clusters, nodes, pods, and containers alongside tags, ownership, versions, and relationships—no manual mapping required. Quickly audit costs, track accountability, and navigate complex systems without relying on spreadsheets or static dashboards.
- Coralogix Operator - Enable Coralogix Operator to access Kubernetes-native deployment and management for Coralogix, simplifying and automating the configuration of Coralogix APIs through Kubernetes Custom Resource Definitions and controllers.
- Fleet Management - Centralize control of your OpenTelemetry agents by monitoring, configuring, and maintaining them at scale.
Prerequisites
Note
This integration is designed and tested for clean installs. Applying it to existing deployments may require additional checks and adjustments.
Warning
If you’ve already installed the integration using the default values.yaml, be aware that upgrading may overwrite existing configurations, and behavior in your environment is unpredictable. We strongly recommend testing updates in a staging environment first to verify compatibility, stability, and ensure you can take full advantage of new features and best practices.
- Before setting up the integration, ensure that kubectl is installed.
- Make sure you run the installation with Helm v3.9+. To check the version run the following command:
Coralogix Operator prerequisites
To enable the Coralogix Operator as a part of this integration, ensure you have the following:
- A Coralogix team API key
- Prometheus Operator installed
Installation
Follow the steps below to deploy the Coralogix Kubernetes Observability integration in your cluster.
Note
Enable the Use AWS PrivateLink option to configure your integration to use a PrivateLink endpoint.
Set up the integration in Coralogix
- Access Data Flow > Integrations.
- From the Integrations section, select Kubernetes Complete Observability.
On the Kubernetes Complete Observability integration page, click + Setup Collector to create a new integration. For existing integrations, click the arrow icon on the right to upgrade to the new version.

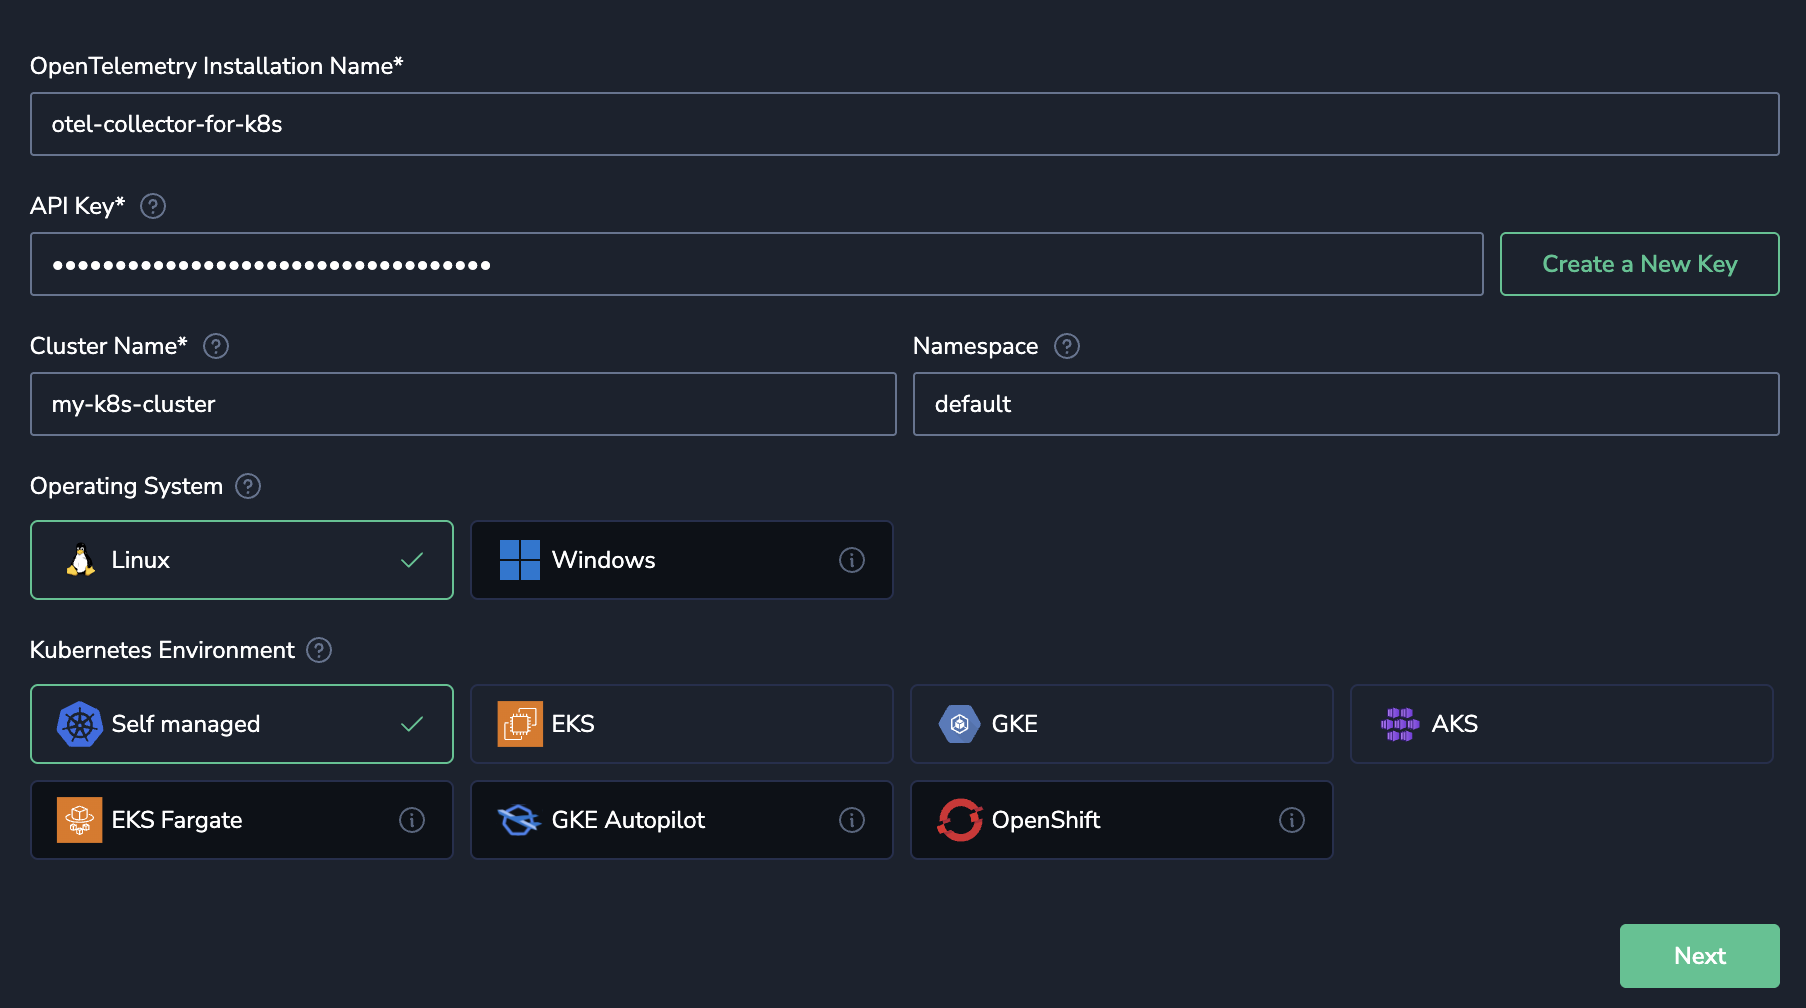
Provide a name to identify this integration (especially useful if you have multiple clusters).
- Enter a Send-Your-Data API key or click Create a New Key to generate a new dedicated API key.
- Enter your Kubernetes cluster name in the Cluster Name field.
- Enter your Kubernetes namespace in the Namespace field. If left empty, the namespace from your current kubectl context will be used.
- Select the operating system and environment that your Kubernetes workloads are deployed on.
Click Next.


Select observability features
Toggle the observability features you want to enable through this integration. Toggling a feature will include the relevant fields and values in your resulting values.yaml configuration file.
Click Save.
Review and deploy
This step in the integration UI provides all required commands. Use the UI directly and note these options for working with the generated values.yaml:
- Copy/Download – Copy the generated configuration to your clipboard or download the
values.yaml/Kubernetes manifest as a file for version control and reuse. - Deployment code – View and copy the full
helm upgradecommand with yourvalues.yamlembedded.
When finished, return to the UI and click Complete setup.

Limitations
- Coralogix places a hard limit of 10MB of data to our OpenTelemetry Endpoints, with a recommendation of 2MB.
- Metric names must be a maximum of 255 characters.
- Attribute keys for metric data must be a maximum of 255 characters.
Next steps
Advanced configuration instructions can be found here.
Validation instructions can be found here.
Additional resources
| Documentation | GitHub Repository |