Target Allocator & PrometheusCR with OpenTelemetry
Overview
Targets are endpoints that supply metrics via the Prometheus data model. For the Prometheus Receiver to scrape them, they can be statically configured via the static_configs parameters or dynamically discovered using one of the supported service discovery mechanisms.
The OpenTelemetry Target Allocator for Kubernetes, an optional component of the OpenTelemetry Operator now included in Coralogix’s OpenTelemetry Integration Helm Chart, facilitates service discovery and manages the configuration of targets into the different agent collector’s Prometheus Receiver across nodes.
If you were previously leveraging the Prometheus Operator and would like to continue using the ServiceMonitor and PodMonitor Custom Resources in OpenTelemetry, the Target Allocator is useful for service discovery with the OpenTelemetry Collector.
Discovery
The Target Allocator discovers Prometheus Operator Custom Resources, namely the ServiceMonitor and PodMonitor as Metrics Targets. These metrics targets detail the endpoints of exportable metrics available on the Kubernetes cluster as "jobs."
Then, the Target Allocator detects available OpenTelemetry Collectors and distributes the targets among known collectors. As a result, the collectors routinely query the Target Allocator for their assigned metric targets to add to the scrape configuration.
Allocation Strategies
Upon query from collectors, the Target Allocator assigns metric endpoint targets according to a chosen allocation strategy. To align with our chart’s Opentelemetry agent in DaemonSet mode, the allocation strategy per node is preconfigured. This assigns each target to the OpenTelemetry collector running on the same Node as the metric endpoint.
Monitoring CRDs (ServiceMonitor & PodMonitor)
As part of the deployment model under the Prometheus Operator, concepts were introduced to simplify the configuration aspects of monitoring to align them with the capabilities of Kubernetes better.
Specifying endpoints under the monitoring scope as CRD objects:
Deployment in YAML files and packaging as Helm Charts or custom resources.
Decouples and de-centralises the monitoring configuration making it more agile for software changes and progression.
Reduces impact across monitored components for changes as there is no single standard file or resource to work with. Any different workload will continue to work.
Both ServiceMonitor and PodMonitor use selectors to detect pods or services to monitor with additional configurations on how to scrape them (e.g., port, interval, path).
ServiceMonitor
A ServiceMonitor provides metrics from the service itself and each of its endpoints. This means each pod implementing the service will be discovered and scraped.
apiVersion: monitoring.coreos.com/v1
kind: ServiceMonitor
metadata:
  labels:
    serviceMonitorSelector: prometheus
  name: prometheus
  namespace: prometheus
spec:
  endpoints:
  - interval: 30s
    targetPort: 9090
    path: /metrics
  namespaceSelector:
    matchNames:
    - prometheus
  selector:
    matchLabels:
      target-allocation: "true"
Details:
endpoints: Defines an endpoint serving Prometheus metrics to be scraped by Prometheus. It specifies an interval, port, URL path, and scrape timeout duration. See the Endpoints spec.selector&namespaceSelector: Selectors for labels and namespaces from which the Kubernetes Endpoints objects will be discovered.
More details on writing the ServiceMonitor can be found in the ServiceMonitor Spec.
PodMonitor
For workloads that cannot be exposed behind a service, a PodMonitor is used instead.
This includes:
Services that are not HTTP-based, e.g. Kafka, SQS/SNS, JMS, etc.
Components such as CronJobs, DaemonSets, etc (e.g. using hostPort)
apiVersion: monitoring.coreos.com/v1
kind: PodMonitor
metadata:
  name: front-end
  labels:
    name: front-end
spec:
  namespaceSelector:
    matchNames:
      - prometheus
  selector:
    matchLabels:
      name: front-end
  podMetricsEndpoints:
  - targetPort: 8079
Details:
podMetricsEndpoints: Similar toendpoint, this defines the pod endpoint serving Prometheus metrics. See PodMetricsEndpoint spec.
Prerequisites
Kubernetes (v1.24+)
The command-line tool kubectl
Helm (v3.9+) installed and configured
CRDs for PodMonitors and ServiceMonitors installed.
Check that Custom Resource Definitions for PodMonitors and ServiceMonitors exist in your cluster using this command:
If not, you can install them with the following kubectl apply commands:
kubectl apply -f https://raw.githubusercontent.com/prometheus-operator/prometheus-operator/main/example/prometheus-operator-crd/monitoring.coreos.com_podmonitors.yaml
kubectl apply -f https://raw.githubusercontent.com/prometheus-operator/prometheus-operator/main/example/prometheus-operator-crd/monitoring.coreos.com_servicemonitors.yaml
Installation
The Target Allocator can be enabled by modifying the default values.yaml file in the OpenTelemetry Integration Chart. Once enabled, it is deployed to service the Prometheus Receivers of the OpenTelemetry Agent Collectors and allocate targets residing on the DaemonSet’s nodes.
This guide assumes you have running services exporting Prometheus metrics running in your Kubernetes cluster.
STEP 1. Follow the instructions for Kubernetes Observability with OpenTelemetry, specifically the Advanced Configuration guide, which utilizes the otel-integration values.yaml file by setting opentelemetry-agent.targetAllocator.enabled to true:
opentelemetry-agent:
  targetAllocator:
    enabled: true   ##set to true
    replicas: 1
    allocationStrategy: "per-node"
    prometheusCR:
      enabled: true
Also, as shown above, the default allocation strategy is per node to align with the OpenTelemtry agent’s daemon set mode.
STEP 2. Install the Helm chart with the changes made to the values.yaml and deploy the target allocator pod:
helm upgrade --install otel-coralogix-integration coralogix-charts-virtual/otel-integration --render-subchart-notes -n <namespace> -f values.yaml
kubectl get pod -n <namespace>
Troubleshooting
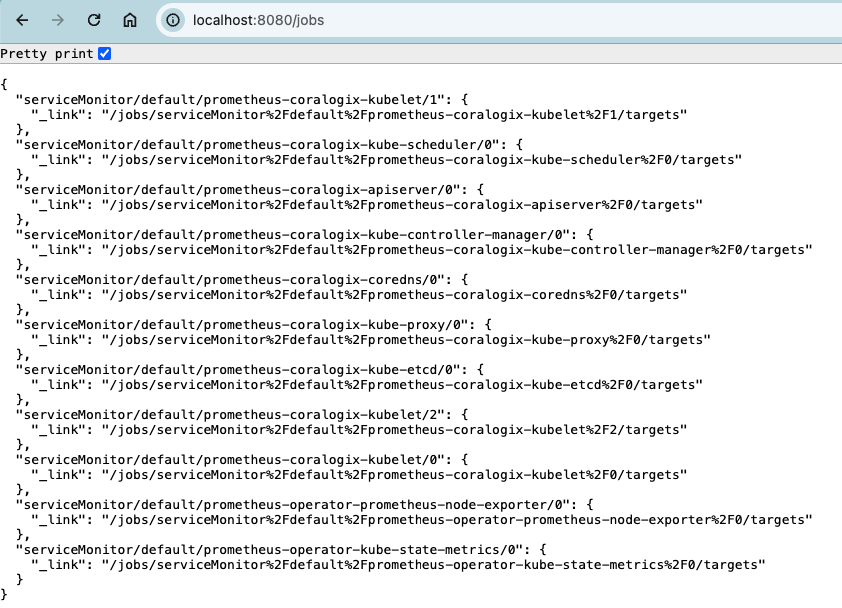
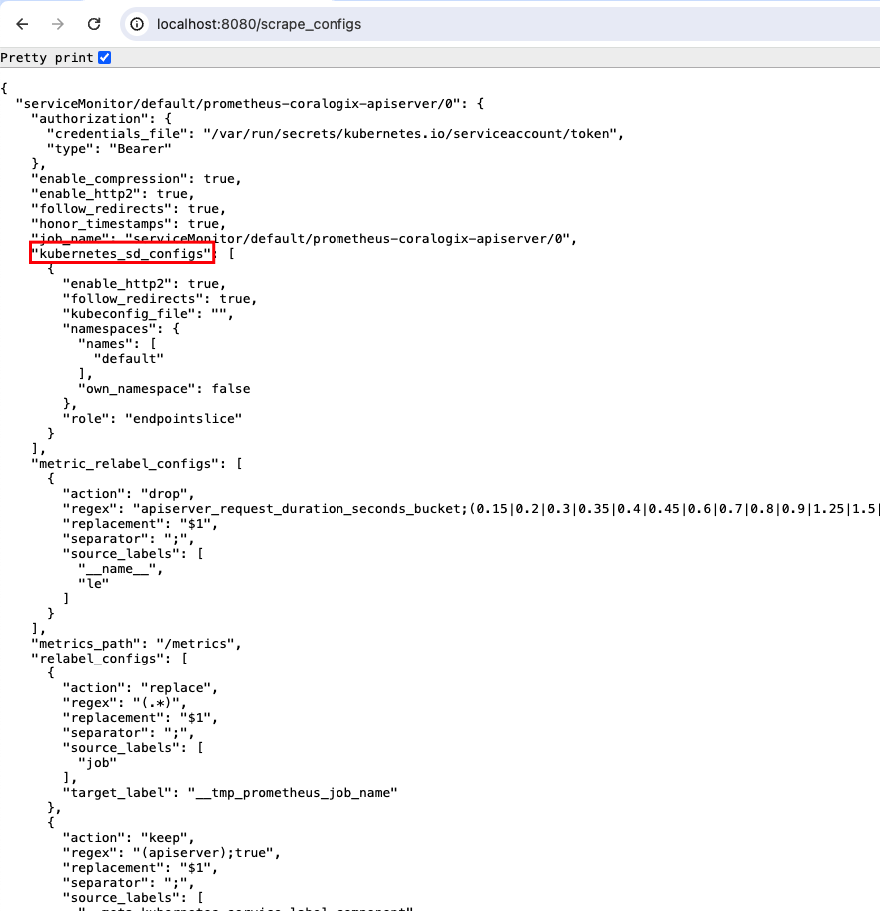
To check if the jobs and scrape configs generated by the Target Allocator are correct and ServiceMonitors and PodMonitors are successfully detected, port-forward to the Target Allocator’s exposed service. The information will be available under the /jobs and /scrape_configs HTTP paths.
The Target Allocator’s service can be located with command: kubectl get svc -n <namespace>
Port forward to the target allocator pod with the following kubectl command:
You can browse or curl the /jobs and /scrape_configs endpoints for the detected PodMonitor & ServiceMonitor resources and the generated scrape configs.
The generated kubernetes_sd_configs is a common configuration syntax for discovering and scraping Kubernetes targets in Prometheus.


