Monitoring Windows server using OTel & Prometheus
This tutorial demonstrates how to monitor Windows Server - including IIS and MSSQL - for logs, metrics, and traces using OpenTelemetry Collector and Prometheus Windows Exporter.
Prerequisites
admin user in Windows with the ability to install services
tar.gzfiles unpacked
Configuration
Windows Exporter
STEP 1. Download the latest MSI from GitHub (0.22.0.msi as of 30 April '23).
STEP 2. Open the command line and navigate to C:\Users\Administrator\Downloads or the MSI folder.
STEP 3. Select which exporter collectors you require - including MSSQL and IIS - from this verbose list: cpu,cs,logical_disk,net,os,service,system,textfile,iis,mssql.
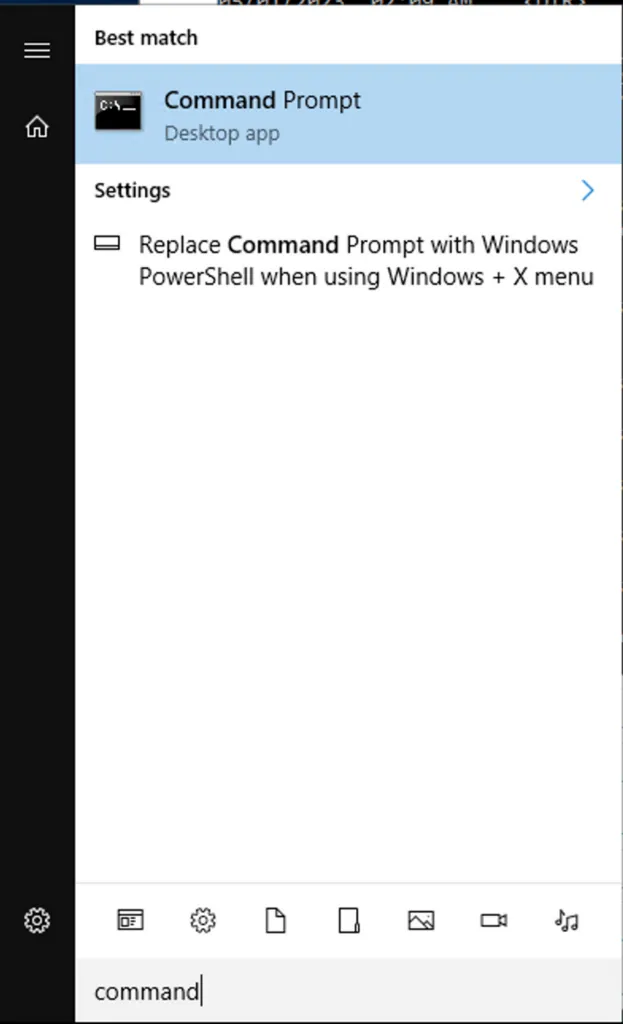
STEP 4. Open Command Prompt.
STEP 5. Run the following command to install the MSI with the collectors chosen:
OpenTelemetry Collector
STEP 1. Download the latest tar.gz from GitHub (0.76.1.tar.gz as of 30 April '23).
STEP 2. Unpack the content into a C:\\cx-otel. This may require you to install a program to unpack tar.gz files.
STEP 3. Create a config.yaml based on the following configuration.
receivers:
  filelog:
    include: [ C:\inetpub\logs\LogFiles\*.* ]
  prometheus:
    config:
      scrape_configs:
        - job_name: 'windows_exporter'
          scrape_interval: 15s
          static_configs:
            - targets: ['0.0.0.0:9182']
processors:
  resourcedetection:
    detectors: [system]
    system:
      hostname_sources: ["os"]
  batch:

exporters:
  coralogix:
    metrics:
      endpoint: "ingress.:443"
    logs:
      endpoint: "ingress.:443"
    private_key: "coralogix-api-key"
    application_name: "WinServer"
    subsystem_name: "Host"

service:
  pipelines:
    metrics:
      receivers: [prometheus]
      processors: [resourcedetection, batch]
      exporters: [coralogix]
    logs:
      receivers: [filelog]
      processors: [resourcedetection, batch]
      exporters: [coralogix]
Notes:
The example configuration captures metrics from windows_exporter and logs from IIS. Modify as necessary.
You are required to input the following variables:
endpoint: Select the OpenTelemetry endpoint associated with your Coralogix domainprivate_key: Your Coralogix Send-Your-Data API keyapplication_name&subsystem_name: Application and subsystem names as they will appear in your Coralogix UI
STEP 4. Install the collector as a service by running the following command:
sc.exe create cx-otelcol displayname=cx-otelcol start=delayed-auto binPath="C:\cx-otel\otelcol-contrib.exe --config C:\cx-otel\config.yaml"
STEP 5. Run the service.
Additional Configurations
Configure Windows exporter dashboards and the OpenTelemetry Kubernetes Extension to monitor the collector itself.
Validation & Testing
STEP 1. Open Services and check that both windows_exporter and cx-otelcol service are running.
STEP 2. To validate which metrics exist in windows_exporter, navigate to http://localhost:9182/metrics.
Notes:
windows_exporter.exeis unsafe and may require a specific "unblock" in its settings.Both
windows_exporterandotelcolcan be run without services to check for logs in the command prompt.
STEP 3. Navigate to Grafana Explore to confirm that windows_* metrics are arriving in your Coralogix dashboard.
Additional Links
Support
Need help?
Our world-class customer success team is available 24/7 to walk you through your setup and answer any questions that may come up.
Feel free to reach out to us via our in-app chat or by sending us an email at [email protected].