Opsgenie data ingestion
Collect your Opsgenie alerts in the Coralogix platform using our automatic Contextual Data Integration Package. The package automatically generates a URL to be used when creating an Opsgenie webhook.
Overview
Opsgenie is a modern incident management and alerting platform that empowers DevOps, IT, and support teams to effectively respond to and resolve incidents in real-time. By centralizing alerts from various monitoring, ticketing, and communication tools, Opsgenie ensures that critical incidents are quickly detected, efficiently communicated, and appropriately addressed. Its comprehensive features include customizable alert routing, on-call scheduling, collaboration tools, and actionable insights, facilitating rapid incident resolution and minimizing downtime for organizations of all sizes.
Sending your Opsgenie alerts to Coralogix streamlines alert management, enhances monitoring capabilities, and facilitates comprehensive incident analysis. By directing your Opsgenie alerts into Coralogix, you gain a centralized view of your alerting activities, enabling rapid incident detection, proactive troubleshooting, and data-driven decision-making. This integration empowers teams to optimize response workflows, strengthen system reliability, and ensure operational efficiency, leveraging Coralogix's analytics, alerts, and visualization tools to extract valuable insights from Opsgenie alerts and ensure a streamlined and resilient incident response process.
Get Started
STEP 1. Access Data Flow > Contextual Data.
STEP 2. In the Contextual Data section, select Opsgenie and click + ADD.
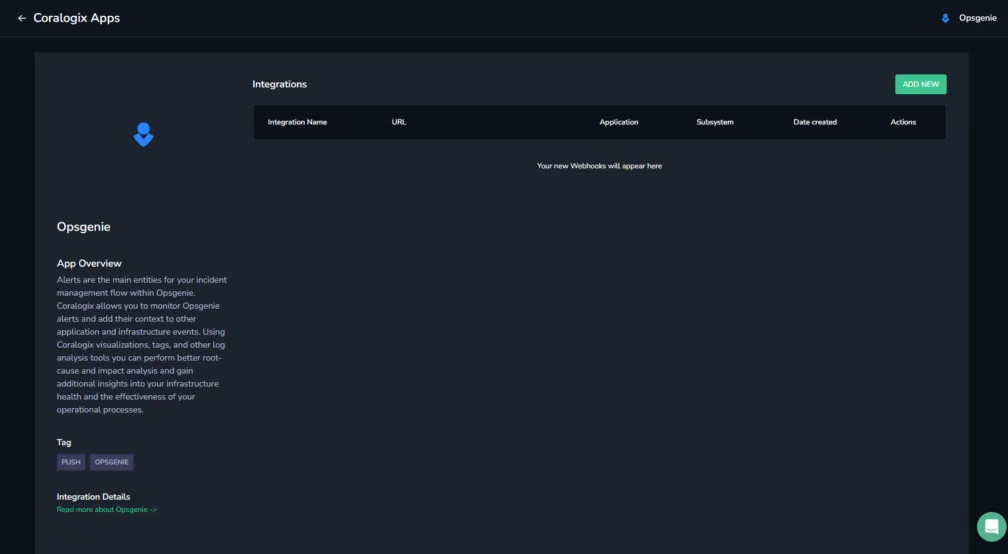
STEP 3. Click ADD NEW.
STEP 4. Fill in the Integration Details:
-
Name. Name your integration.
-
Your API Key. Click CREATE NEW KEY to generate an API key and name it.
-
Application Name and Subsystem Name. Enter an application and subsystem name.

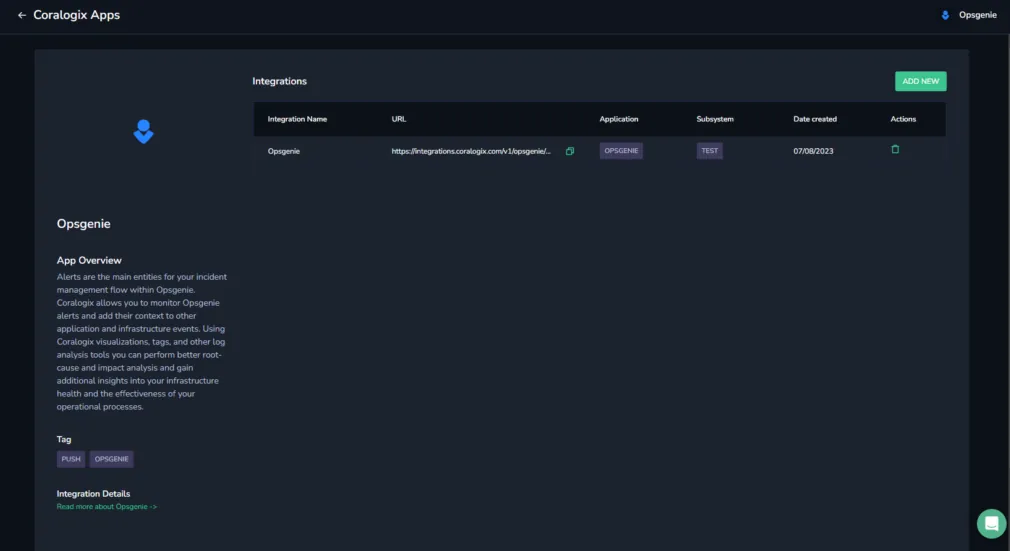
STEP 5. Click GENERATE URL. The URL for the integration will be automatically created. Use this when creating a Opsgenie webhook.
Create an Opsgenie Webhook
Create an Opsgenie webhook using your URL.
STEP 1. Log in to your OpsGenie account and click on Settings.
STEP 2. Scroll down to Integrations and click on Webhook. If you do not see "webhook", click on the integration list and search for it.
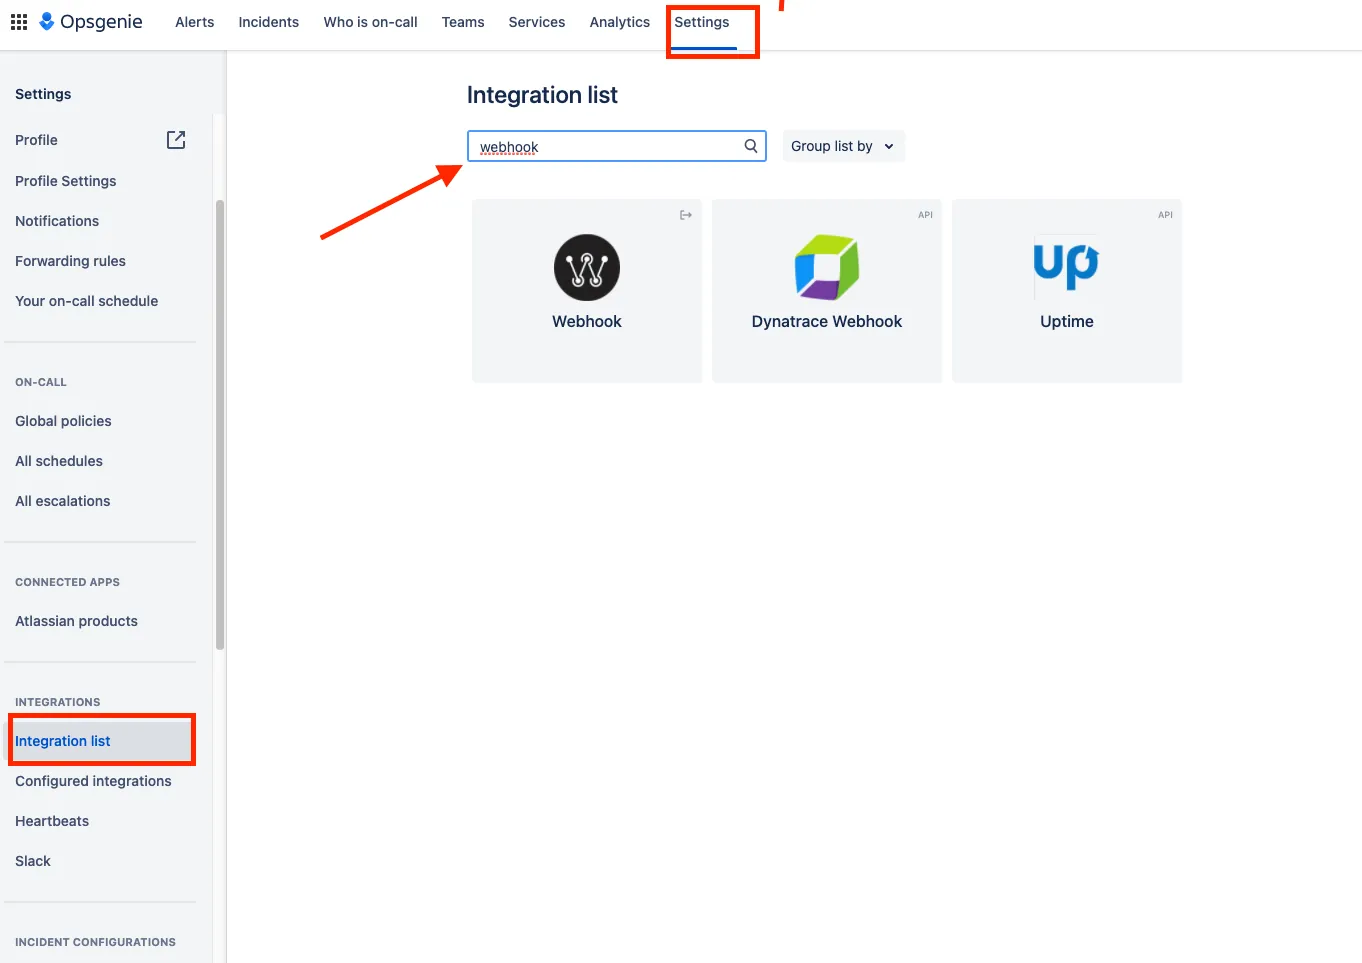
Once you chose webhook a new screen will pop up.
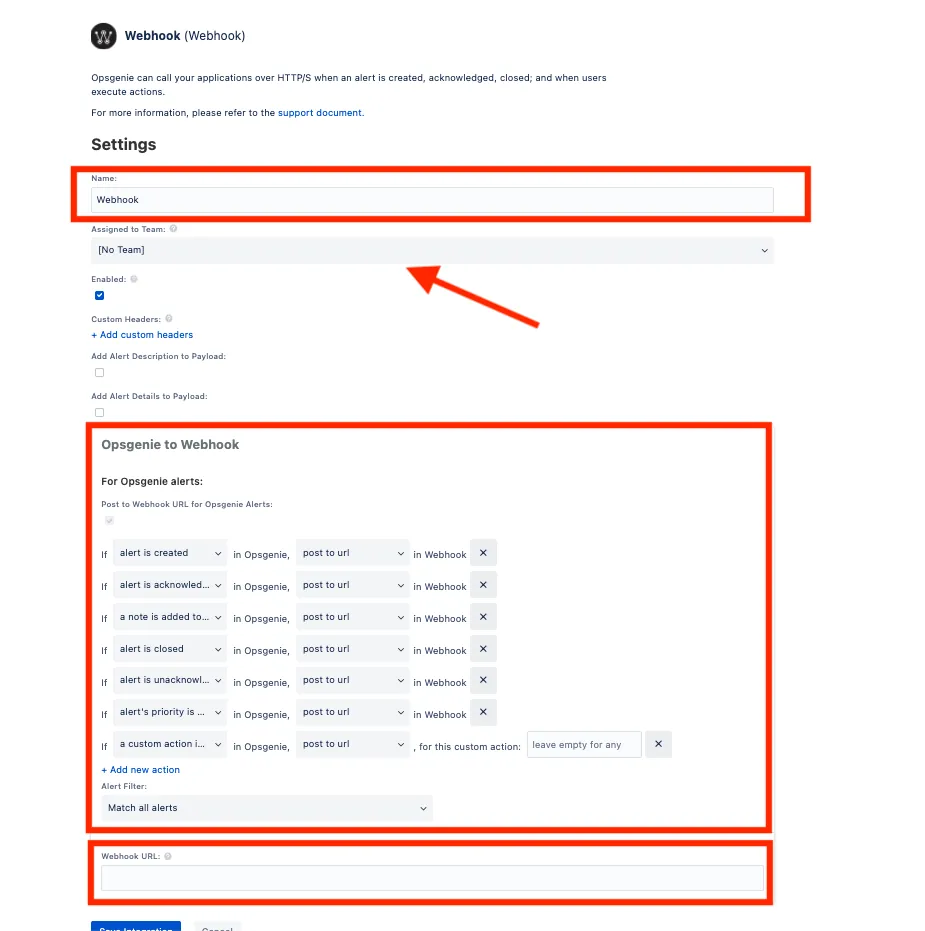
STEP 3. Enter the URL generated by Coralogix in the Webhook URL field, and complete the form, then click Save.
To test your configuration, go under Alerts and configure a test alert.