Prometheus
Prometheus is currently the leading tool for metric collection, it's easy to integrate and easy to use.
Still, short-term retention is a big struggle faced by Prometheus users.
Coralogix helps you overcome this struggle by providing you a way to automatically ship your metrics into your Coralogix account and store them long-term without making complex changes to your Prometheus architecture.
Enjoy our new APM features when using OpenTelemetry collector with a Kubernetes processor and Prometheus.
Send Prometheus Metrics to Coralogix
In order to send metrics to Coralogix, select a Prometheus RemoteWrite endpoint URL for the domain associated with your Coralogix account.
Using a YAML File
Under root level add remote_write using the following format:
remote_write:
- url: https://ingress.eu2.coralogix.com/prometheus/v1
  name: '<customer_name>'
  remote_timeout: 120s
  bearer_token: '<Send_Your_Data_API_key>'
Using Prometheus Operator
Prometheus Operator provides Kubernetes native deployment.
You can add remoteWrite in the following format (note the camel case):
remoteWrite:
    url: https://ingress.eu2.coralogix.com/prometheus/v1
    name: '<customer_name>'
    remoteTimeout: 120s
    bearerToken: '<Send_Your_Data_API_key>'
Set application and subsystem names
Coralogix reads cx_application_name and cx_subsystem_name from each metric's labels to assign the application and subsystem in the UI. Without them, metrics arrive with empty application and subsystem fields — which is especially noisy when several Prometheus instances send to the same Coralogix account.
Set them once on the Prometheus instance using external_labels, and Prometheus attaches them to every metric in the remote_write stream.
In a Prometheus YAML config, add them to the top-level global section:
global:
  external_labels:
    cx_application_name: '<your_application_name>'
    cx_subsystem_name: '<your_subsystem_name>'

remote_write:
- url: https://ingress.eu2.coralogix.com/prometheus/v1
  name: '<customer_name>'
  remote_timeout: 120s
  bearer_token: '<Send_Your_Data_API_key>'
With Prometheus Operator, set them under the Prometheus resource spec as a sibling of remoteWrite:
spec:
  externalLabels:
    cx_application_name: '<your_application_name>'
    cx_subsystem_name: '<your_subsystem_name>'
  remoteWrite:
    - url: https://ingress.eu2.coralogix.com/prometheus/v1
      name: '<customer_name>'
      remoteTimeout: 120s
      bearerToken: '<Send_Your_Data_API_key>'
Note:
- The Prometheus operator must be in v0.59.0 at least in order to support the agent mode.
Guidelines & Parameters
-
url: query params that send metric information to Coralogix. These params contain appLabelName, subSystemLabelName and severityLabelName. The parameters you should provide are the keys you choose to send to Coralogix, they are mapped to metric labels. -
name: The name of the time series. This attribute was added after Prometheus v2.15.0. If added before, it will produce an error. -
remoteTimeout: Timeout for requests to the remote write endpoint. -
bearerToken: Input your Coralogix Send-Your-Data API key. -
Severities values that are valid in Coralogix are as follows: debug, verbose, info, warning, error, and critical. The default severity when leaving
severityLabelNameempty is info.
Server Responses
The following is a list of possible server responses.
-
HTTP 200: The protobuf file is valid and contains Prometheus Metadata. -
HTTP 201: The protobuf file is valid and processed by Coralogix. -
HTTP 204: The protobuf file is valid, but the Prometheus.WriteRequest is empty. -
HTTP 400: The REST API request itself was malformed. Check the query params. -
HTTP 401: The customer is unauthorized. Verify your private key.
Grafana Visibility
Coralogix enables you to integrate and view your metrics from Grafana as well.

To connect Grafana to your account you can follow this tutorial: https://coralogix.com/tutorials/grafana-plugin/
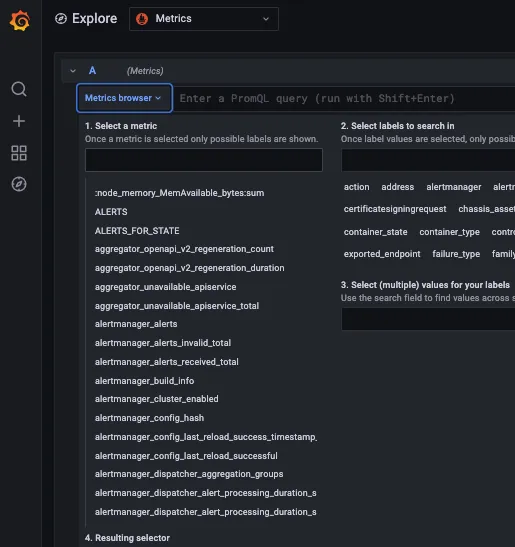
Coralogix Visibility
To view the metrics in your Coralogix dashboard:
-
Navigate to 'Grafana Explore'
-
Choose 'Metrics' as a data source.
-
Expand 'Metrics browser.'
-
Select a metric.
Enabling Metrics Archive in Coralogix
Learn more on how to enable your S3 archive for metrics:
Connect S3 Archive