Running OpenTelemetry as a CLI application
This tutorial demonstrates how to configure OpenTelemetry (OTEL) Collector to send your logs and metrics to Coralogix when running OpenTelemetry as a CLI application or service.
Prerequisites
- OpenTelemetry CLI application or service installed
Notes:
To use the Coralogix Exporter, ensure that you have installed opentelemetry-collector-contrib. You can download the relevant version for your OS using this link.
Configuration
STEP 1. Create a configuration file. Copy this template file and save it as config.yaml.
receivers:
  filelog:
    start_at: beginning
    include:
      - /example.log
    include_file_path: true
    multiline: {line_start_pattern: "\\n"}
  hostmetrics:
    collection_interval: 30s
    scrapers:
      cpu:
      memory:
exporters:
  coralogix:
    domain: "Domain"
    private_key: "Private key"
    application_name: "Application Name"
    subsystem_name: "Subsystem Name"
    timeout: 30s

service:
  pipelines:
    logs:
      receivers: [ filelog ]
      exporters: [ coralogix ]
    metrics:
      receivers: [ hostmetrics ]
      exporters: [ coralogix ]
Provide the following variables.
| Variable | Description |
|---|---|
| Private Key | Your Coralogix Send-Your-Data API key |
| Application Name | The name of your application, as it will appear in your Coralogix dashboard. For example, a company named SuperData might insert the SuperData string parameter. If SuperData wants to debug its test environment, it might use SuperData–Test. |
| Subsystem Name | The name of your subsystem, as it will appear in your Coralogix dashboard. Applications often have multiple subsystems (ie. Backend Servers, Middleware, Frontend Servers, etc.). In order to help you examine the data you need, inserting the subsystem parameter is vital. |
| Domain | Your Coralogix domain |
STEP 2. Save this log file as example.log.
2023-06-19 05:20:50 ERROR This is a test error message
2023-06-20 12:50:00 DEBUG This is a test debug message
2023-06-21 12:34:56 INFO This is a test info message
STEP 3. Run the example file. Choose the command that mirrors your installation type.
- OTEL installed as an application
./otelcol-contrib --config config.yaml
- OTEL installed as a service
otelcol-contrib --config config.yaml
Validation
Validate your configuration.
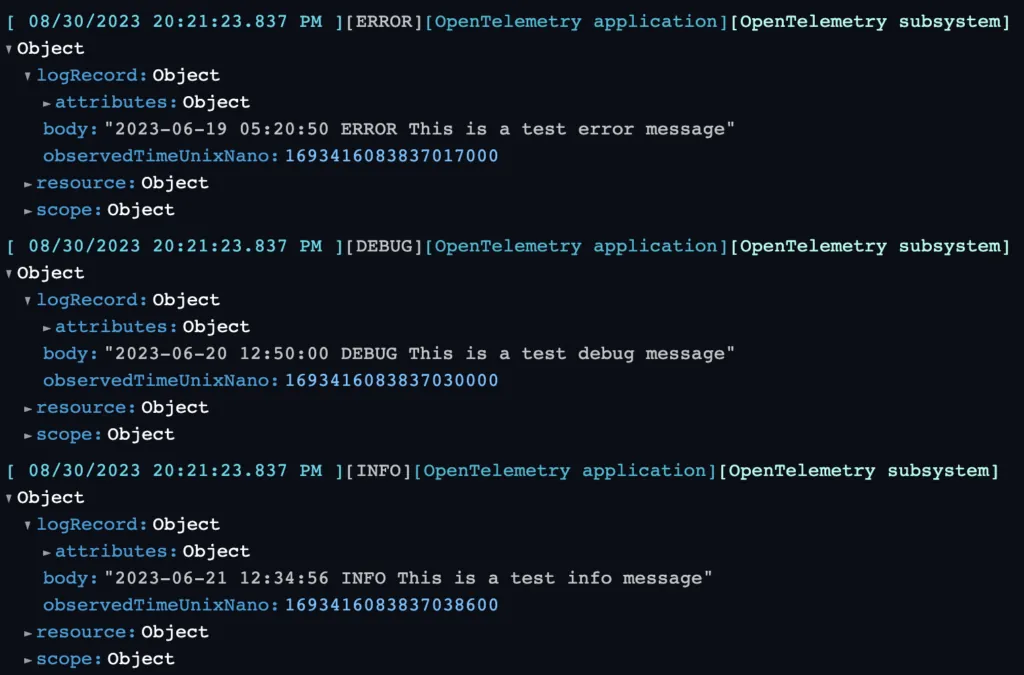
Logs
In your Coralogix navigation pane, click LiveTrail > Start to view your logs.

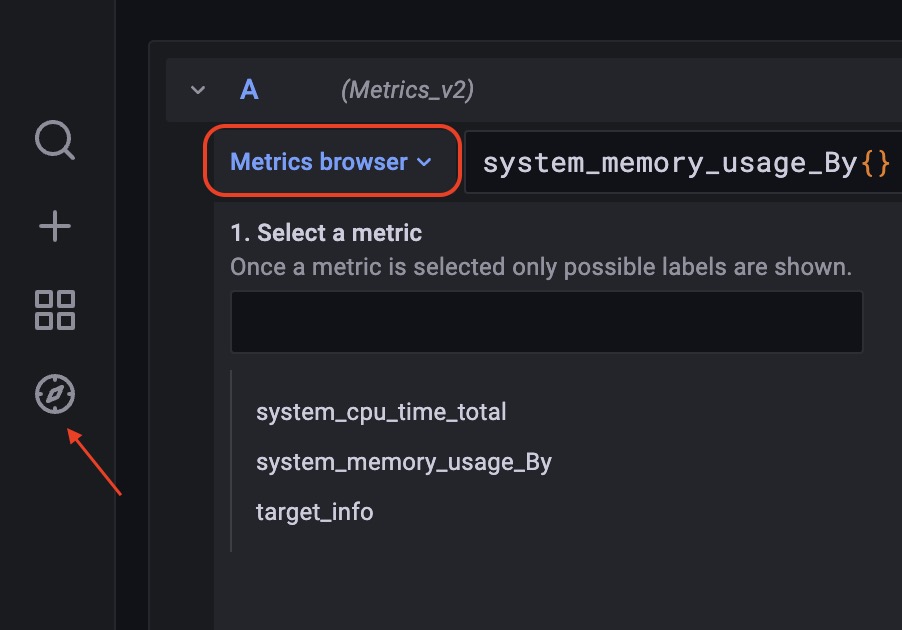
Metrics
STEP 1. Navigate to hosted Grafana view.
STEP 2. In the left-hand panel, click Explore > Metrics browser. Select the metrics that you would like to see.
Additional Resources
| Documentation | OpenTelemetry |