Serverless monitoring
Serverless Monitoring feature provides customers using the Coralogix AWS Lambda Telemetry Exporter to gain deeper visibility and control over their AWS Lambda functions at both high-level and granular views.
For each Lambda function, you can view:
- Triggers
- AWS account
- Region
- Runtime
- Invocation count
- Errors
- Timeouts
- Last invocation time
- Average latency
- Out-of-memory status
Prerequisites
To start monitoring AWS Lambda functions:
-
Choose one of the following options for Lambda monitoring:
-
Set up Lambda monitoring to get full telemetry, including traces. This is available for Node.js and Python (v3.8 or newer). View the relevant documentation here.
-
Set up Lambda monitoring to get only basic telemetry, including logs, or to select other runtimes. With this option, you are only required to set up the Coralogix AWS Lambda Telemetry Exporter. View the relevant documentation here.
-
Access Serverless tab
-
In your Coralogix toolbar, navigate to APM, then Serverless tab.
-
Select a function to view its drilldown.
Drill-down to a specific function
Selecting on function provides in-depth information about it. The drilldown shows the metadata of the Lambda function being called, including invocations graphs, as well as the breakdown of when the function was triggered and how.
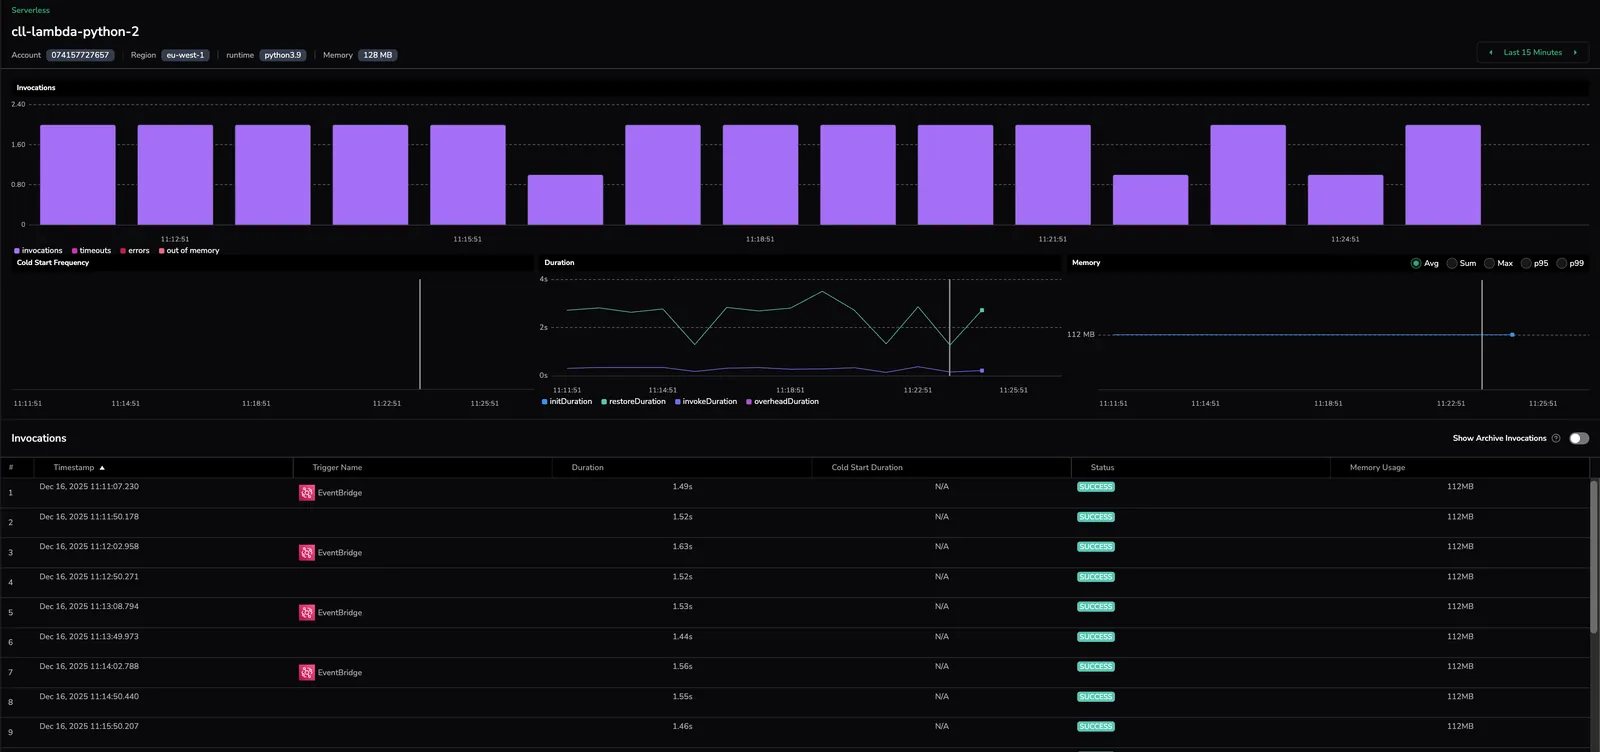
Invocations
The Invocations graph displays an aggregative breakdown of how often the function was triggered. Each bar in the graph shows the number of invocations, errors, and timeouts for a segment of time (the exact length of time is calculated dynamically depending on the time range shown).
Cold start frequency
The Cold Start Frequency graph shows the frequency of cold starts over time. Cold starts occur when the function is triggered and has to start from scratch (in contrast with invocations where the function is woken up from a sleep state).
Duration
The Duration graph presents the length of time a function ran. It includes both invoked Lambdas and cold starts and allows to see the time taken for each.
Memory
The Memory graph shows how much memory was used by the triggered Lambda function.
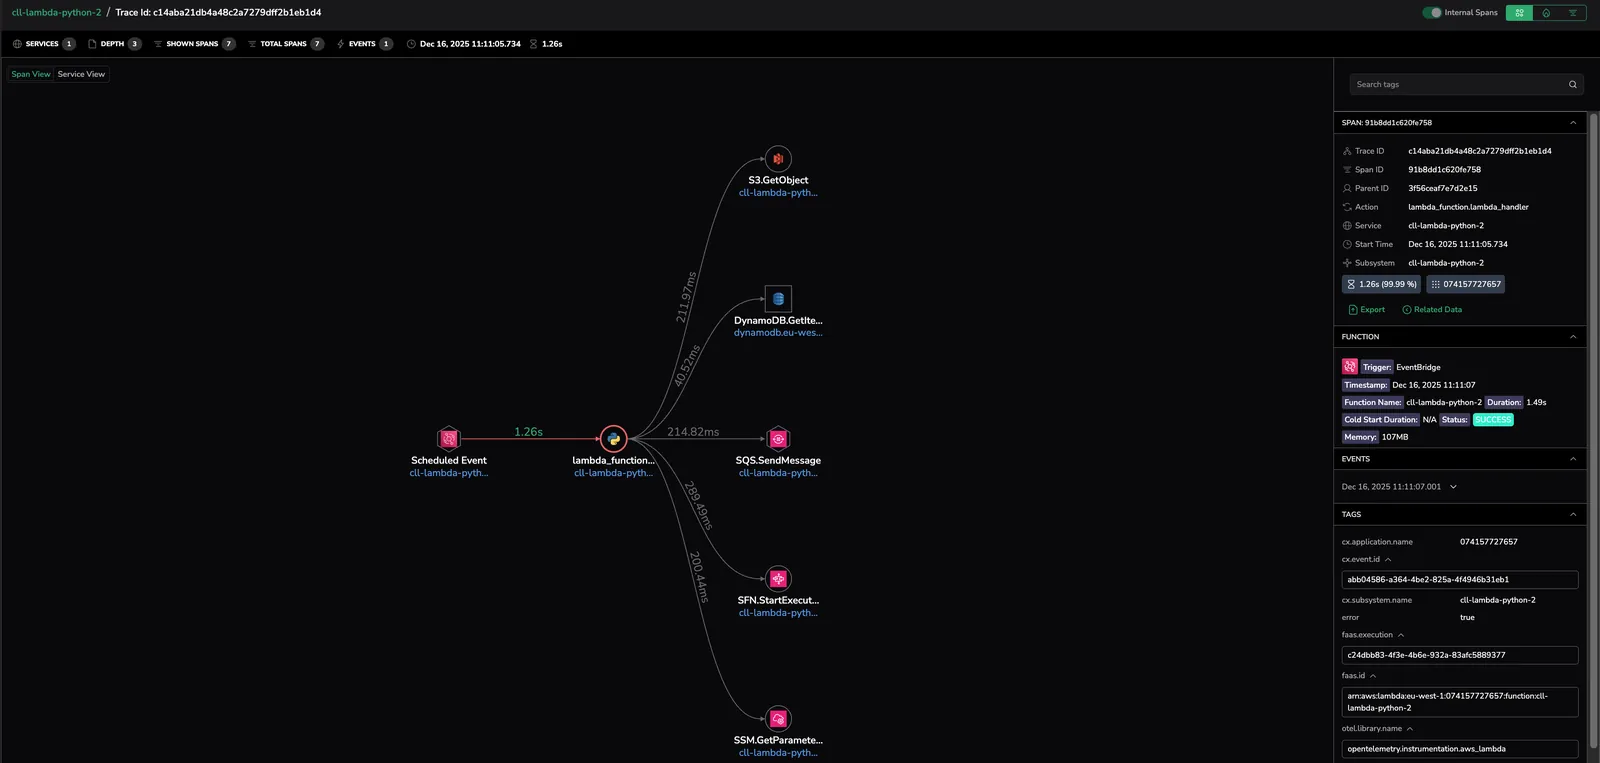
Invocations drilldown
Clicking on a specific invocation of the Lambda function brings you to the Explore page. This page shows the Lambda function together with the chain of actions that occurred before and after it was triggered.
The right-hand menu presents information about the Lambda function (such as spans, triggers, events, tags, processes).
Next steps
Cover the persistence layer next with Database monitoring, which surfaces query-level metrics for your databases.