StatsD
StatsD is an open-source standard and, by extension, a toolkit designed for sending, collecting, and aggregating custom metrics from diverse applications. Initially, StatsD denoted a daemon crafted by Etsy using Node.js.
This tutorial demonstrates installing and running StatsD using OpenTelemetry to send your metrics to Coralogix.
Prerequisites
-
Otel-contrib installed
-
Coralogix account
Deploy using Otel
STEP 1. Save this config file as config.yaml:
receivers:
  statsd:
    endpoint: "localhost:8125"
    aggregation_interval: 30s

processors:
  batch:
    send_batch_size: 1024
    send_batch_max_size: 2048
    timeout: "1s"

exporters:
  coralogix:
    domain: "eu2.coralogix.com"
    private_key: "<private_key>"
    application_name: "applicationName"
    subsystem_name: "subsystemName"
    timeout: 30s

service:
  pipelines:
    metrics:
      receivers: [ statsd ]
      processors: [ batch ]
      exporters: [ coralogix ]
STEP 2. Replace the
private_keywith your Send-Your-Data API key, and thecoralogix_domainwith your Coralogix domain.STEP 3. Run the config file.
otelcol-contrib --config config.yaml
Deploy using Docker
STEP 1. To deploy StatsD using Docker, change the endpoint to 0.0.0.0:8125 in the config.yaml file.
receivers:
  statsd:
    endpoint: "0.0.0.0:8125"
STEP 2. Run these commands to deploy the configuration:
docker pull otel/opentelemetry-collector-contrib
docker run -d -v ./config.yaml:/etc/otelcol-contrib/config.yaml -p 8125:8125/udp otel/opentelemetry-collector-contrib
Validation
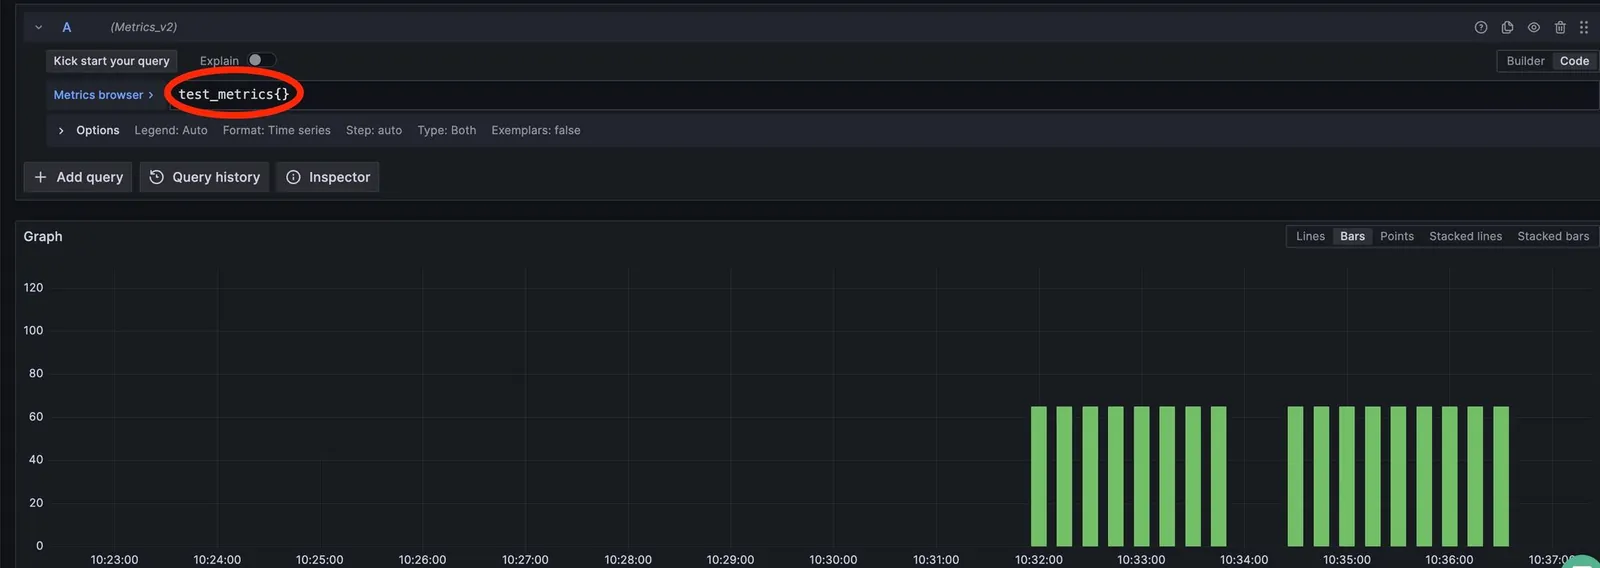
Test Metrics
To send test metrics, run the following command to test the configuration:
echo "test_metrics:65|c|#tag_1:value,tag_2:value_2" | nc -u -w1 127.0.0.1 8125
echo "test_metrics:65|g|#tag_1:value,tag_2:value_2" | nc -u -w1 127.0.0.1 8125
Access your Grafana account to view the metrics sent.
Timer Metrics
Send timer metrics to Coralogix with sum and count attributes:
receivers:
  statsd:
    endpoint: "0.0.0.0:8125"
    is_monotonic_counter: true
    aggregation_interval: 30s
    enable_metric_type: true
    timer_histogram_mapping:
      - statsd_type: "timer"
        observer_type: "summary"
To send metrics, use this command:
echo "timer_metrics:65|ms|#tag_1:value,tag_2:value_2" | nc -u -w1 127.0.0.1 8125
View more configuration options for the StatsD receiver here.