Tail sampling with Coralogix & OpenTelemetry
Are you looking for a way to improve traces observability without breaking the bank? Look no further!
In our previous tutorial, we showed you how to set up the new OpenTelemetry Community Demo Application and send telemetry data to Coralogix, giving you the ability to understand the interactions between your services and visualize, alert and query them on your Coralogix dashboard.
But what about cost? Ingesting all of your traces and spans can quickly add up and can be unnecessary in order to gain visibility into the health of your applications. That’s where trace sampling comes in - in particular, tail sampling.
By sampling your traces, you can significantly reduce the amount of data ingested into Coralogix, maintaining full visibility into your services without incurring heavy charges. Try it out with the OTel Demo App.
Overview
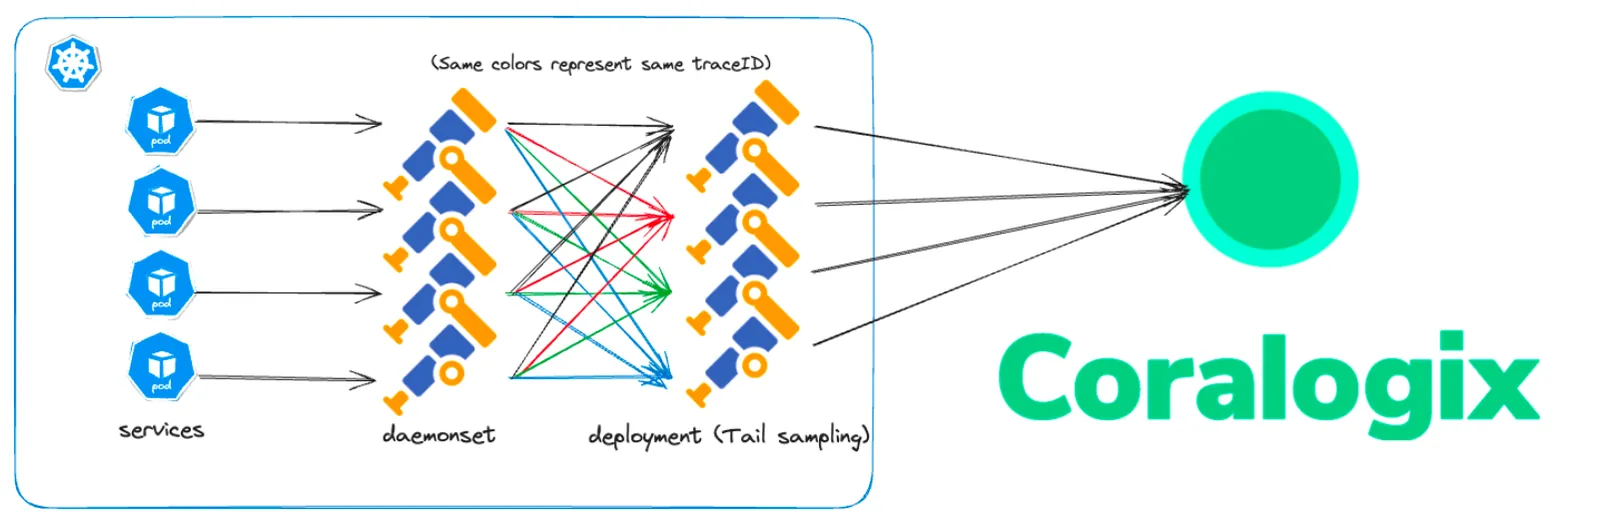
Coralogix offers a number of tutorials demonstrating how to use the OTel Collector in a load-balanced configuration with tail sampling enabled on the collector nodes using the OTel Demo App.
The tail sampling processor and probabilistic sampling processor allow you to sample traces based on a set of rules at the collector level.
This allows you to define more advanced rules to keep accrued visibility over error or high latency traces.
To achieve this in your environment your code should be instrumented with OpenTelemetry and emit the telemetry data to the OTel Collector.
What is tail sampling? Why is it important?
Tail sampling is a method of trace sampling in which sampling decisions are made at the end of the workflow, allowing for a more accurate sampling decision. This is in contrast to head-based sampling, in which the the sampling decision is made at the beginning of a request and usually at random. Tail sampling grants you the option of filtering your traces based on specific criteria, a plus when compared with head-based sampling.
So why is tail sampling important, and why should you do it?
-
Enjoy focused observability**. Tail sampling is a powerful tool for focused observability, allowing you to zero in on the traces that matter to you most. View only those traces that are of interest to you.
-
Identify issues. Tail sampling is useful for identifying issues in your distributed system while saving on observability costs.
-
Save on costs. By selectively exporting a predetermined subset of your traces, you can lower data ingestion and storage costs, while still being able to identify and troubleshoot issues.
Tutorials
Choose one of tutorials below to use the OTel Collector in a load balanced configuration with tail sampling enabled on the collector nodes, using the OTel Demo: