Tail sampling with OpenTelemetry using Kubernetes
This tutorial demonstrates how to configure a Kubernetes cluster, deploy OpenTelemetry to collect logs, metrics, and traces, and enable trace sampling. We will cover an example of enabling a tail sample for the Opentelemetry Demo Application and a more precise example using the small trace-generating application.
Prerequisites
-
A Kubernetes cluster
-
Helm installed
-
Coralogix Send-Your-Data API key
How it Works
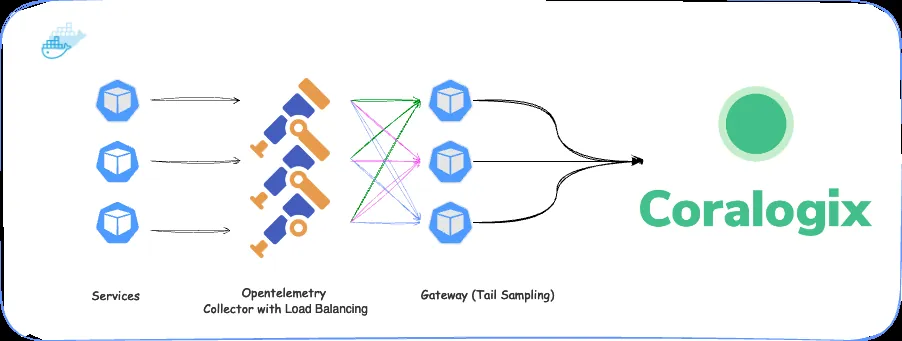
The Kubernetes OpenTelemetry Integration consists of the following components:
-
OpenTelemetry Agent. The Agent is deployed to each node within the Cluster and collects telemetry data from the applications running on that node. The agent is configured to send the telemetry data to the OpenTelemetry Gateway. The agent ensures that traces with the same ID are sent to the same gateway. This allows tail sampling to be performed on the traces correctly, even if they span multiple applications and nodes.
-
OpenTelemetry Gateway. The Gateway is responsible for receiving telemetry data from the agents and forwarding it to the Coralogix backend. The Gateway is also responsible for load balancing the telemetry data to the Coralogix backend.
Install the Coralogix OpenTelemetry Integration
This integration uses the Coralogix OpenTelemetry Helm Chart. While this document focuses on tail sampling for traces, deploying this chart also deploys the infrastructure to collect logs, metrics, and traces from your Kubernetes cluster and pods.
STEP 1. Add the Coralogix Helm repository.
helm repo add coralogix-charts-virtual https://cgx.jfrog.io/artifactory/coralogix-charts-virtual
STEP 2. Copy the tail-sampling-values.yaml file found here and update the relevant fields with your values.
global:
  domain: "<your-coralogix-domain>"
  clusterName: ""
  defaultApplicationName: "otel"
  defaultSubsystemName: "integration"
  logLevel: "warn"
  collectionInterval: "30s"

opentelemetry-agent:
  enabled: true
  mode: daemonset
  presets:
    loadBalancing:
      enabled: true
      routingKey: "traceID"
      hostname: coralogix-opentelemetry-gateway

  config:
    service:
      pipelines:
        traces:
          exporters:
            - loadbalancing

opentelemetry-gateway:
  enabled: true
  replicaCount: 3

  config:
    processors:
      tail_sampling:
        decision_wait: 10s
        num_traces: 100
        expected_new_traces_per_sec: 10
        policies:
          [
            {
              name: errors-policy,
              type: status_code,
              status_code: {status_codes: [ERROR]}
            },
            {
              name: randomized-policy,
              type: probabilistic,
              probabilistic: {sampling_percentage: 10}
            },
          ]

opentelemetry-cluster-collector:
  enabled: true

opentelemetry-agent-windows:
  enabled: false

coralogix-ebpf-agent:
  enabled: false
STEP 3. Add your Coralogix Send-Your-Data API key to the tail-sampling-values.yaml file.
kubectl create secret generic coralogix-keys --from-literal 'PRIVATE_KEY=<your-private-key>'
STEP 4. Install the otel-integration.
kubectl get pods
NAME                                               READY   STATUS    RESTARTS   AGE
coralogix-opentelemetry-agent-86qdb                1/1     Running   0          7h59m
coralogix-opentelemetry-gateway-65dfbb5567-6rk4j   1/1     Running   0          7h59m
coralogix-opentelemetry-gateway-65dfbb5567-g7m5l   1/1     Running   0          7h59m
coralogix-opentelemetry-gateway-65dfbb5567-zbprd   1/1     Running   0          7h59m
You should end up with as many opentelemetry-agent pods as you have nodes in your cluster, and 3 opentelemetry-gateway pods.
Install Test Application Environment
In the next section, we will describe the process for installing 2 application environments, the OpenTelemetry Demo Application and a Small Trace Generating. You do not need to install both these examples.
Install OpenTelemetry Demo
STEP 1. Add the Hlem chart for the OpenTelemetry Demo Application.
helm repo add open-telemetry https://open-telemetry.github.io/opentelemetry-helm-charts
STEP 2. Create a values.yaml file and add the following:
default:
  env:
    - name: OTEL_SERVICE_NAME
      valueFrom:
        fieldRef:
          apiVersion: v1
          fieldPath: "metadata.labels['app.kubernetes.io/component']"
    - name: OTEL_COLLECTOR_NAME
      value: '{{ include "otel-demo.name" . }}-otelcol'
    - name: OTEL_EXPORTER_OTLP_ENDPOINT
      value: http://$(OTEL_COLLECTOR_NAME):4317
    - name: OTEL_EXPORTER_OTLP_METRICS_TEMPORALITY_PREFERENCE
      value: cumulative
    - name: OTEL_RESOURCE_ATTRIBUTES
      value: service.name=$(OTEL_SERVICE_NAME),service.namespace=opentelemetry-demo

  envOverrides:
    - name: OTEL_COLLECTOR_NAME
      valueFrom:
        fieldRef:
          apiVersion: v1
          fieldPath: spec.nodeName
    - name: OTEL_EXPORTER_OTLP_ENDPOINT
      value: http://$(OTEL_COLLECTOR_NAME):4317

serviceAccount:
  create: true
  annotations: {}
  name: ""

opentelemetry-collector:
  enabled: false

jaeger:
  enabled: false

prometheus:
  enabled: false

grafana:
  enabled: false
This will configure the OpenTelemetry Demo Application to send traces to the Coralogix OpenTelemetry Agent running on the node.
STEP 3. Install the Opentelemetry Demo Application.
helm install otel-demo open-telemetry/opentelemetry-demo -f values.yaml

NAME: my-otel-demo
LAST DEPLOYED: Mon Feb 19 23:29:16 2024
NAMESPACE: default
STATUS: deployed
REVISION: 1
TEST SUITE: None
NOTES:
Install the Small Trace-Generating Application
This application is a small trace-generating application. We will demonstrate how to connect it to the Coralogix OpenTelemetry Agent to enable tail sampling.
STEP 1. Create a file go-traces-demo.yaml and add the following:
apiVersion: apps/v1
kind: Deployment
metadata:
  name: go-otel-traces-demo
spec:
  selector:
    matchLabels:
      app: go-otel-traces-demo
  replicas: 1
  template:
    metadata:
      labels:
        app: go-otel-traces-demo
    spec:
      containers:
        - name: go-otel-traces-demo
          image: public.ecr.aws/c1s3k2h4/go-otel-traces-demo:latest
          imagePullPolicy: Always
          env:
            - name: NODE_IP
              valueFrom:
                fieldRef:
                  fieldPath: status.hostIP
            - name: CX_ENDPOINT
              value: $(NODE_IP):4317
STEP 2. Apply the Kuberenetes deployment.
kubectl apply -f go-traces-demo.yaml
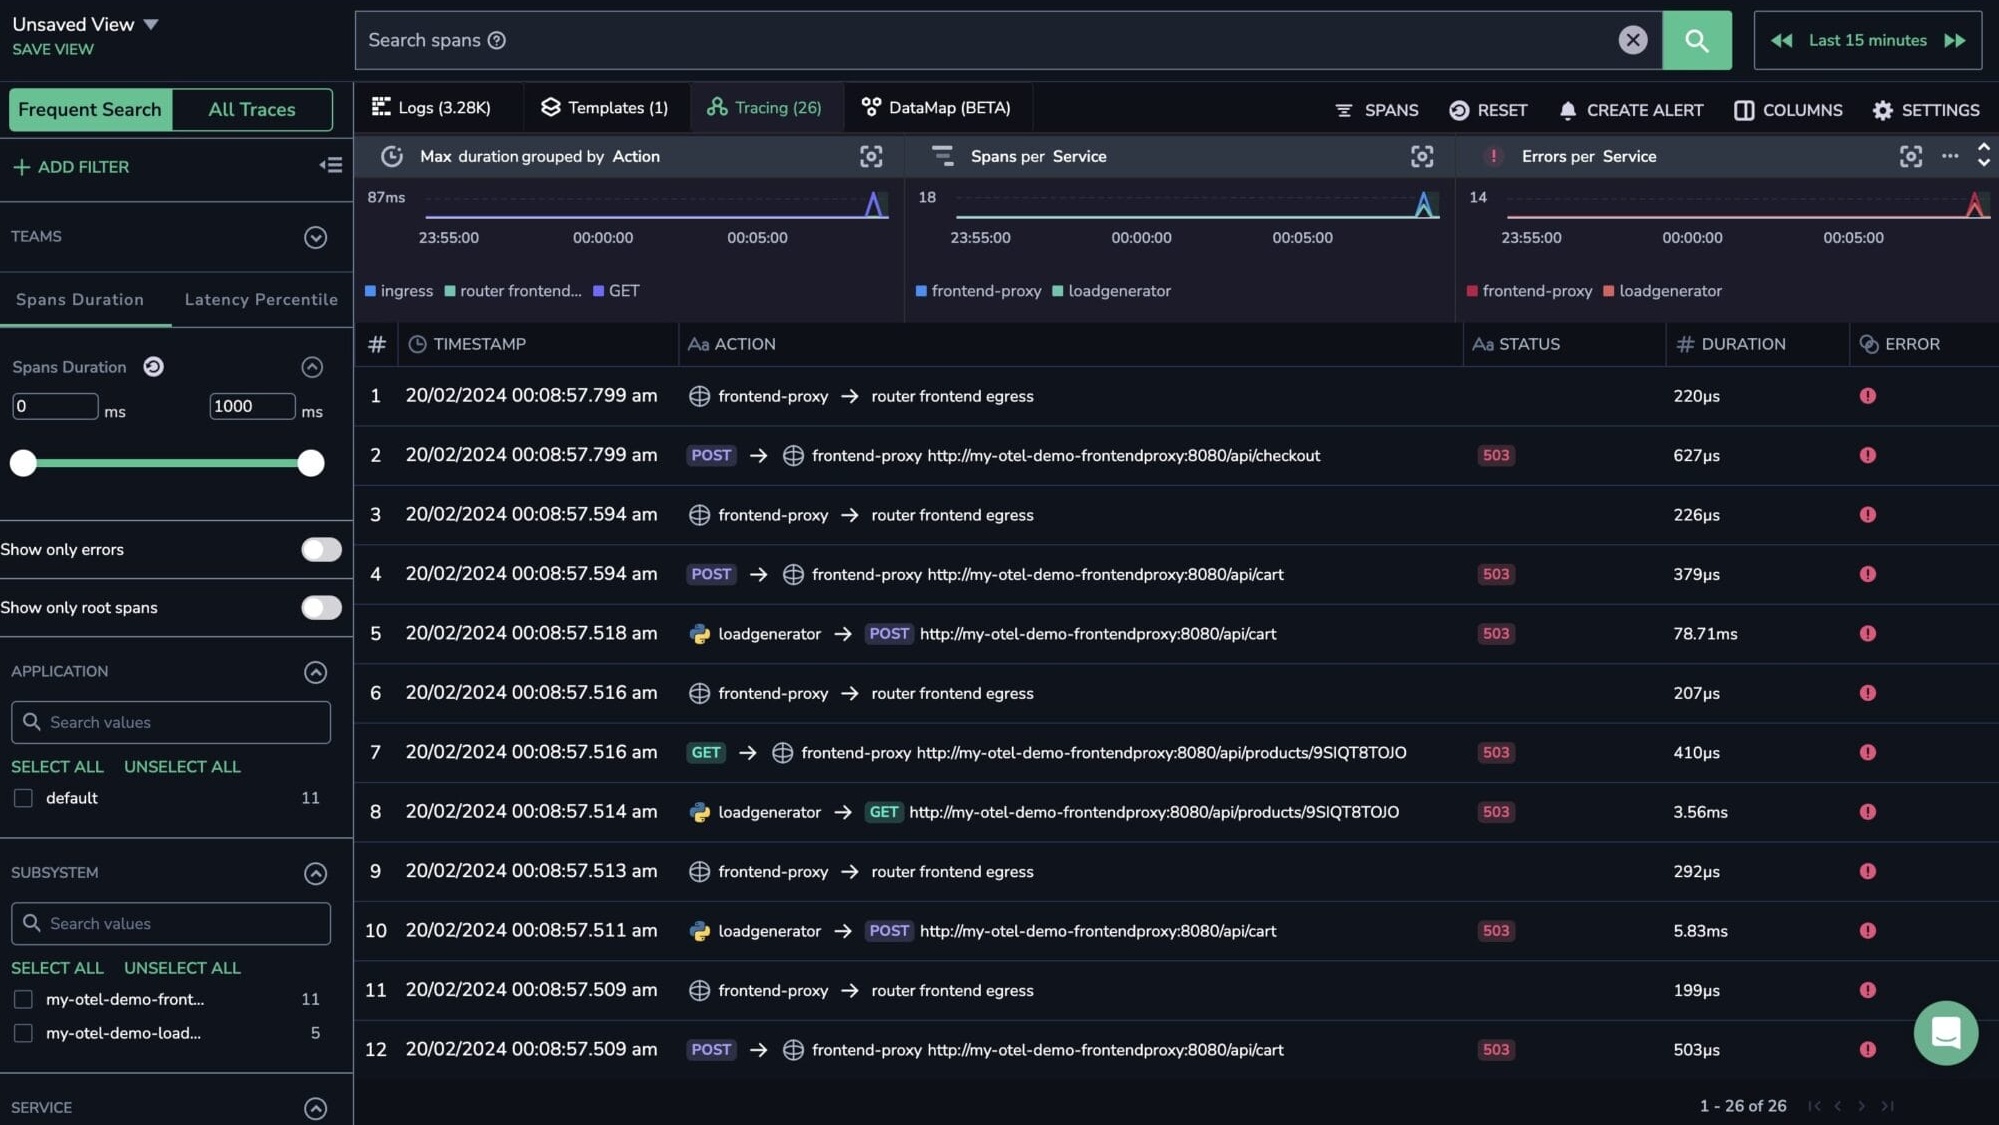
Validation
View your telemetry data in your Coralogix dashboard. Traces should arrive from the tail-sampling load balancer.