Integration troubleshooting
You installed the OpenTelemetry Integration chart, instrumented your applications, and nothing is arriving in Coralogix. Two things are usually responsible:
- The Helm installation failed, or the collectors are not healthy.
- Your application is not sending to the collector.
Work through the checks below in order. Each one narrows down which of the two it is.
Check the agent logs
It appears once, with the installation name you chose:
kubectl get pods -o wide -n $NAMESPACE | grep opentelemetry-agent
Its STATUS should be Running. Pending means it has not scheduled yet. Rerun the command. AGE should match the time since your last Helm upgrade; anything much older suggests the upgrade did not take.
Copy the pod's full name from the output above. The --follow flag live tails the logs in your terminal:
kubectl logs --follow <opentelemetry-agent-pod-name> -n <namespace>
Check the cluster collector
Missing data, or an incomplete view such as absent Kubernetes events, usually points here.
The agent, the cluster collector, and Kube State Metrics all need to be up:
kubectl get pods -o wide -n $NAMESPACE
NAME                                                  READY   STATUS    RESTARTS   AGE   IP              NODE                                               NOMINATED NODE   READINESS GATES
coralogix-opentelemetry-agent-jhl6q                   1/1     Running   0          43m   172.31.27.209   ip-172-31-27-209.ap-southeast-1.compute.internal   <none>           <none>
coralogix-opentelemetry-collector-84d684d45c-2h4rt    1/1     Running   0          43m   172.31.31.122   ip-172-31-27-209.ap-southeast-1.compute.internal   <none>           <none>
otel-integration-kube-state-metrics-bbc57cd9b-9kgrp   1/1     Running   0          43m   172.31.18.170   ip-172-31-27-209.ap-southeast-1.compute.internal   <none>           <none>
If any is missing or not Running, pull its logs before going further.
Check the Kubernetes OpenTelemetry extension in your Coralogix account is on the latest version, with all relevant Applications and Subsystems selected.
Select Grafana, then Dashboards, then Manage, and open the K8sOtel folder. A populated dashboard looks like the one below.
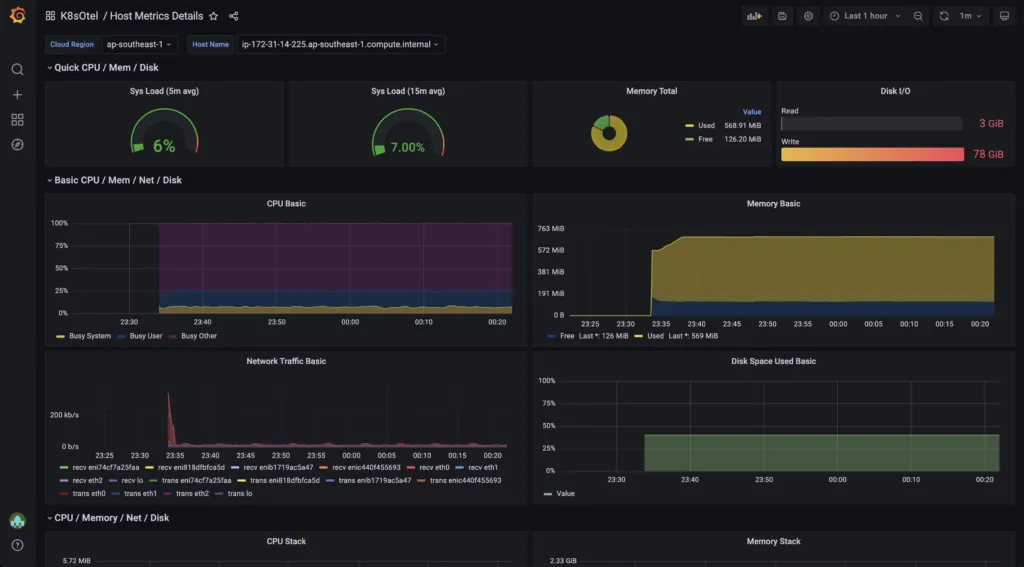
Shows a healthy dashboard. Panels reading No data instead mean either telemetry is not being exported from the collectors, or a component on the collector is misconfigured.
Test endpoint connectivity
Validate that the cluster can resolve your OpenTelemetry endpoint. This command creates a temporary busybox pod, runs nslookup against the endpoint, and cleans up after itself:
kubectl run busybox --image=busybox:1.28 --rm -it --restart=Never -- nslookup ingress.eu2.coralogix.com:443
A successful lookup returns the server and the resolved address. An error means the cluster cannot reach the domain server, a networking or DNS problem outside the Collector.
Check the chart configuration
Unexpected behavior, wrong telemetry, or a failed Helm install usually means values.yaml does not match the structure the chart expects, or your overrides did not apply.
The rendered ConfigMaps show the configuration as the collectors received it, overrides included:
kubectl get configmap -n $NAMESPACE
NAME                                DATA   AGE
coralogix-opentelemetry-agent       1      4d
coralogix-opentelemetry-collector   1      4d
kube-root-ca.crt                    1      118d

kubectl get configmap -n otel -o yaml coralogix-opentelemetry-agent
kubectl get configmap -n otel -o yaml coralogix-opentelemetry-collector
For background on how the overrides are templated, see Helm values files.
Next steps
Read the Kubernetes Observability using OpenTelemetry FAQs.