All teams and team drill-down
All teams
The All teams table compares every team you can see. Search by name, and select a column header to sort by it.
| Column | Description |
|---|---|
| Team name | The team's display name |
| Company ID | The team's numeric company identifier |
| Retention | How long the team's High (Frequent Search) data stays in Coralogix hot storage (OpenSearch), in days. See TCO Optimizer |
| PAYG | Whether pay-as-you-go is enabled for the team |
| Write access | Whether the team can write to the dataplan.usage_events dataset, shown as Enabled or Disabled. Set in Dataspace Management, not by role permissions. See Dataset management |
| Daily quota | The team's allocated daily quota, with a fill bar |
| Max usage | Usage on the single heaviest day in the selected range |
| Min usage | Usage on the single lightest day in the selected range |
| Avg usage | Average daily usage in the selected range |
| PAYG usage total | Pay-as-you-go usage in the selected range |
| Block days | Days the team's data was blocked because quota was exhausted |
| Est. blocked units | Estimated units blocked as a result of quota exhaustion |
Use Show non-member teams in the actions menu to include teams in the organization that you are not a member of, and Hide non-member teams to exclude them again. This control changes what the table lists. It does not change which teams you are permitted to see.
Teams flagged as audit destinations are excluded from the organization-level counters, so the organization total stays aligned with your purchased quota. They are left out of the team table, the usage graph, and the filters as well.
Query several teams at once
Multi team query builds a DataPrime query over the dataplan.usage_events system dataset for the teams you select, so you can investigate logs, compare team activity, or build a cross-team dashboard from the same scope you were just reading.
- Select the checkbox on each team you want to include. The count next to All teams shows how many of the listed teams are selected.
- Select Multi team query. Until you select a team the button is disabled, with the tooltip
Select at least one team to generate a query. - Copy the query with Copy DataPrime query, or select Open in Explore Logs to run it straight away.
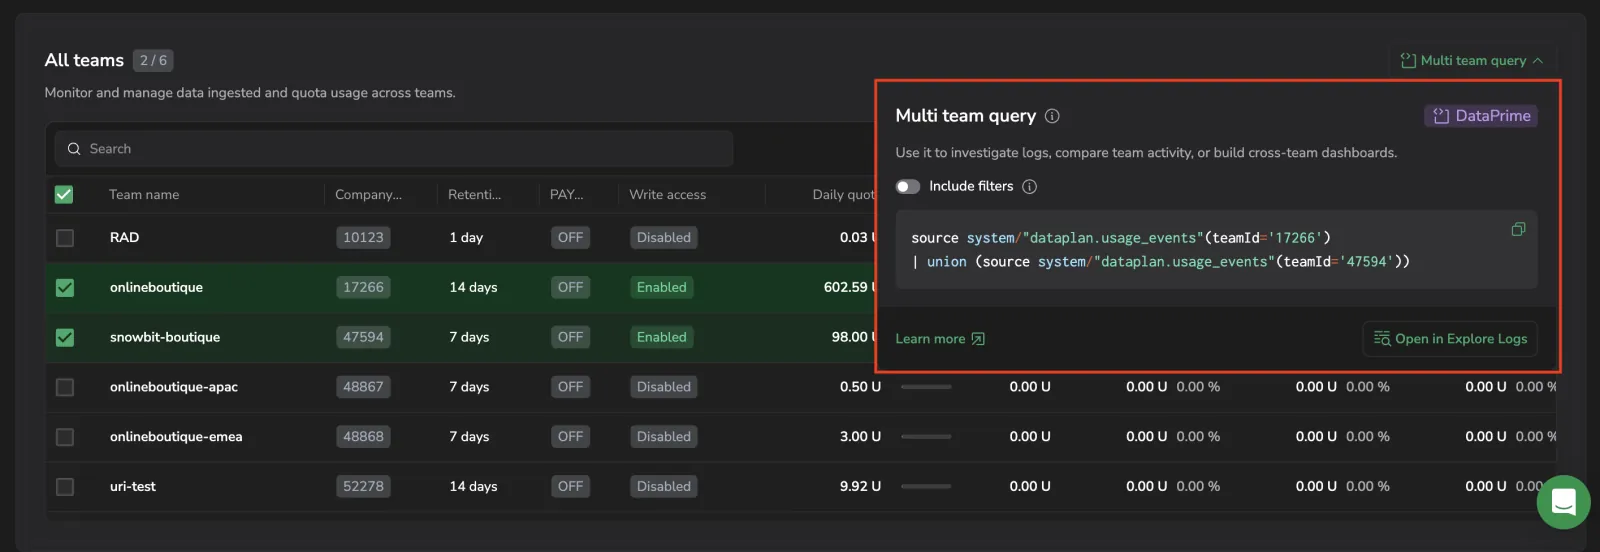
One selected team produces a single source statement. Each additional team is appended as a union, so the result is one combined view rather than one query per team.
Turn on Include filters to carry the page's current context into the query. The selected time range becomes a $m.timestamp predicate, and each condition in Filtered by becomes its own filter line. The tab you are on is not included, because the measurement it selects is not a field on the dataset.
Queries longer than three lines collapse, with Show more and Show less to expand and re-collapse them.
A team can only be selected when the dataplan.usage_events dataset is registered for it and you have read access to that dataset on it. Write access is reported separately in the Write access column and does not affect selection. If a selected team stops being eligible, it is ignored and named in a tooltip on the button.
Drill into a team
Select a team row to open a drawer with that team's own usage. The drawer renders the same view a member of that team sees on this page, so the cards, chart, and breakdown are scoped to that team alone rather than to the organization.
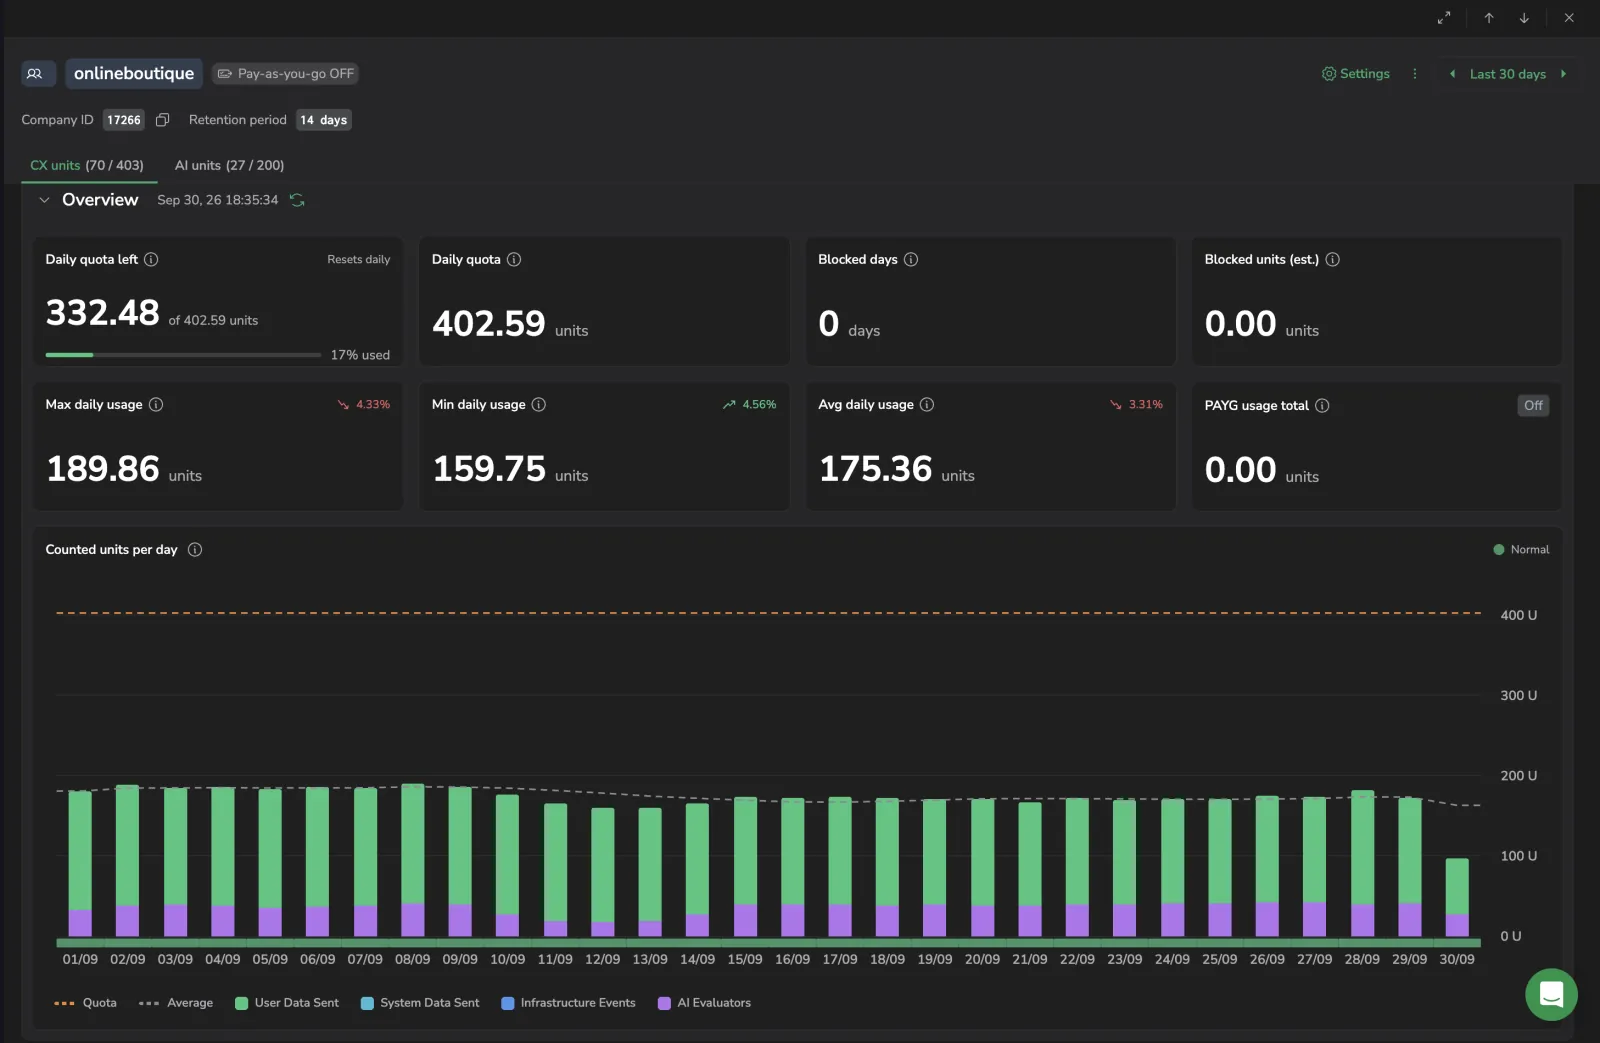
Opens the selected team's overview, with its company ID, retention period, and pay-as-you-go state in the header.
The drawer opens on the tab you were viewing and with the page's time range, then tracks its own tab and range independently. Select the team name at the top of the drawer to open the team list. The name itself is the control, there is no separate dropdown. Search the list by name, or use the up and down arrow buttons in the drawer toolbar to step to the previous or next team in table order. The list offers exactly the teams the All teams table currently shows, and each entry carries an info peek with its company ID, pay-as-you-go state, and retention period. Expand the drawer to fullscreen for more room.
Collapse the drawer's Overview to read the summary as a strip and give the Usage breakdown table the full height. The breakdown lists usage per measurement, with pillar, entity type, and priority columns, a total units column, and one column per day in the range, each showing units and its share of the total. Expand a row to break it down further, and sort the table by date or by any value column.
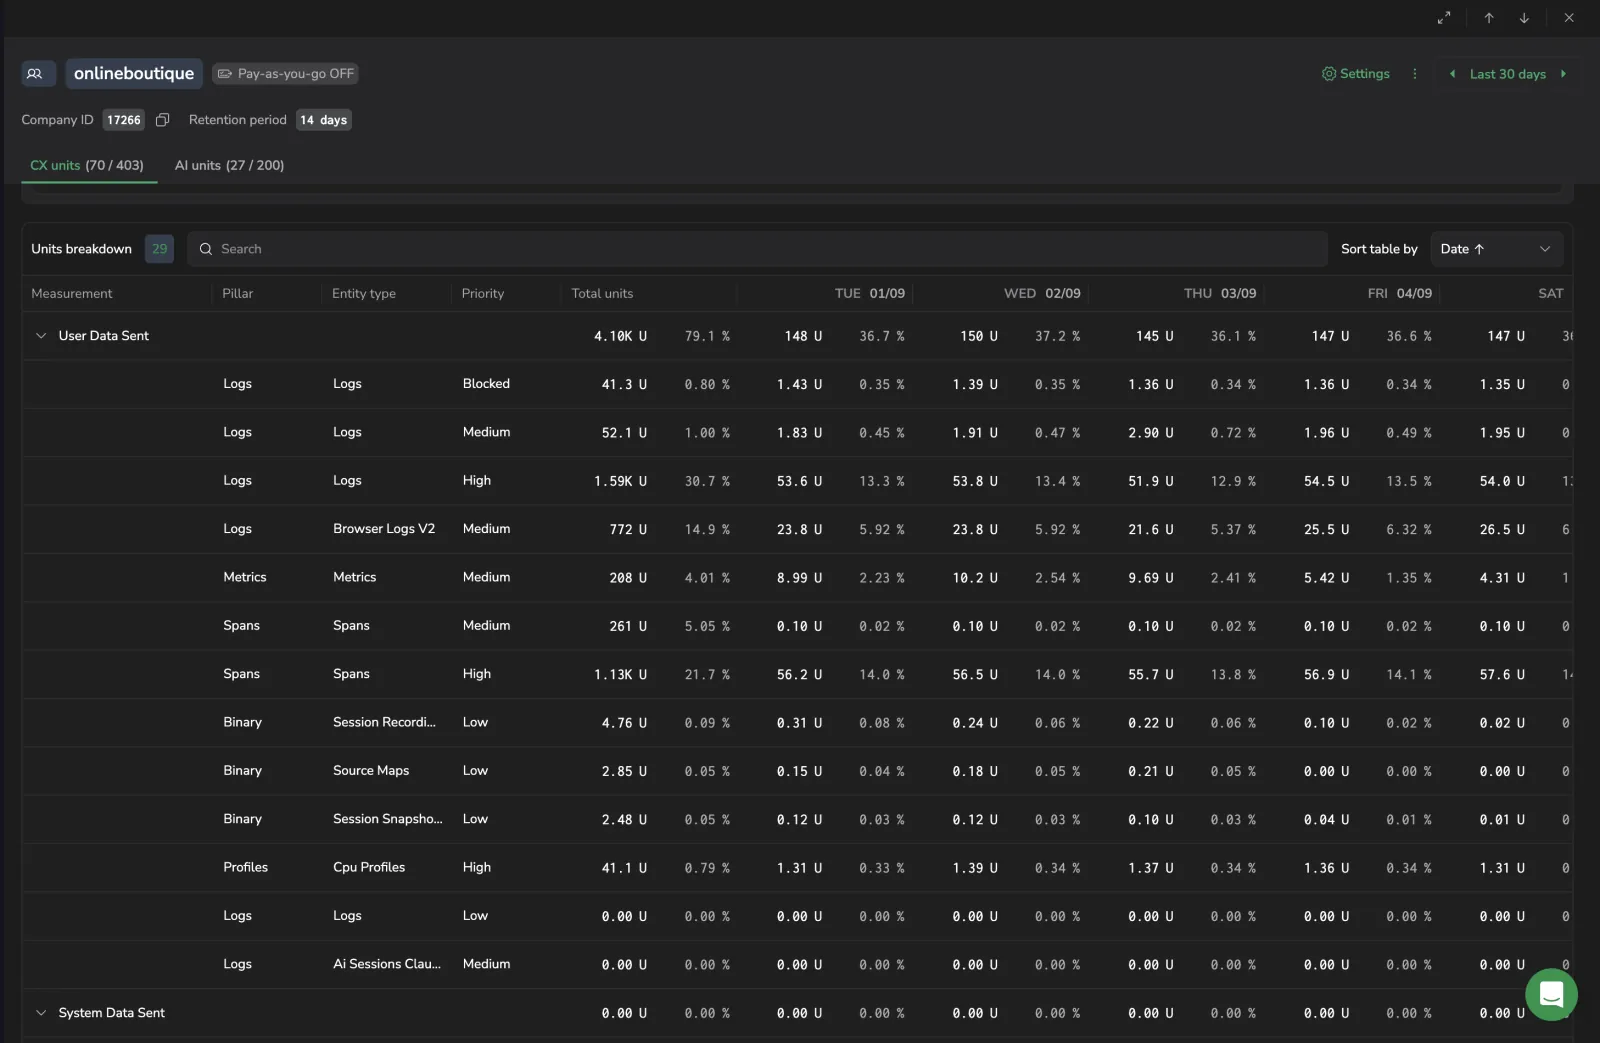
Drilling into a team is a read-only lens. It does not change the team you are signed in to, so the rest of the navigation continues to resolve against your own selected team, and closing the drawer returns you to the aggregate unchanged.
Two limits apply inside the drawer:
- The AI units tab shows AI Center usage only. Olly usage is reported for the team you are signed in to, so it is unavailable for another team.
- Quota history is not drawn on the drilled-in team's chart.