Monitor usage and quota across your organization
Usage & Quota answers "how much are we using?" on a single page. The page scope follows your permissions: an organization administrator sees every team's usage side by side and can drill into any one of them, while a team member sees their own team's usage in the same layout. It replaces the separate Data Usage and Quota Manager screens, which both remain available during the transition.
What you need
- To see the organization-wide view, you must be an organization admin with organization quota read or manage access. Read access is enough to view the page; moving units requires manage access.
- To see the single-team view, you need
DATA-USAGE:READ. See Permissions.
Access the page
In the Coralogix UI, go to Settings, then Usage & Quota, under Organization.
While the transition is in progress, the previous entries remain in the navigation as Data Usage (Legacy) and Quota Manager (Legacy). Both open Usage & Quota and keep any query parameters from the original link, so existing bookmarks and shared links continue to work.
Two views, one page
The page renders one of two views based on your permissions. The title, tab row, time picker, and usage components are the same in both.
| Organization admin | Team member | |
|---|---|---|
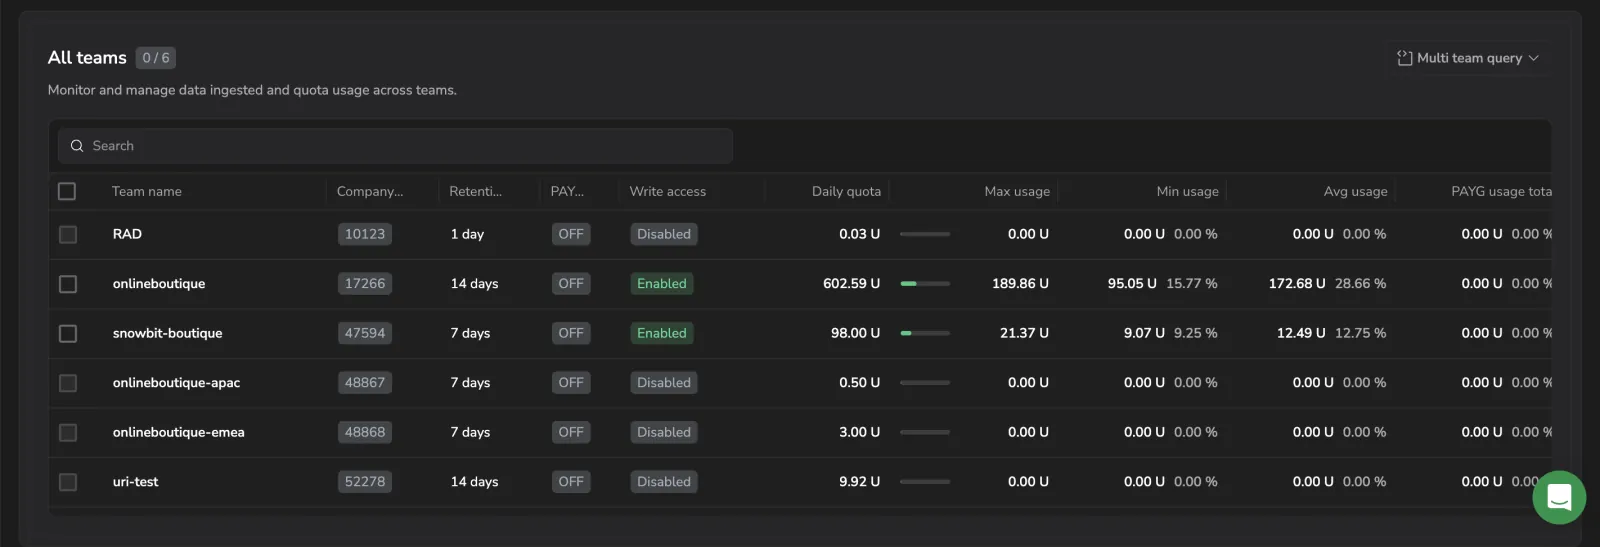
| Overview strip | Aggregate across every team in the organization | Your team only |
| Main area | All teams table | Your team's usage graph and breakdown |
| Drill-down drawer | Available from any team row | Not applicable |
| Move units | Available | Not shown |
A team member never sees organization-wide figures. Counts such as the number of teams affected by blocking, or how many teams have pay-as-you-go enabled, appear only in the admin view.
Usage tabs
Five tabs scope the page to a data category:
- User data sent: user-generated telemetry, broken down by entity type and TCO priority
- System data sent: Coralogix-generated metadata, such as alert history and audit events
- Infrastructure data: telemetry collected from your cloud and Kubernetes environments
- AI units: AI Center evaluations and guardrails, plus Olly usage. See AI units breakdown
- CX units: daily quota consumption for the CX unit pool
CX units and AI units are separate quota pools. Each is named consistently across its tab, the unit selector, and the card labels, so a figure on one tab is never mistaken for the other pool.
CX units are measured against a daily quota that resets each day. AI units are measured against a monthly allocation that resets at the start of each calendar month.
AI units breakdown
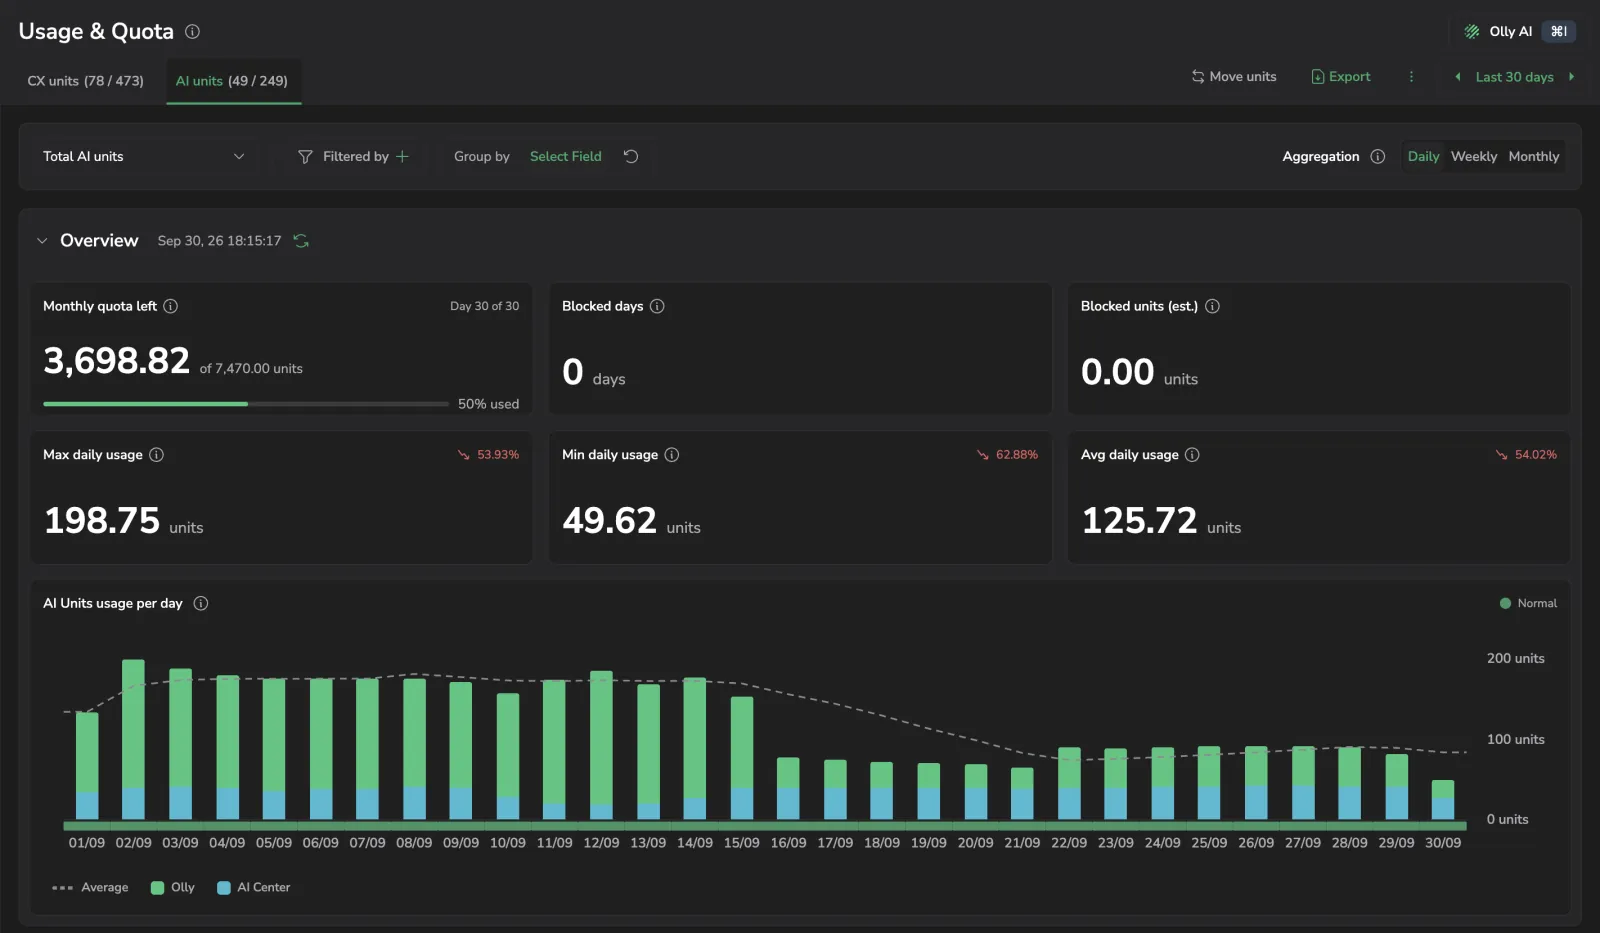
The AI units tab covers every AI-powered feature in one place: Olly and Olly Mini, which bill per user, and AI Center evaluations and guardrails, which bill per team. In the team view it has three sections, each collapsible on its own:
- Total: combined daily AI units consumption across per-user and AI Center usage
- Olly: per-user breakdown with total units, monthly limit, max, min and average daily usage, the daily chart, and a Units breakdown table. The table attributes usage by Identity Type, so human users appear by username and API keys or automations by key name. Free teams also see a free-tier banner here
- AI Center: policy-level breakdown for evaluations and guardrails, with the type in the policy name, for example Toxicity (Eval) or Prompt Injection (Guardrail)
The AI units tab's overview cards differ from the CX units tab: a single Monthly quota left card (with a Day X of 30 tag instead of Resets daily), Blocked days, and Blocked units (est.) in the top row, then Max daily usage, Min daily usage, and Avg daily usage below. There is no PAYG usage total card on this tab. The chart is titled AI Units usage per day and stacks Olly against AI Center rather than by entity type.
Two admin controls cap AI consumption:
- Use Quota rules to cap the team's total AI units on the
ollyentity type. - Use Olly usage management to cap individual users and automations.
In the drill-down drawer, this tab shows AI Center usage only.
Pool status indicators
The CX units and AI units tabs carry a status dot when their pool needs attention:
- Red: the pool is blocked. The tooltip names the pool and, for an admin, how many teams are blocked and over how many days.
- Yellow: the pool is projected to block. It appears above 80% of quota. For an administrator, yellow means one or more teams have each passed 80% of their own quota, and the tooltip names how many. It is not an organization-wide total crossing 80%. For a team member, the tooltip reports the percentage used and the days left in the current calendar month.
A red dot takes precedence over a yellow one. Dots are visible from any tab, so you can be on CX units and still see that the AI pool is blocked. A pool with no dot is either healthy or has no quota allocated to measure against. Dots appear on the page tab row, not inside the drill-down drawer.
Overview
The Overview section summarizes the selected scope and time range. It opens collapsed in the organization view and expanded in the team view. Expand it for the full card grid and the daily usage chart, or collapse it to read the values as a compact strip. A timestamp shows when the data was last fetched, and you can refresh it in place without collapsing the section.
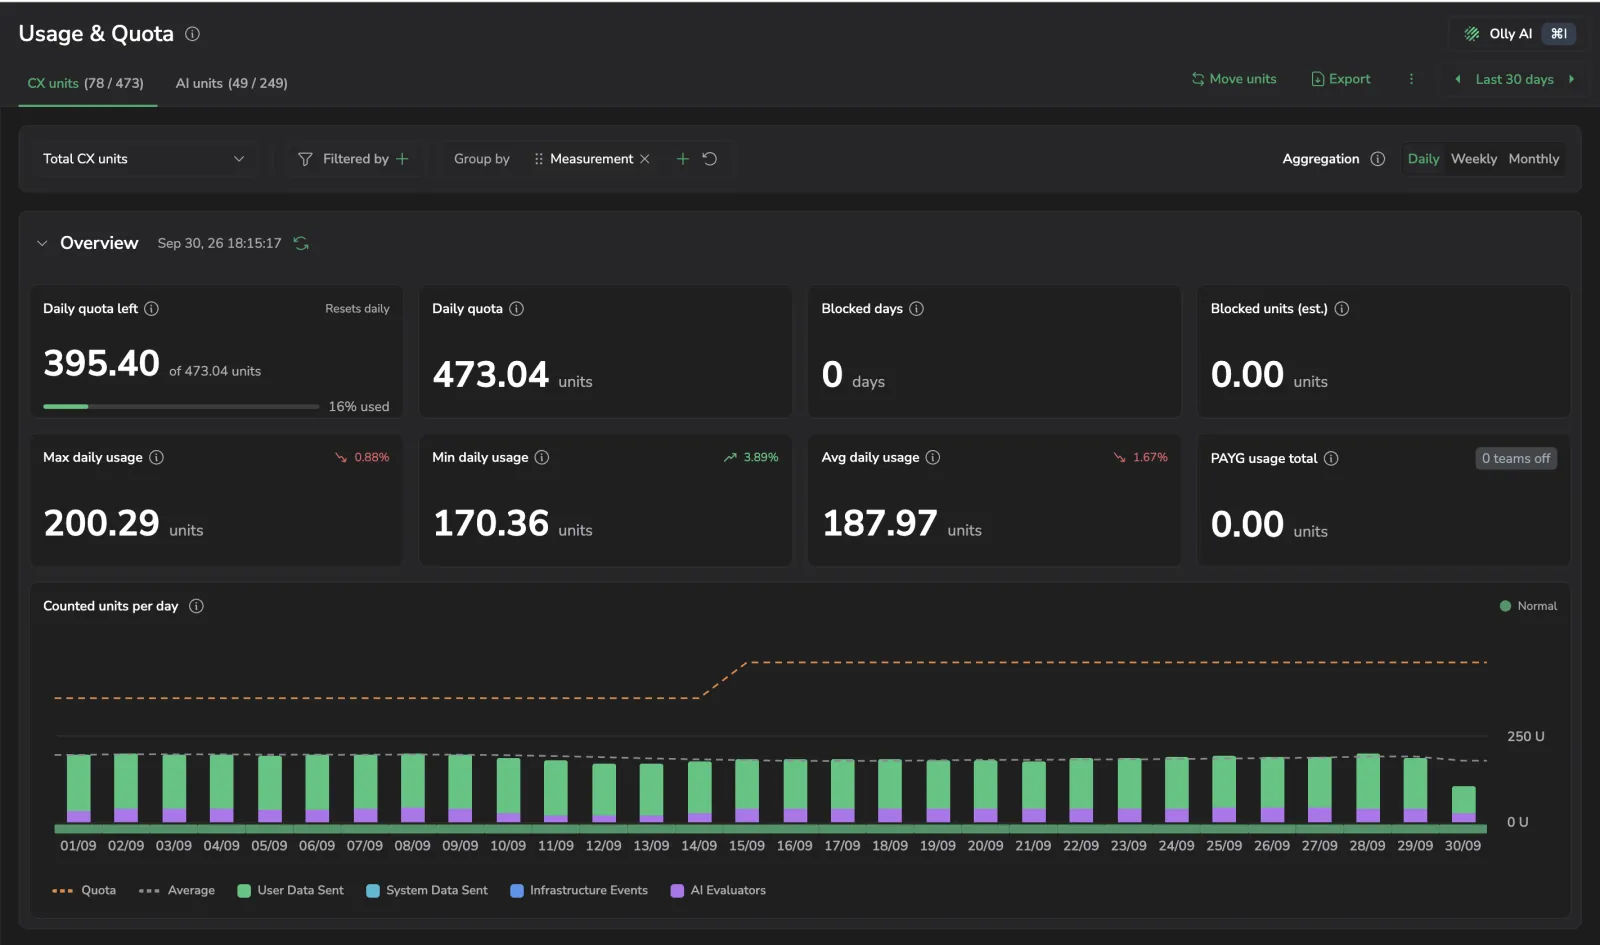
On the CX units tab, the cards cover allocated quota, current usage, blocked days, estimated blocked units, and the maximum, minimum, and average daily usage for the period, plus pay-as-you-go usage: Daily quota left, Daily quota, Blocked days, Blocked units (est.), Max daily usage, Min daily usage, Avg daily usage, and PAYG usage total. Max daily usage and Min daily usage report the single heaviest and lightest day in the range, so over a 7-day window they name the busiest and quietest of those seven days rather than a rolling figure. The Max daily usage, Min daily usage, and Avg daily usage cards carry a trend badge comparing the second half of the period to the first half. The Daily quota left card shows a progress bar with the percentage used, and a Resets daily tag. These same eight cards and labels appear in both the organization and team views.
Other tabs follow a different card set. See AI units breakdown for how the AI units tab differs.
Blocked units are estimates based on the current ingestion rate and can change during the day.
The chart below the cards (titled Counted units per day on the CX units tab, or Data sent per day on other tabs) stacks usage by whatever fields are currently selected under Group by (Measurement by default), with a dashed average line and a dashed quota line. Usage annotations overlay daily quota status on the chart and are on by default. Select Hide usage annotations in the actions menu to remove the layer, and Show usage annotations to bring it back.
Ask Olly
Select Olly AI in the page header, or press Cmd+I / Ctrl+I, to open the Olly drawer scoped to the usage you're viewing. Olly picks up whether you're on the organization or team view, the open tab and scope, the time range, aggregation, Group by fields, and filters as a removable context chip, and the chip updates as you change them. The figures themselves aren't copied from the page: Olly reads them from your data usage telemetry. Ask whether you're on track for quota, what's driving CX units, or where your AI units are going without describing your view first. The drawer also offers quick-query prompts for this page. See Ask Olly on data pipeline screens.
See Ask Olly for how page context works across Coralogix.
Resources
This guide continues across a few focused pages:
- All teams and team drill-down: the All teams table, multi-team DataPrime queries, and the per-team drill-down drawer
- Filter, group, and aggregate: narrowing, breaking down, and bucketing the data on the page
- Move units between teams: rebalancing daily quota between teams
- Export a report: downloading or generating usage reports
- How usage is measured: units, entity types, and pricing
Permissions
| Resource | Description | System roles | API presets |
|---|---|---|---|
DATA-USAGE:READ | View Data Usage Metrics. | Data Admin, Platform Admin | DataUsage |
DATA-USAGE:MANAGE | Enable and disable Data Usage Metrics. | Data Admin, Platform Admin | DataUsage |
TEAM-QUOTA:READ | View your team's quota. | Platform Admin | - |
TEAM-QUOTA:MANAGE | Manage team quotas. Move quotas between 2 or more teams for which you have manage permissions. | Platform Admin | - |
The organization-wide view and Move units additionally require organization quota access, which is granted with the organization admin role.