Create and manage policies
Policies and filters
A TCO policy is defined by:
- A filter that selects which logs, traces, or RUM events the policy applies to
- An action: route and store the matched data, or block it
- One or more destinations, each with its own policy type, priority, and archive retention
Policy list columns
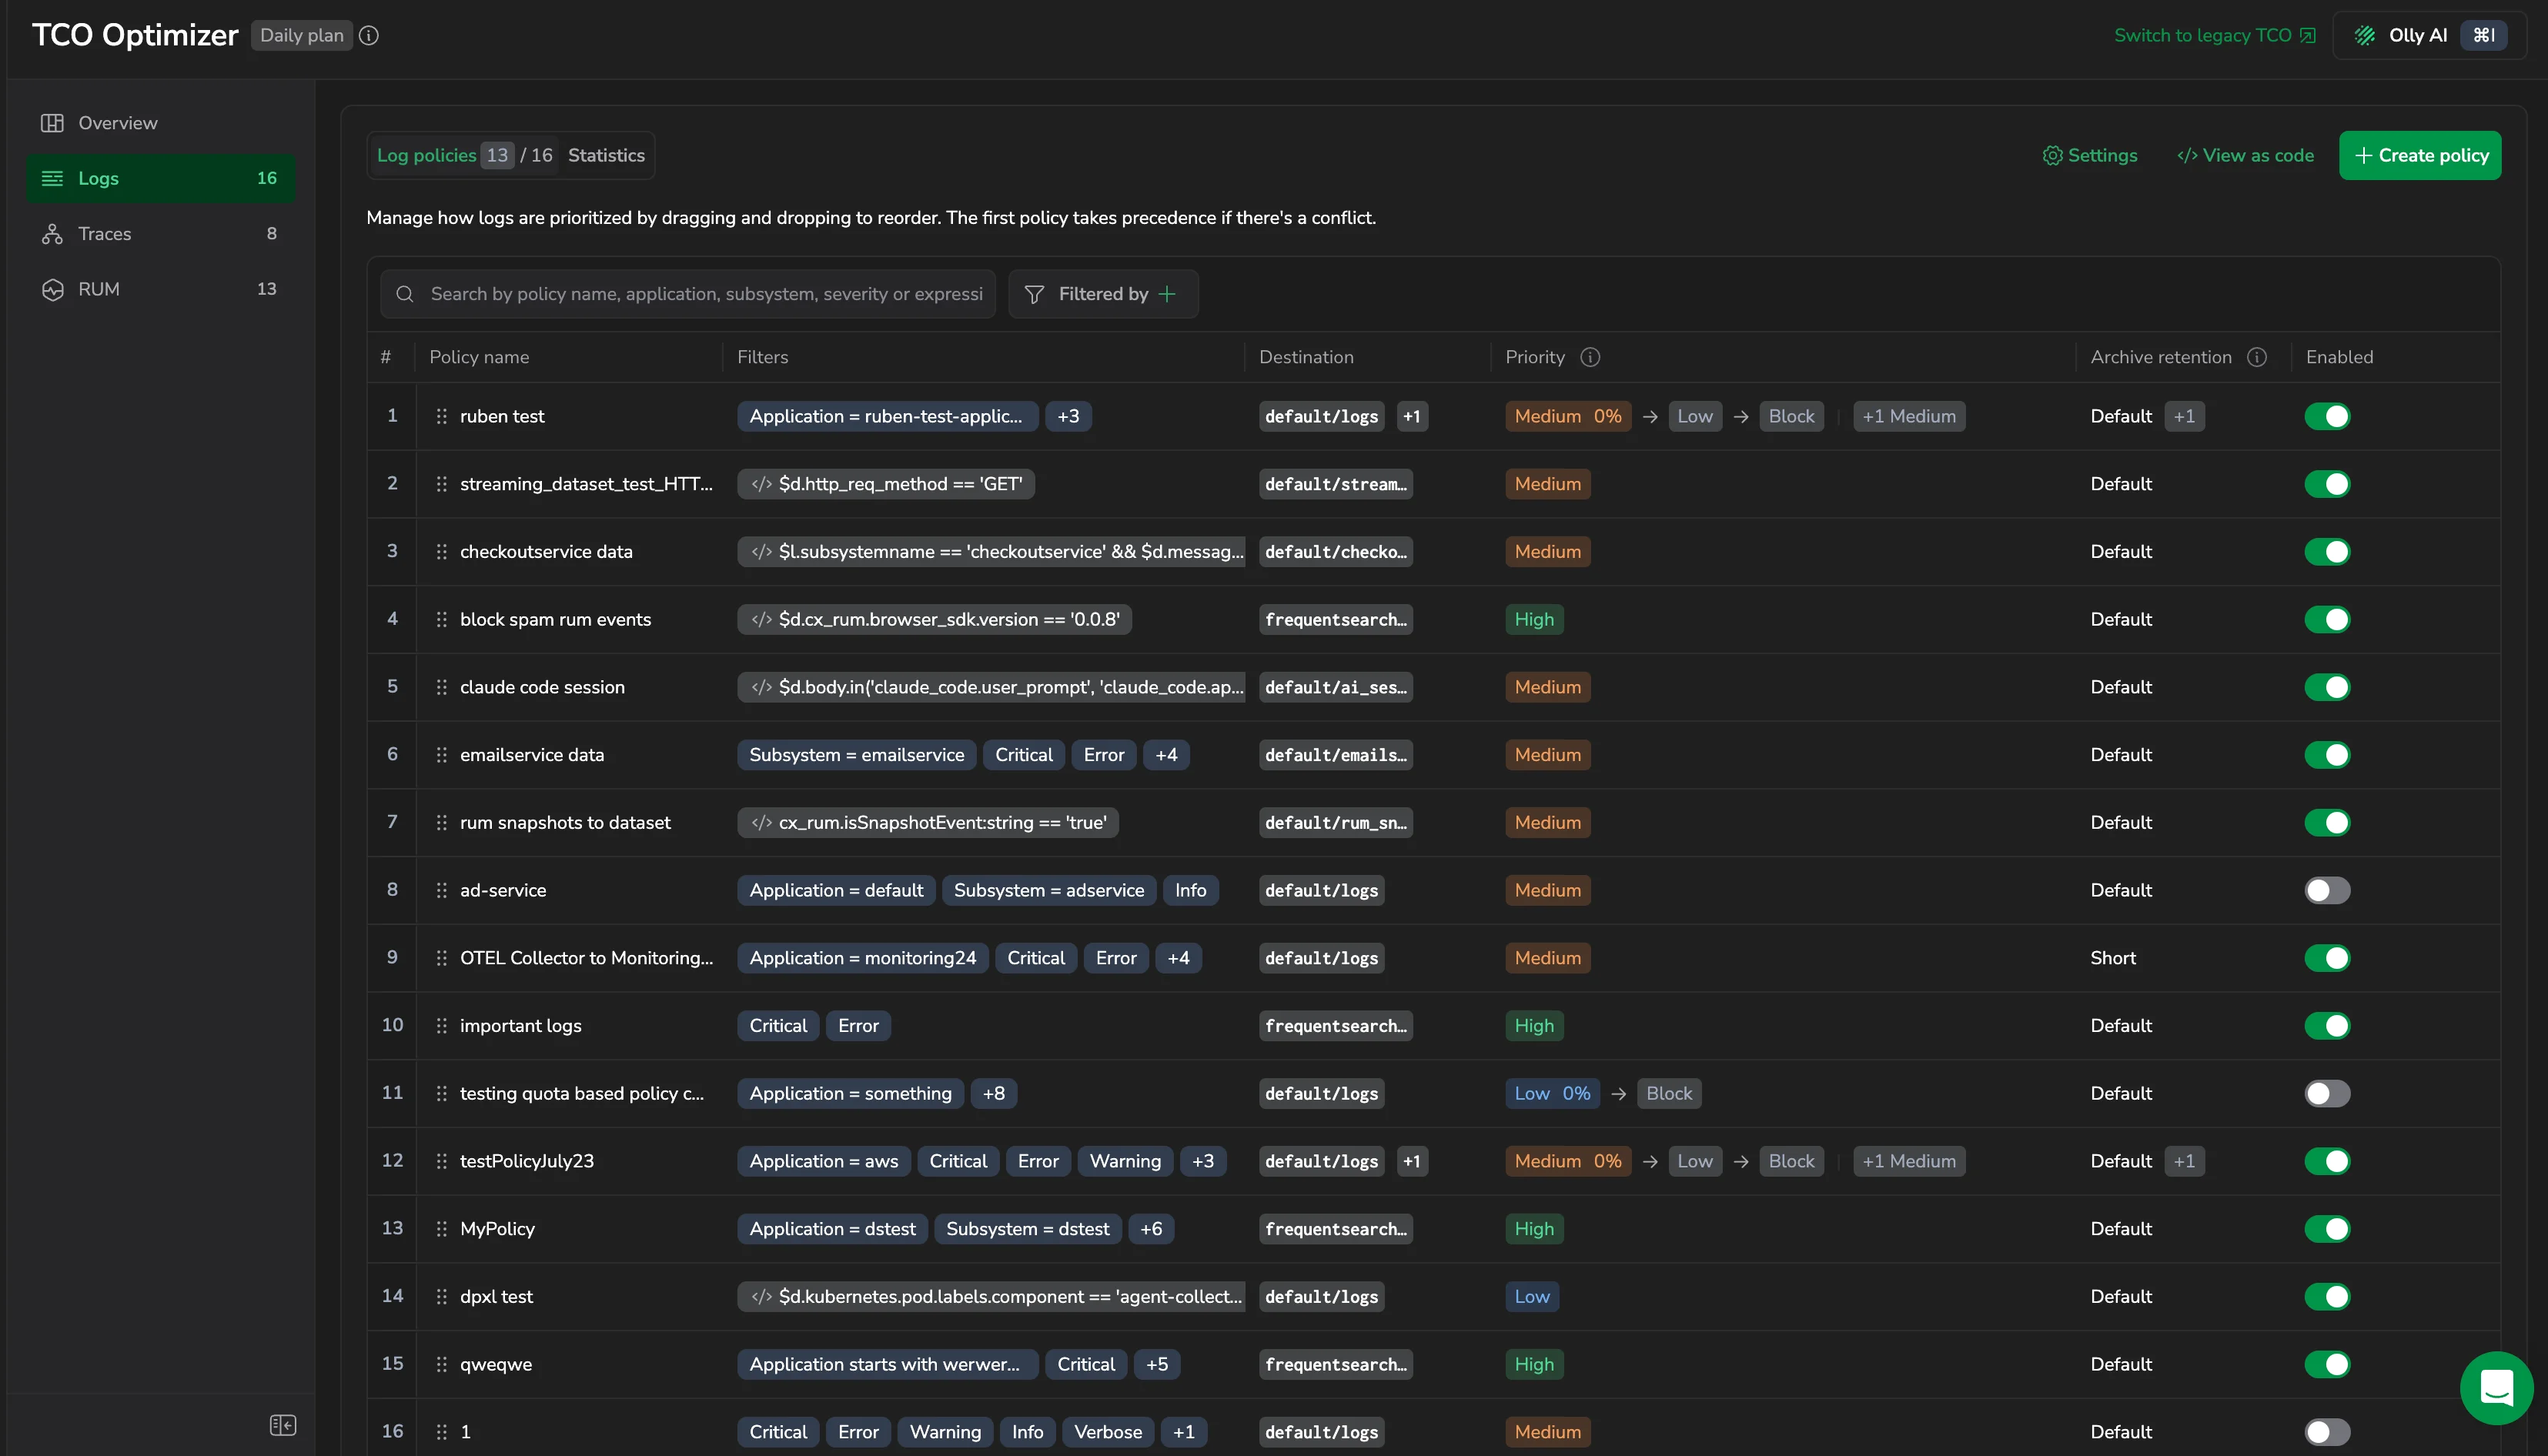
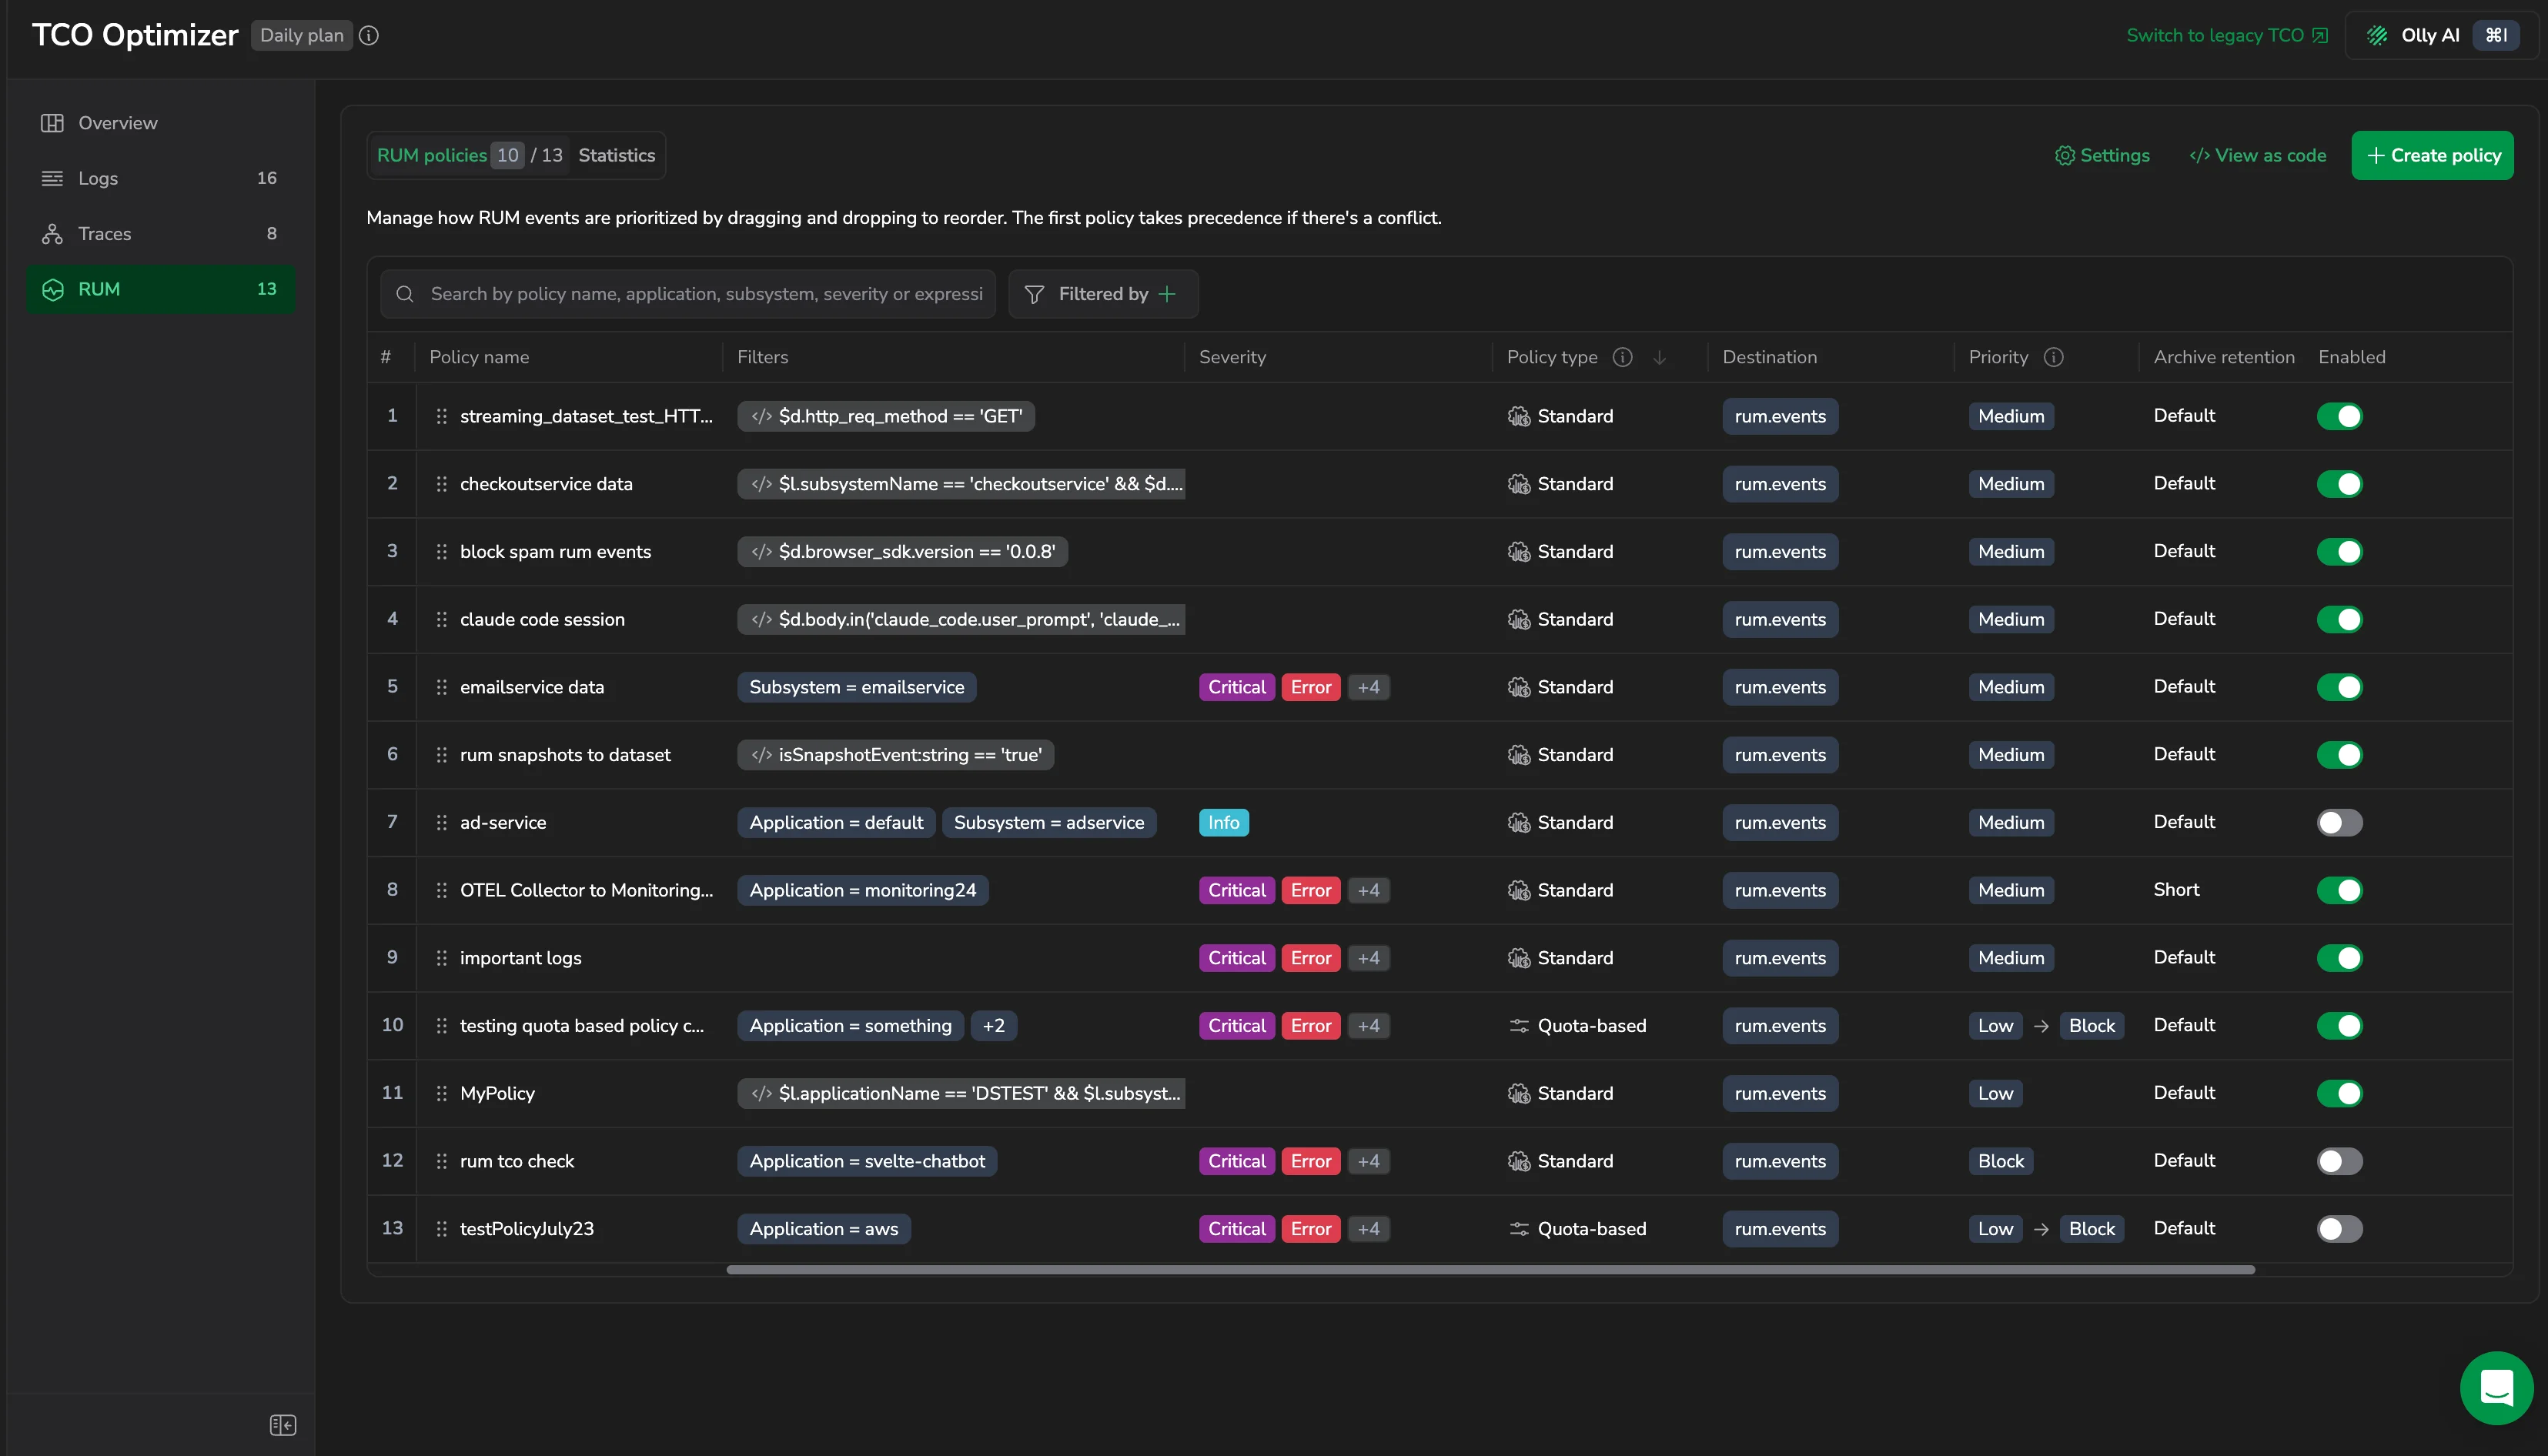
The policy table on the Logs and Traces tabs shows, for each policy: # (evaluation order), Policy name, Filters, Destination, Priority, Archive retention, and Enabled. The RUM tab adds Severity and Policy type columns.
- Policy type (RUM tab) shows whether the policy routes as Standard or Quota-based. On the Logs and Traces tabs, a quota-based policy is recognizable by the priority chain in its Priority cell.
- Destination shows the dataset each copy of the matched data is routed to. A policy with a second destination shows the first one followed by a +1 badge, and Archive retention does the same.
- Priority shows the priority configured for the policy. For a quota-based destination the active priority changes with the daily quota thresholds, and the highlighted priority is the one currently in effect. See Live policy status.
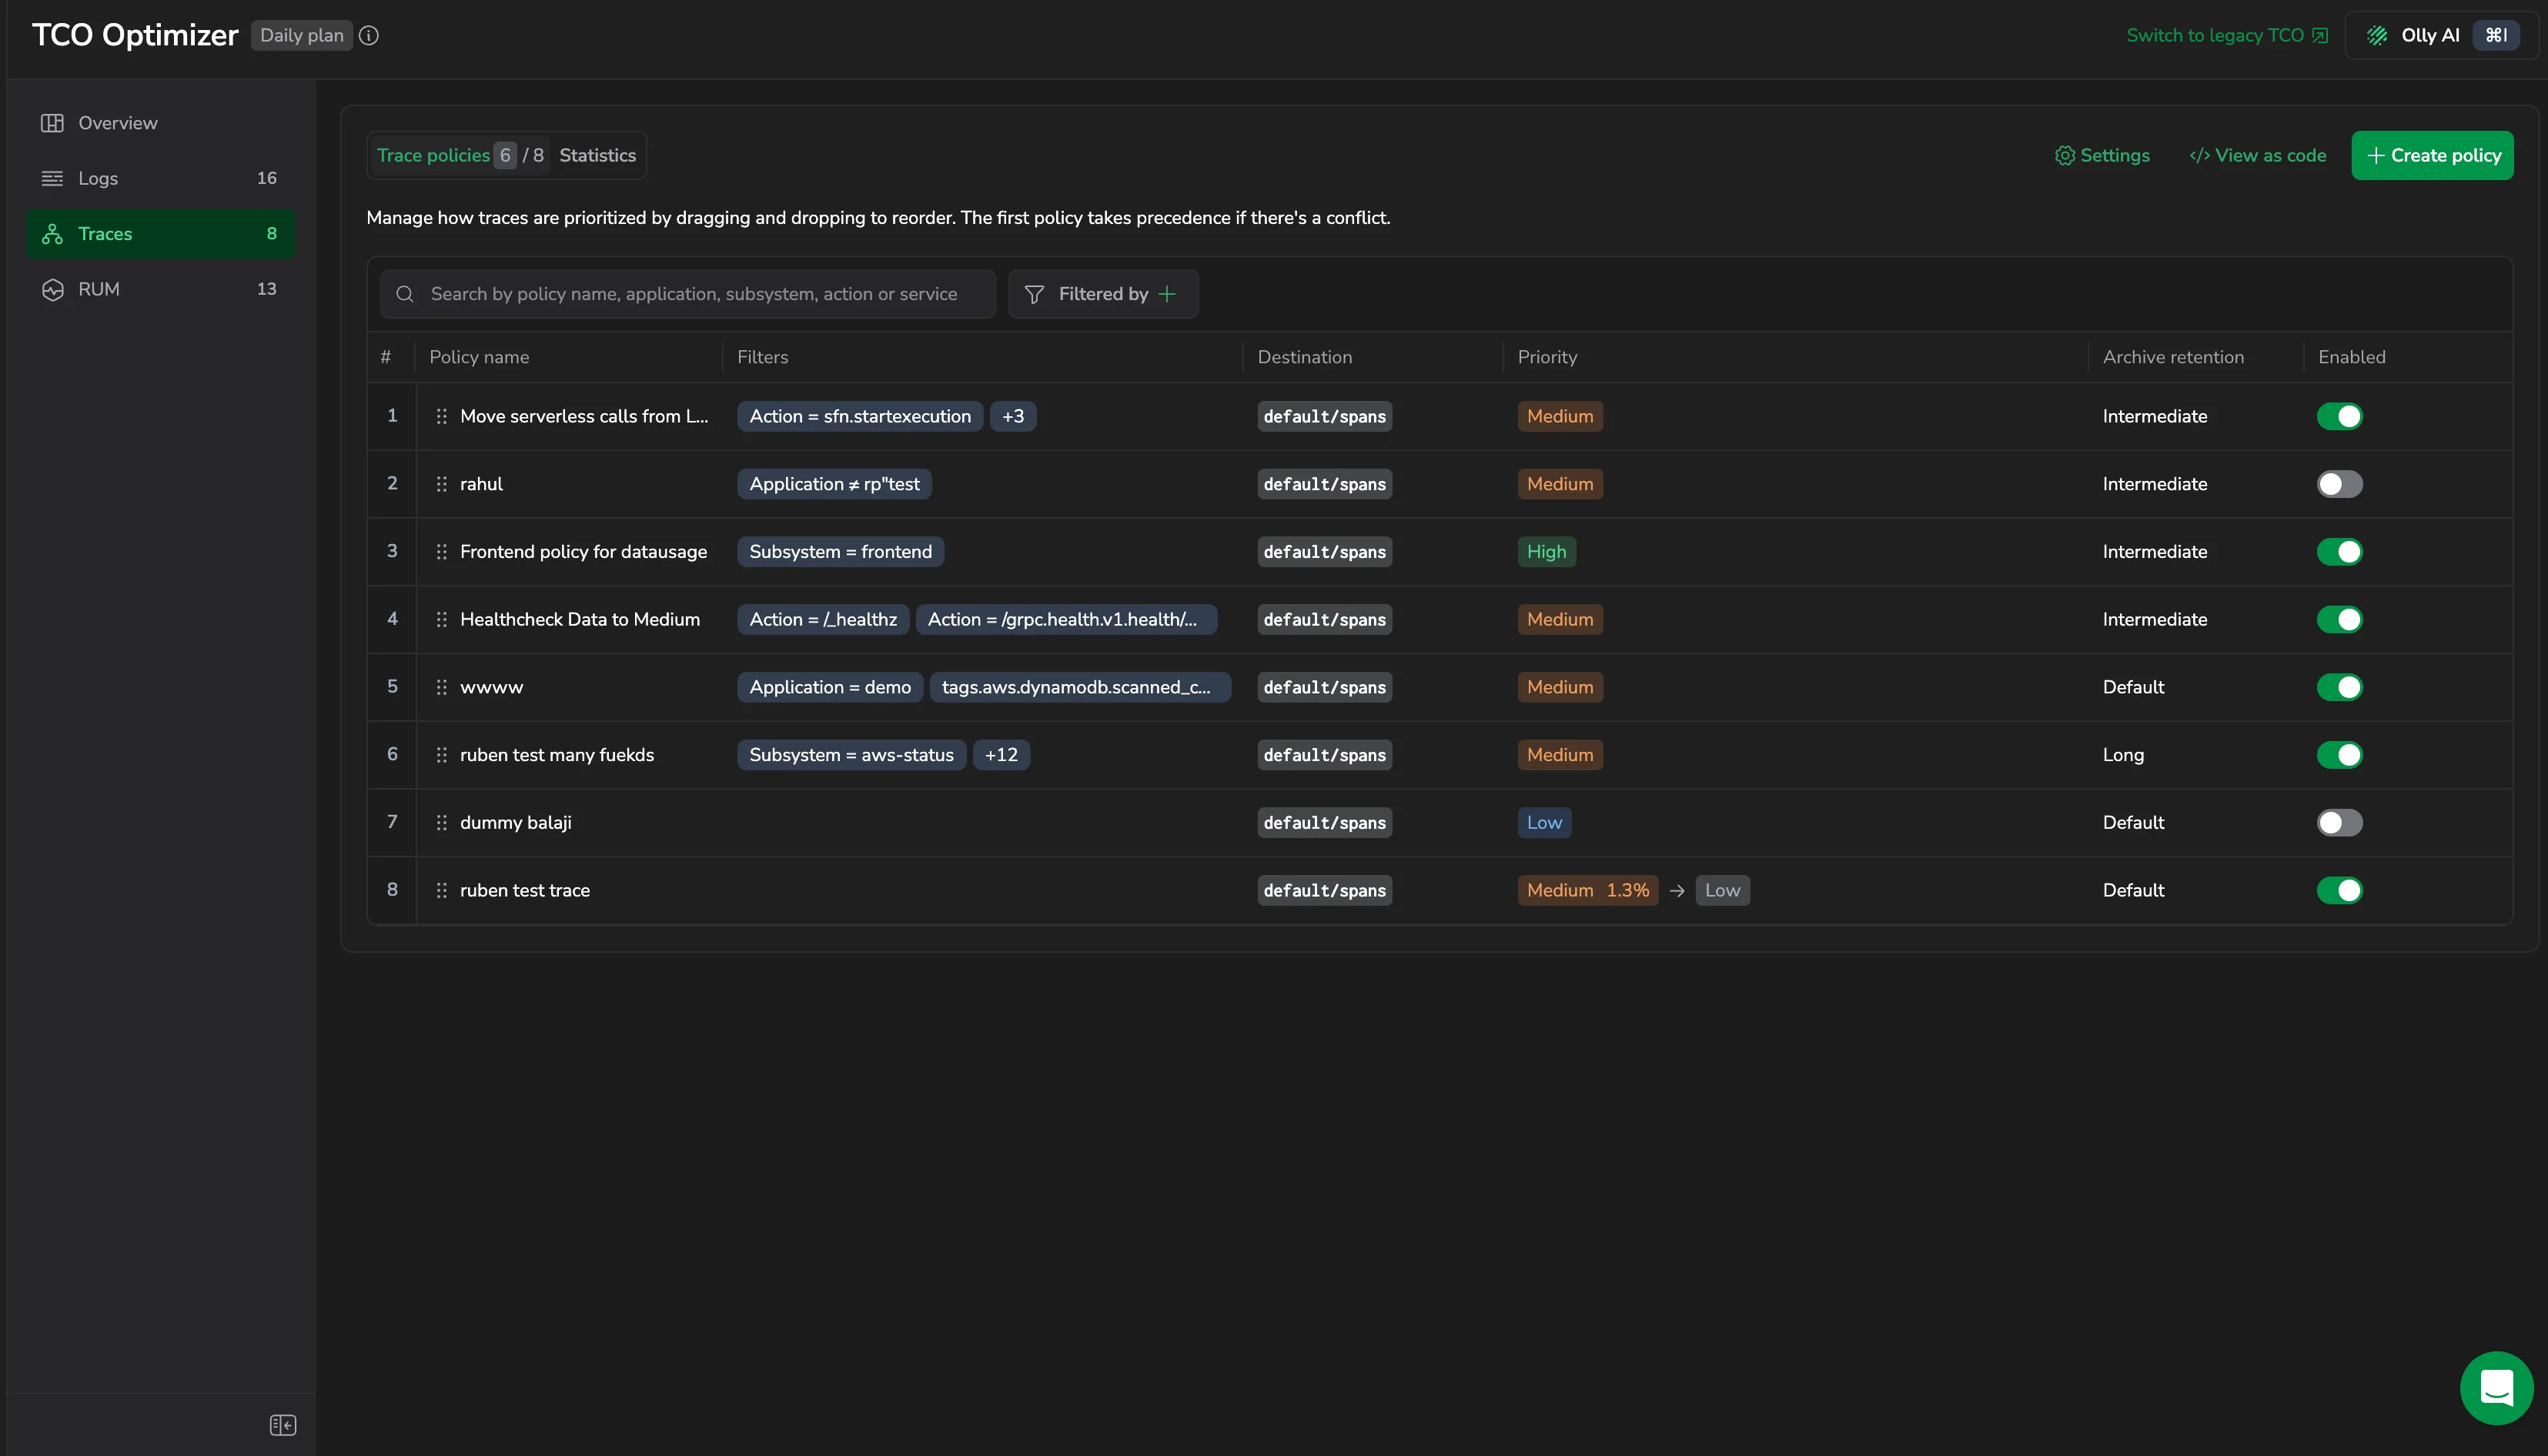
On the Traces tab, the Destination column shows default/spans for every policy, and the Priority column shows the same live policy status as the Logs tab.
Live policy status
The Priority column shows which priority each quota-based policy is in right now, so you can check the effect of a policy change without reading the aggregate in Statistics. It applies to the Logs and Traces tabs.
A quota-based destination shows its whole priority chain, for example Medium 0% → Low → Block. Exactly one priority in the chain is highlighted and carries a percentage. That is the priority currently in effect, and the percentage is the share of the quota used. The other priorities are muted and stay in order, so their position shows which bands the policy has already passed and which are still ahead.
Hover the chain to open a tooltip with the destination (<dataspace>/<dataset>) and every priority in the chain with its quota range, such as 0–3% of quota, with the last priority shown as beyond 16.59% of quota. The tooltip highlights the active priority the same way the table does. When the chain reaches High and an archive bucket is configured, the tooltip adds a note that matched data is also archived to your S3 bucket in the background and that the pair is billed as a single unit.
Example
Take a policy whose Priority section routes the first 3% of your daily quota to Medium, the next band up to 16.59% to Low, and the remaining quota to Block:
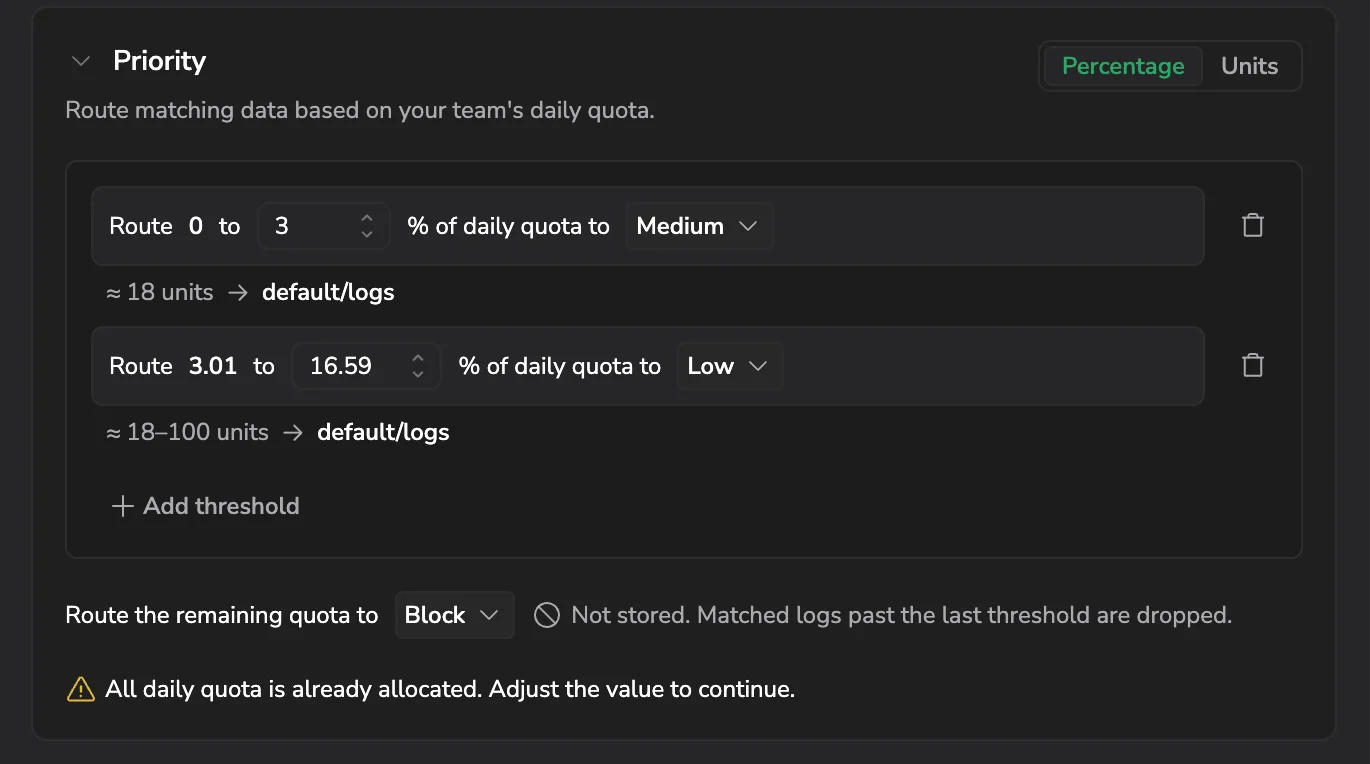
In the policy table, that policy's Priority cell shows the same chain:

- Medium 0% is highlighted because no quota has been used yet, so matching data is currently routed to Medium. As usage passes 3%, the highlight moves to Low, and after 16.59% it moves to Block.
- Low and Block are muted. They are the bands still ahead, in the order the policy reaches them.
- +1 Medium is a second destination of the same policy. The Destination column shows it as +1 next to
default/logs, and the badge shows the priority that destination is currently routing to. Hover it to see its full chain.
When a policy is blocking
A policy blocks data for one of two reasons:
- Set to block. You configured the policy, or the end of its quota chain, to Block. Block appears in the chain as a configured priority, like any other.
- Quota used up. The live priority is the final Block at the end of the chain, so the policy has used the quota it was allowed and is now dropping matching data. This applies at any percentage, because it depends on reaching the final Block, not on reaching 100%. The tooltip adds a note that the quota is used up and matching logs (or spans, on the Traces tab) are being dropped.
Which policies show live status
- Quota-based policies show live status on both the Logs and Traces tabs.
- Standard policies show their one configured priority, without a percentage or any live claim. There is no live signal for a standard route, so the table doesn't guess one.
- No status available. If the status can't be loaded, or doesn't cover a policy, the row shows the configured chain with no highlighted live priority. The table never estimates the live state itself.
Policies with more than one destination
The first destination shows in the Priority column. The other destinations collapse into a +N badge, which can also name the priority of a single hidden destination, for example +1 Medium. Hover the badge to see Also routes to with each hidden destination's chain. A standard first destination collapses to its one priority when the row has other destinations, while a quota-based first destination always shows its full chain.
Filter the policy list
To find a policy in a long list, use the search box above the table, which matches policy name, application, subsystem, and action or service on the Traces tab, or the Filtered by control above the Logs and RUM tables.
The Traces tab also has a Filters panel on the left with an Application, a Subsystem, and a Priority section. Each section lists its values with a count of the policies that use that value, and the Application and Subsystem sections have their own search box. Select one or more values to narrow the table to the matching policies. A quota-based policy counts under every priority in its chain, so the counts can add up to more than the number of policies.
Filters and DPXL
Filters are defined using DataPrime Expression Language (DPXL), which matches incoming events on:
- Standard labels such as application and subsystem
- Metadata such as severity and timestamp
- Any field in the event body, including nested fields and custom keys
For common use cases, the policy editor's Builder generates DPXL automatically. To write a filter directly, switch to Expression mode, which provides inline syntax validation, schema-aware autocomplete, and a link to the expression tutorial; invalid expressions are flagged and block saving until resolved.
For the full expression syntax, including keypaths ($m, $l, $d), operators, functions, type casting, and limits, see DataPrime expression language (DPXL).
Both log and trace policies support DPXL expressions. In Expression mode, a trace filter can match on any field, with the span label keypaths $l.serviceName, $l.operationName, $l.applicationName, and $l.subsystemName as common examples, and can be up to 4,096 characters. In both policy types, Builder and Expression are mutually exclusive. A policy is filtered by one or the other, not both.
Evaluation order
Policies are evaluated from top to bottom. The first matching policy applies and no subsequent policies are evaluated. Data that does not match any policy goes to High (Frequent Search) by default. Reorder policies in the UI via drag-and-drop.
Policy evaluation order
The most common reason a TCO policy does not behave as expected is policy order. Keep these rules in mind:
- First match wins. Policies are evaluated top-to-bottom. As soon as a log or trace matches a policy, it is routed to that policy's priority and evaluation stops. No policy below it is considered, even if a lower policy would also match.
- Order, not specificity, decides the winner. When two policies match the same data, the one placed higher in the list wins. A more specific policy placed below a broader one never takes effect for the overlapping data.
- Unmatched data falls through to High (Frequent Search). A log or trace that matches no policy is routed to High (Frequent Search), the most expensive priority. This behavior is silent: there is no policy row representing it.
- Use a catch-all policy to change the default. To send unmatched data somewhere other than High, add a policy with no filter conditions (so it matches everything) at the bottom of the list. Because first match wins, every policy above it still applies first, and the catch-all only captures whatever is left over.
To verify which policy is in effect for a given combination, use the Affecting policy column in Statistics. A combination shown as — or none is falling through to the default High (Frequent Search) priority.
Ordered example
Goal: send payments-service logs to Medium, except errors, which go to High, and block everything else.
| Order | Policy filter | Priority |
|---|---|---|
| 1 | payments-service logs with ERROR or CRITICAL severity | High (Frequent Search) |
| 2 | All payments-service logs | Medium (Monitoring) |
| 3 | No filter (catch-all) | Blocked |
With this order, a payments-service error matches policy 1 and stops. A payments-service info log skips policy 1, matches policy 2, and stops. Any other log skips policies 1 and 2 and is captured by the policy 3 catch-all. If you removed policy 3, that other data would fall through to High (Frequent Search) instead of being blocked.
Blocked is not free. Data routed to the Blocked priority still incurs a residual charge of roughly 8% of the blocked volume for the metadata Coralogix retains. Blocking reduces cost dramatically, but a catch-all → Blocked policy does not bring the cost of unmatched data to zero.
Create a policy
- Navigate to Data Flow, then TCO Optimizer.
- Select Logs, Traces, or RUM.
- Select + New policy.
Then configure each section of the policy.
Details

- Policy name (required)
- Description (optional)
- Policy order: First places the policy at the top of the evaluation list, so it is evaluated before all existing policies. Last places it at the bottom. Policies are evaluated in order from top to bottom; when a log or trace matches a policy, the system stops and does not evaluate any subsequent policies.
Filters

Define which logs, traces, or RUM events the policy applies to:
- Use the Builder to add conditions for application, subsystem, and severity using operators
is,is not,includes, orstarts with. - Or select Expression and enter a DPXL filter directly.
In the Builder, if the value you need isn't in the suggestions list, type it and select + Add <value> to use it. This applies the value to the current policy filter only. It does not add the field to your schema or register it as a reserved field.

Validate your expression from the editor
When a filter is in Expression mode, the editor offers two quick actions:
- A copy icon sits next to the expression field. Select it to copy the full DPXL expression to the clipboard, so you can share the filter or paste it into another tool.
- Go to Explore Logs sits below the editor, next to Expression tutorial. It opens Explore with the expression pre-injected as a DataPrime query, so you can inspect the actual events the expression matches, beyond the aggregate counter estimates and the Limited Preview state that Expression mode shows on the day a policy is created.
Go to Explore Logs appears once the expression is valid and filters something. It's hidden for an empty expression, for the default <v1> true matcher, and while the expression is invalid.
Explore opens on the last 15 minutes of the logs dataset, not the Last 24 hours or Last 7 days range used by the preview panel. Widen the time range in Explore if the filter matches low-volume data.
Action
Choose what happens to the data the filter matches:
- Route & Store: send matched data to one or more destinations with configured storage.
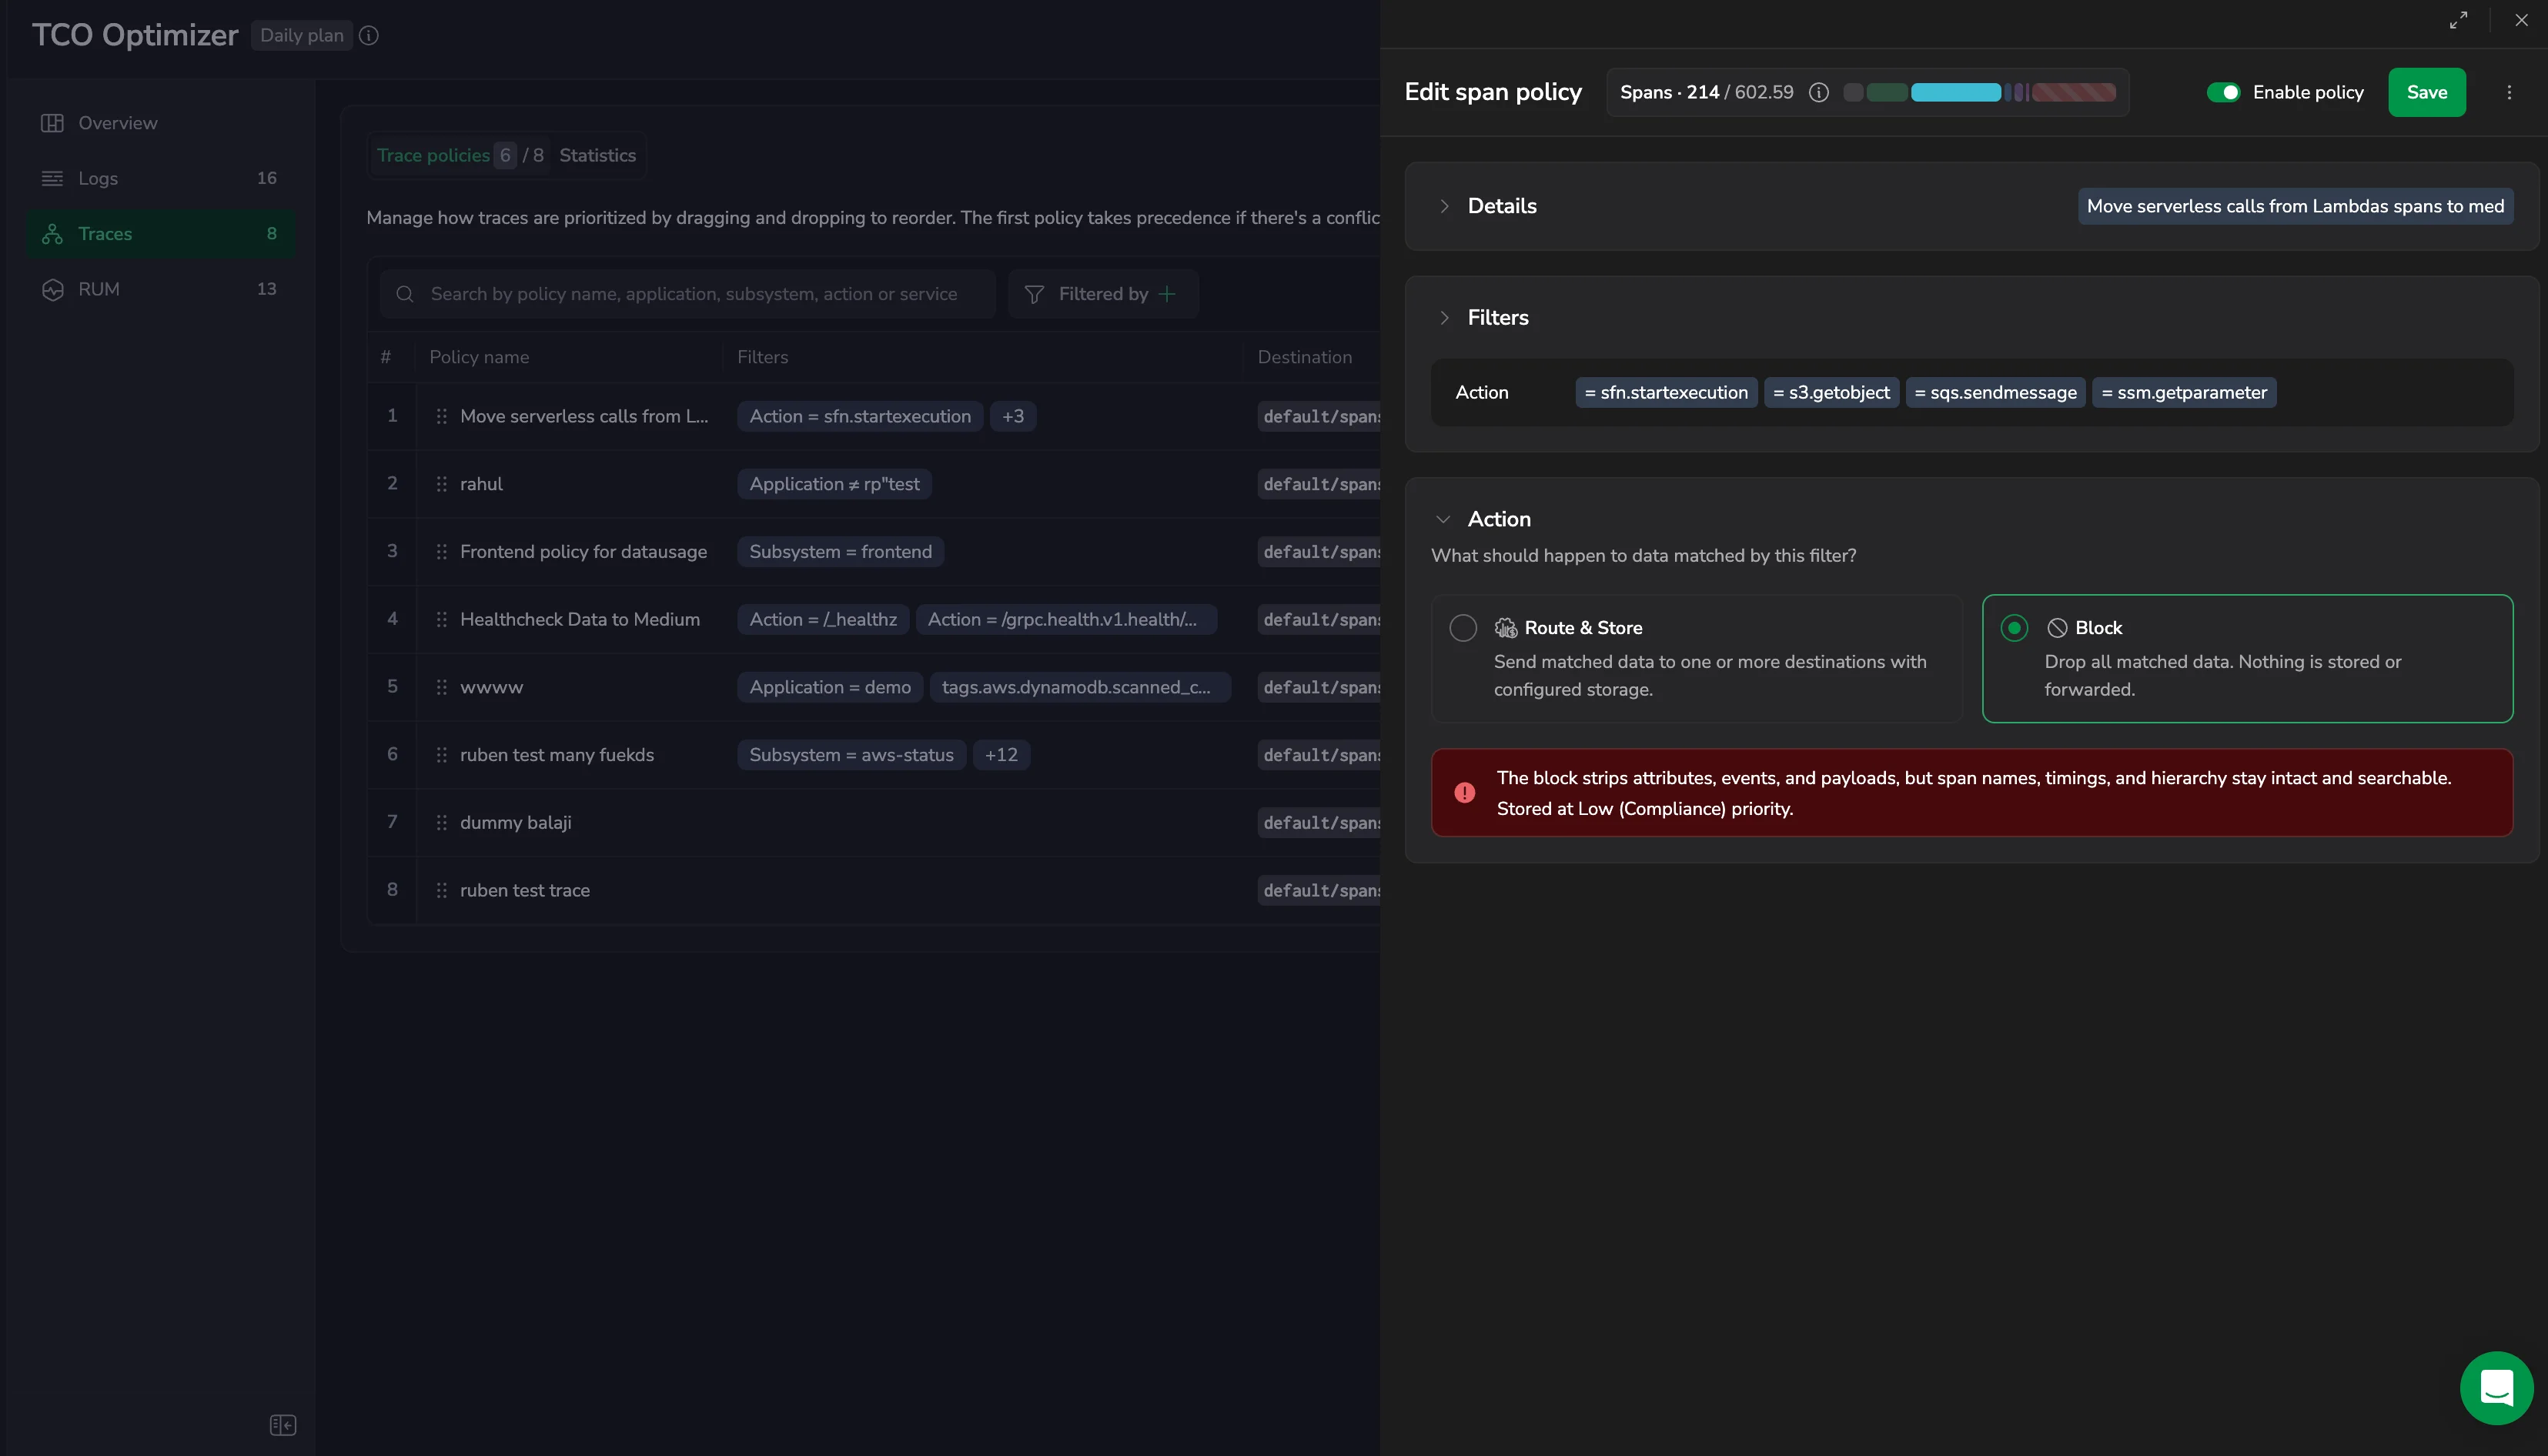
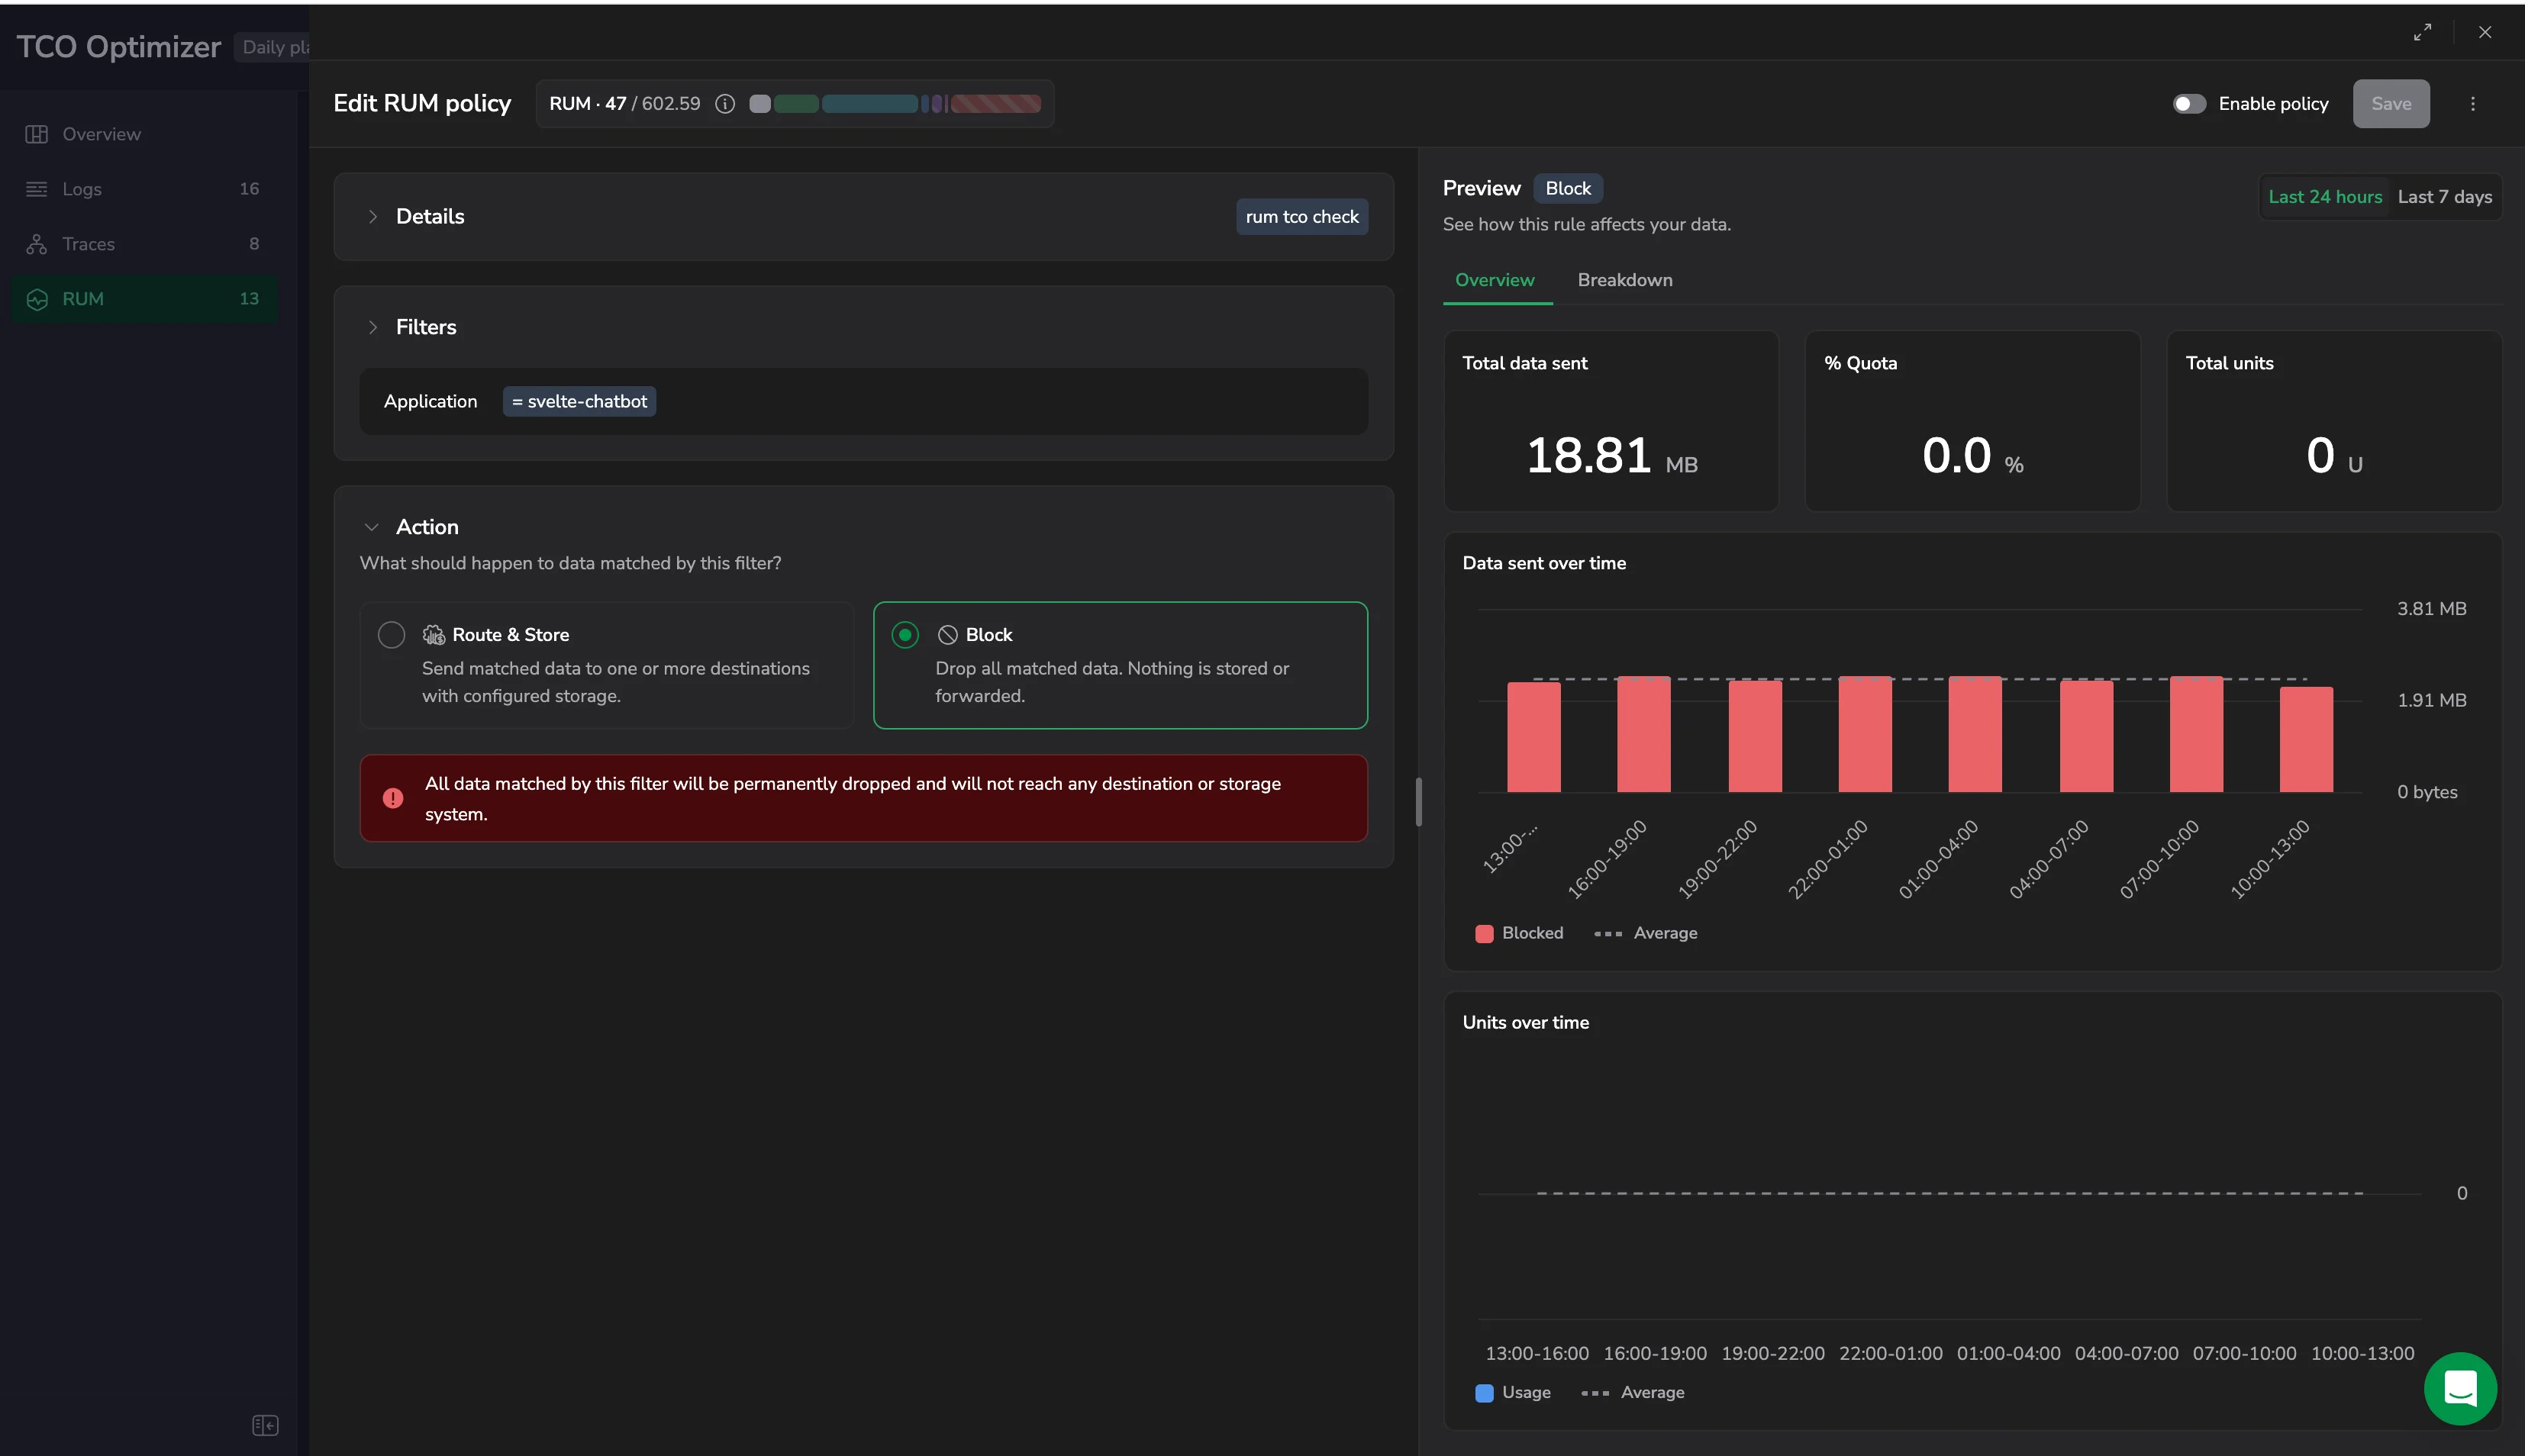
- Block: for logs and RUM, drops all matched data. Nothing is stored or forwarded. For traces, the span is partially ingested: span names, timings, and hierarchy stay intact and searchable, while attributes, events, and payloads are stripped.
Selecting this action replaces the Destination & Storage section with a notice describing what happens to the matched data. For logs and RUM, a warning that the data is permanently dropped and will not reach any destination or storage system. For traces, a note that the block strips attributes, events, and payloads, while span names, timings, and hierarchy stay intact and searchable, stored at Low (Compliance) priority. See Blocked for what blocking still costs and what it retains per data type.
Destination & Storage
Route matched data to one or more destinations, each with its own storage strategy. Every destination is a tab labeled <dataspace>/<dataset>, with a badge showing that destination's policy type, and each destination carries its own dataset, policy type, priority, and archive retention.
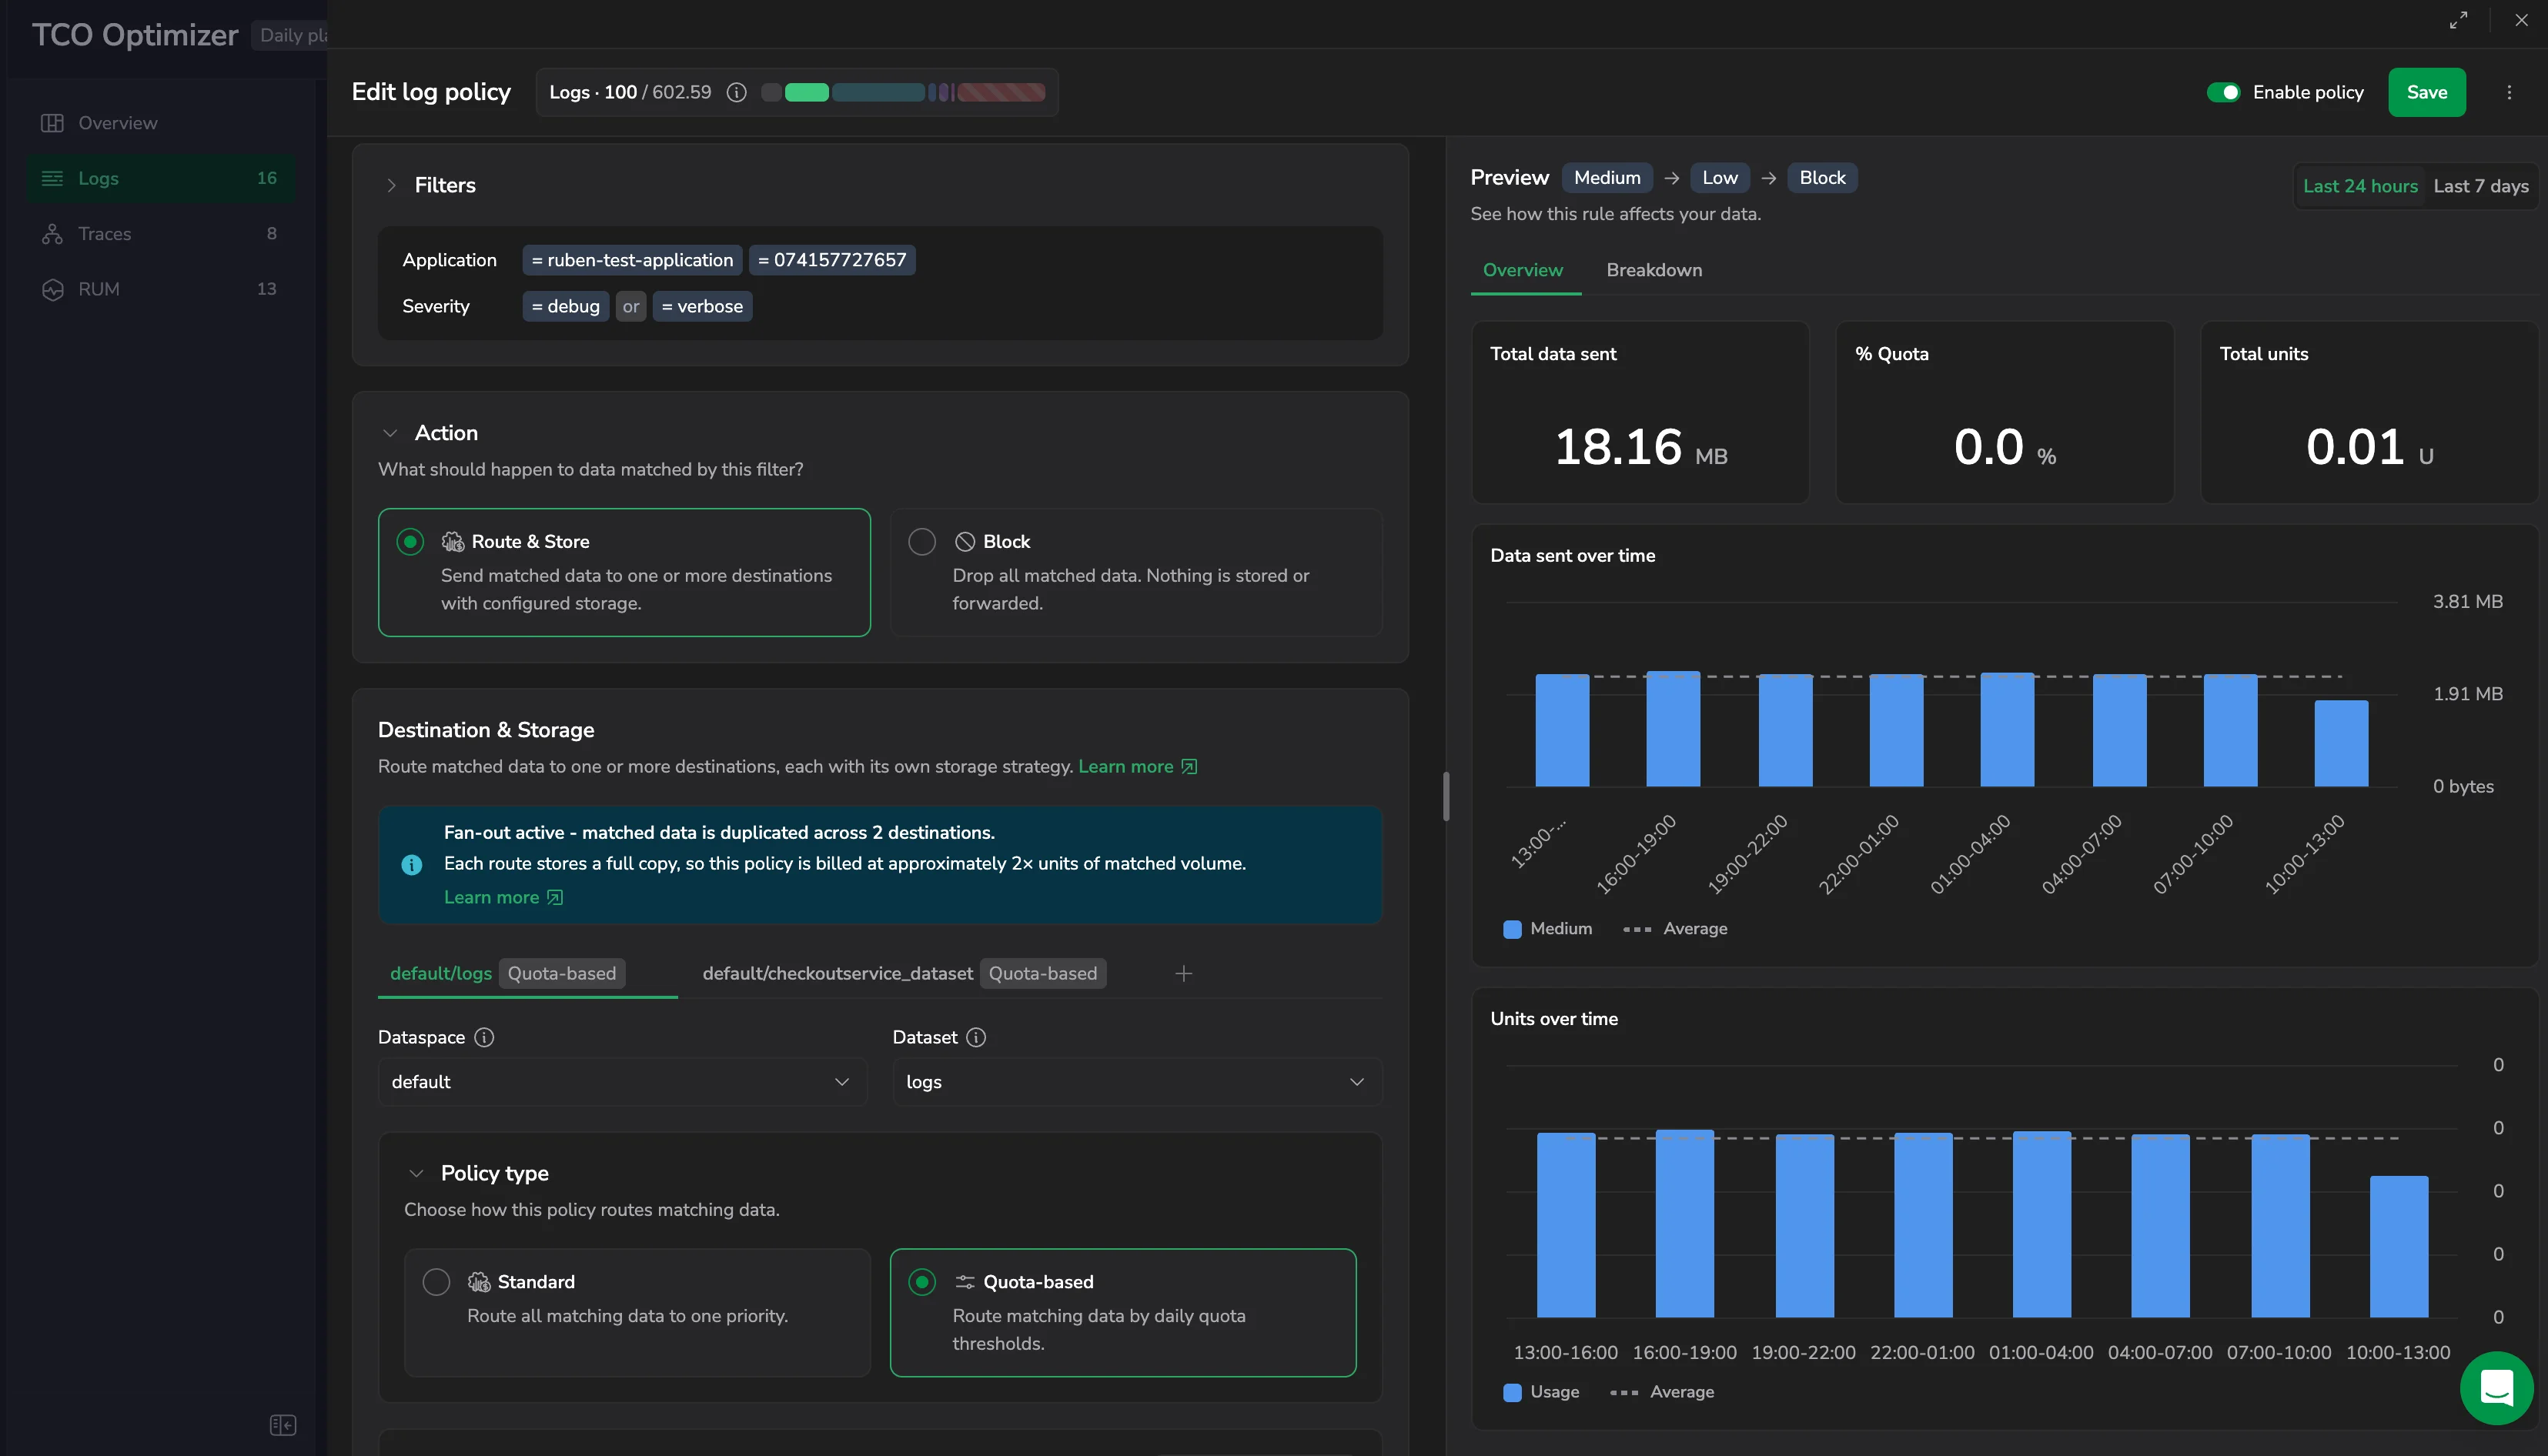
Dataspace and dataset
- Select the Dataspace. It defaults to
default. - From the Dataset dropdown, select the dataset to route matching data into. Datasets are managed in Dataspace Management.
By default, log policies route to default/logs and RUM policies route to default/rum.events.
High (Frequent Search) is supported only for each data type's default dataset: default/logs for logs and default/rum.events for RUM. Select any other dataset and the High option is disabled.
When a TCO policy targets a user-defined dataset, the result is a streaming dataset, meaning data is routed in as it's ingested. The same dataspace can also hold summary datasets, which are populated by Background queries v2 writing query results into a dataset for downstream queries and dashboards.
For information about creating and managing user-defined datasets, see User-defined datasets.
Policy type
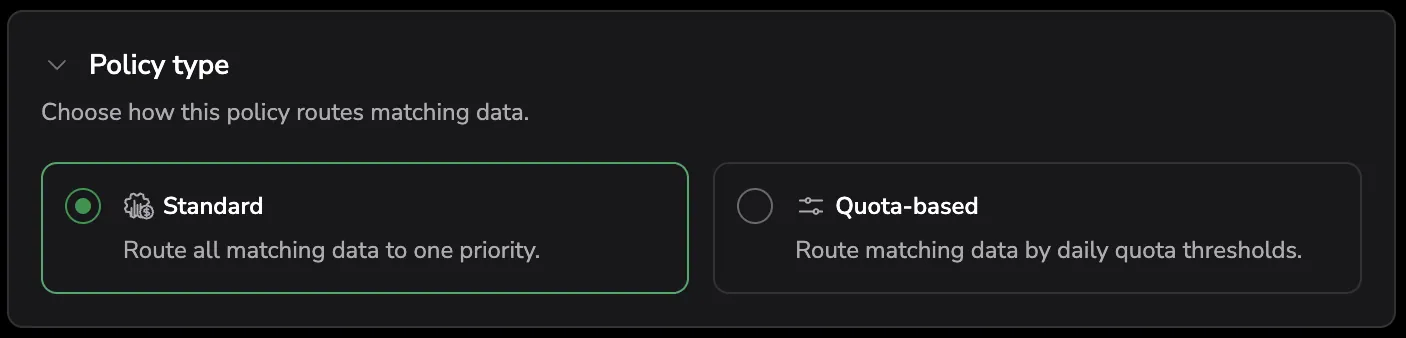
Choose how this destination routes matching data:
- Standard: route all matching data to one priority.
- Quota-based: route matching data by daily quota thresholds.
Policy type is set per destination, so one policy can route Standard to one destination and Quota-based to another. Switching a destination from Quota-based to Standard clears that destination's quota configuration, and the editor asks you to confirm first.
Priority
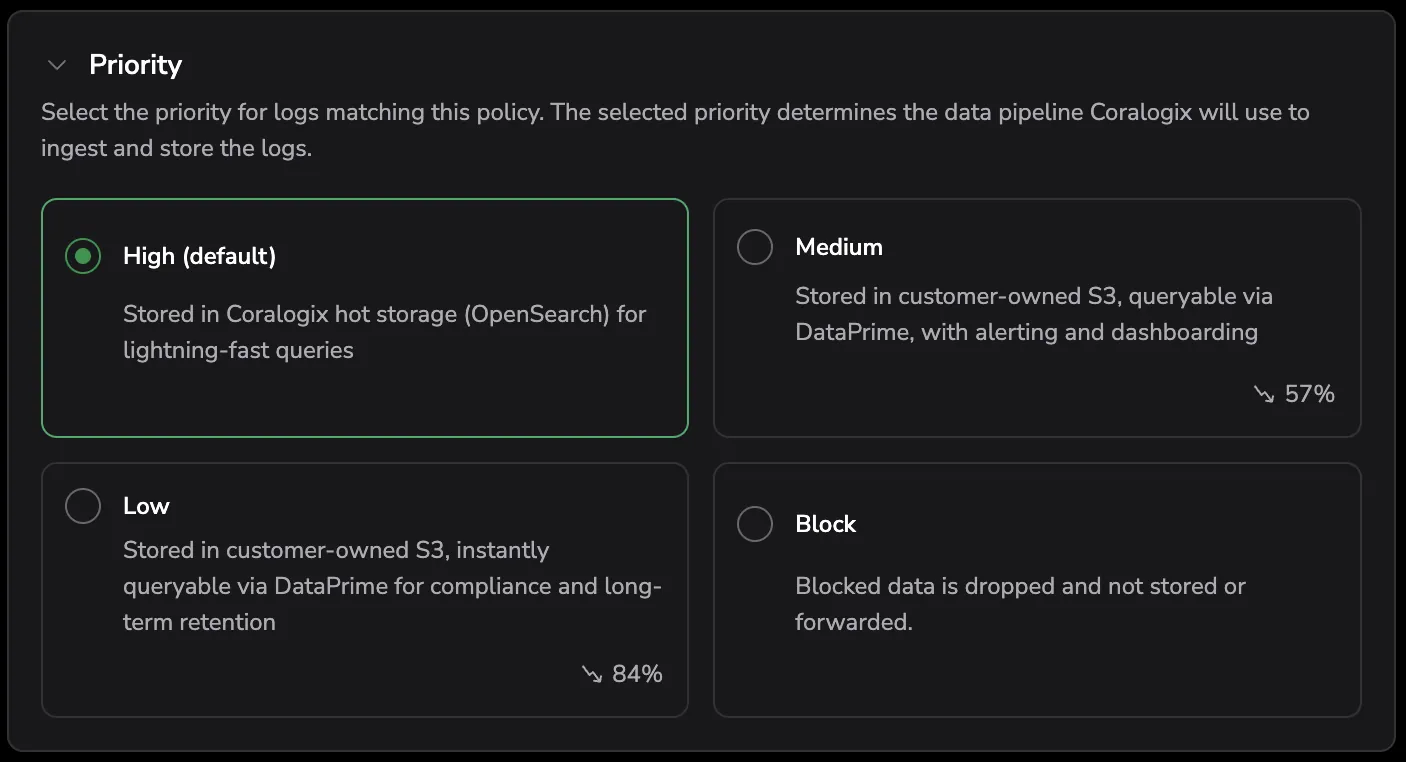
For a Standard destination, select the priority for data matching this policy. The selected priority determines the data pipeline Coralogix uses to ingest and store the data:
- High: stored in Coralogix hot storage (OpenSearch) for lightning-fast queries.
- Medium: stored in customer-owned S3, queryable via DataPrime, with alerting and dashboarding.
- Low: stored in customer-owned S3, instantly queryable via DataPrime for compliance and long-term retention.
Each card shows the estimated saving against High: roughly 57% for Medium and 84% for Low.
For a Quota-based destination, route your daily quota across one or more tiers. Toggle between Percentage and Units, then set each tier as Route <from> to <to> % of daily quota to <priority>. Select Add threshold to add more tiers. For example, route the first 20% of the daily quota to Medium and the next 30% to Low. Route the remaining quota to then sets the fallback priority for everything above the last tier.
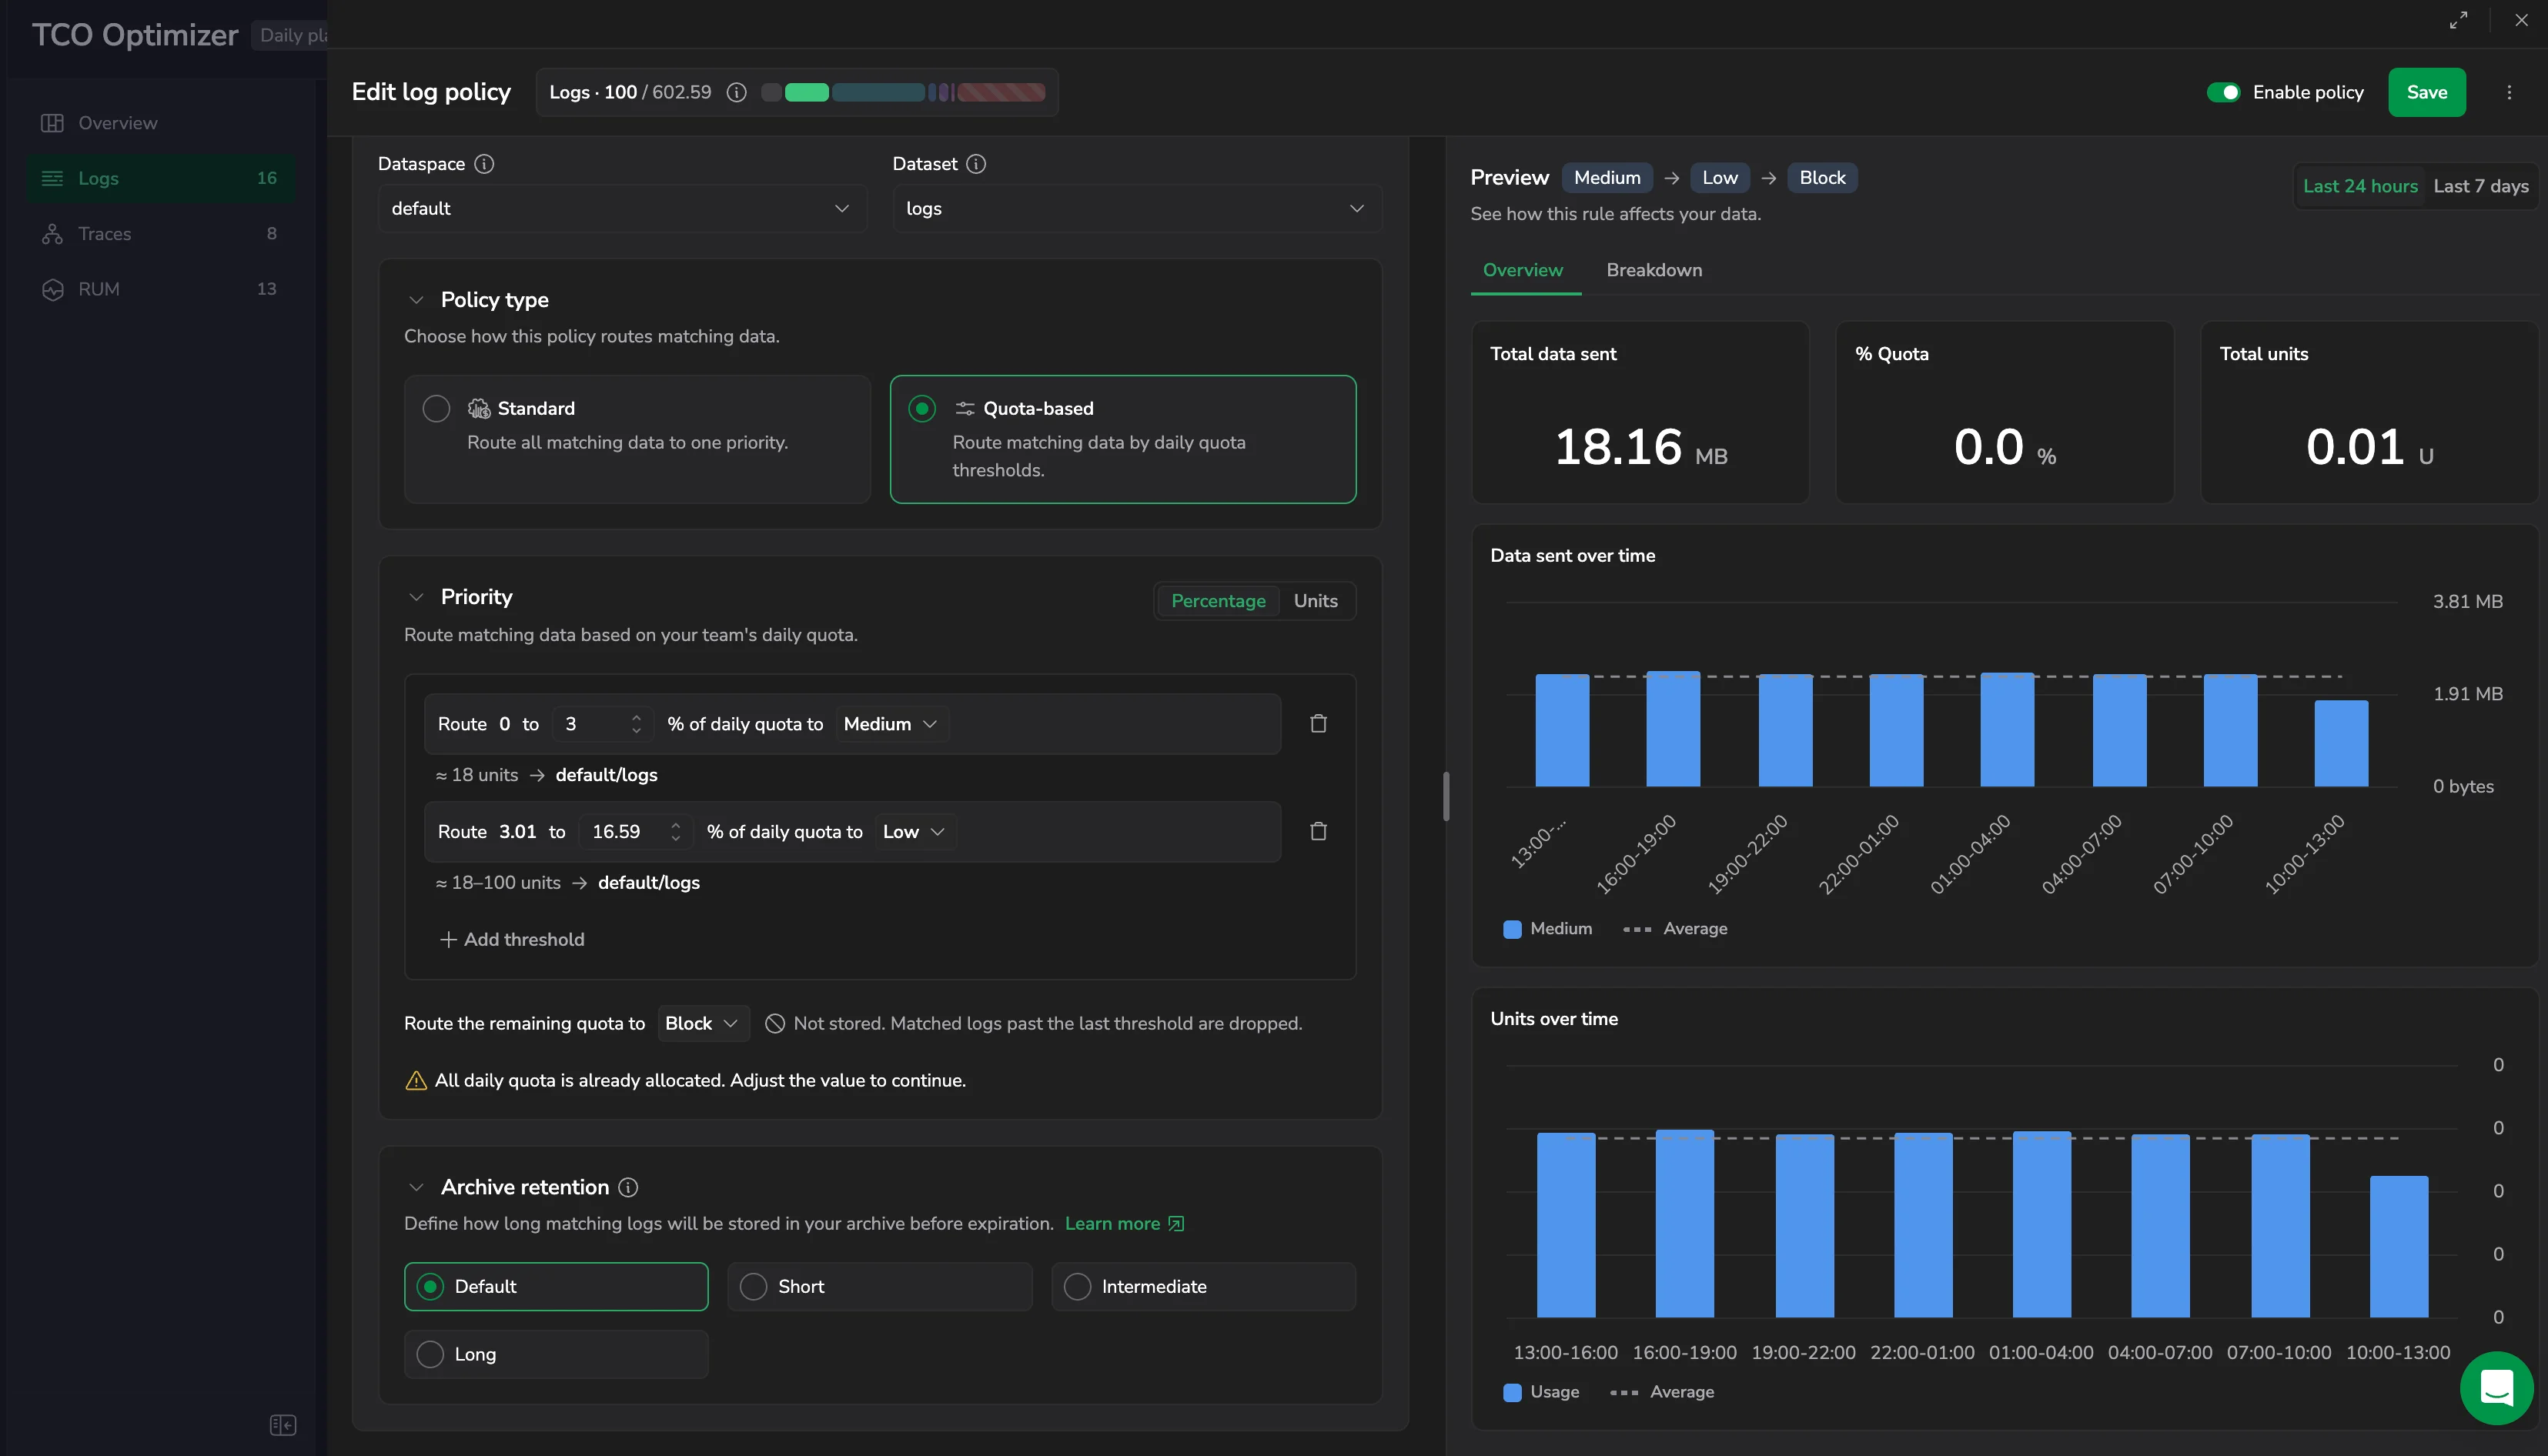
The editor validates the tiers as you configure them:
- Thresholds must be strictly ascending.
- Each tier must be more restrictive than the previous tier.
- The fallback must be more restrictive than the last tier.
- You cannot allocate more than your remaining daily quota.
Values entered in Units mode are stored as a percentage of your daily quota, so the effective allocation moves with your quota. If you have no daily units allocated, the section links you to Quota Rules to set an allocation first.
Archive retention
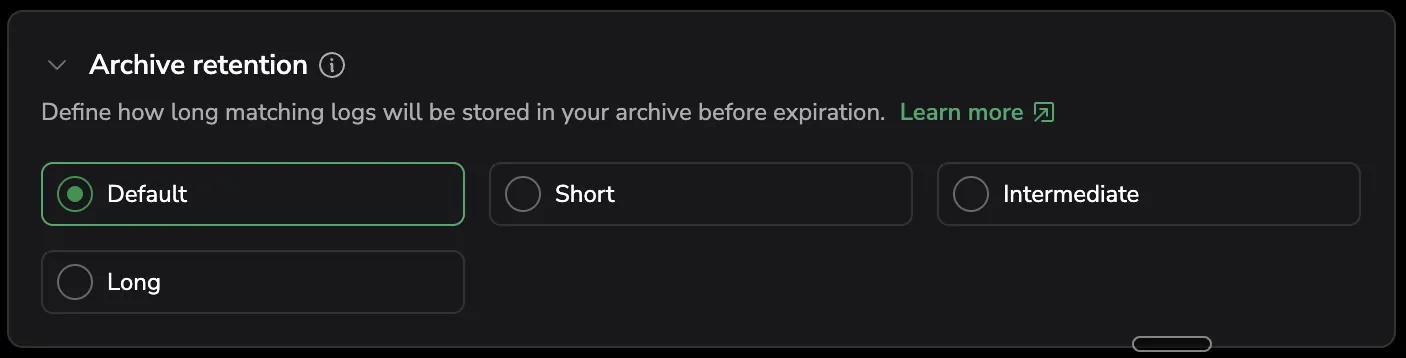
Archive retention assigns a label as a tag on the Parquet files written to your S3 bucket. Use these tags in your cloud storage lifecycle policies to control how long archived data is retained. Coralogix does not manage deletion. Retention duration is controlled by your storage provider.
In Archive retention, choose a label: Default, Short, Intermediate, or Long. Tags apply to Medium and Low priority data only. If retention tags are deactivated, activate them on the Setup archive page first.
When the destination is a user-defined dataset, retention is governed by that dataset's Dataset Definition and cannot be overridden in the policy. The section shows Defined by Dataset Definition. with a link to view the definition.
Route to multiple destinations
Select + next to the destination tabs to add another route, up to two destinations per policy, a limit enforced in both the UI and the backend. Use a tab's menu to rename or remove a route.
Adding a destination duplicates the matched data to every route in the policy, and each copy is billed separately. The editor asks you to confirm, then shows a banner reading Fan-out active, matched data is duplicated across N destinations, noting that the policy is billed at approximately N× the units of matched volume.
Each destination sets its own policy type and priority, so the two copies can land at different priorities.
Fan-out applies to log policies. RUM policies route to the single locked default/rum.events dataset, so they have no + control. Trace policies route to default/spans with a locked dataset and no + control either.
Once every destination is configured, enable the policy to take effect immediately and select Create.
Preview panel
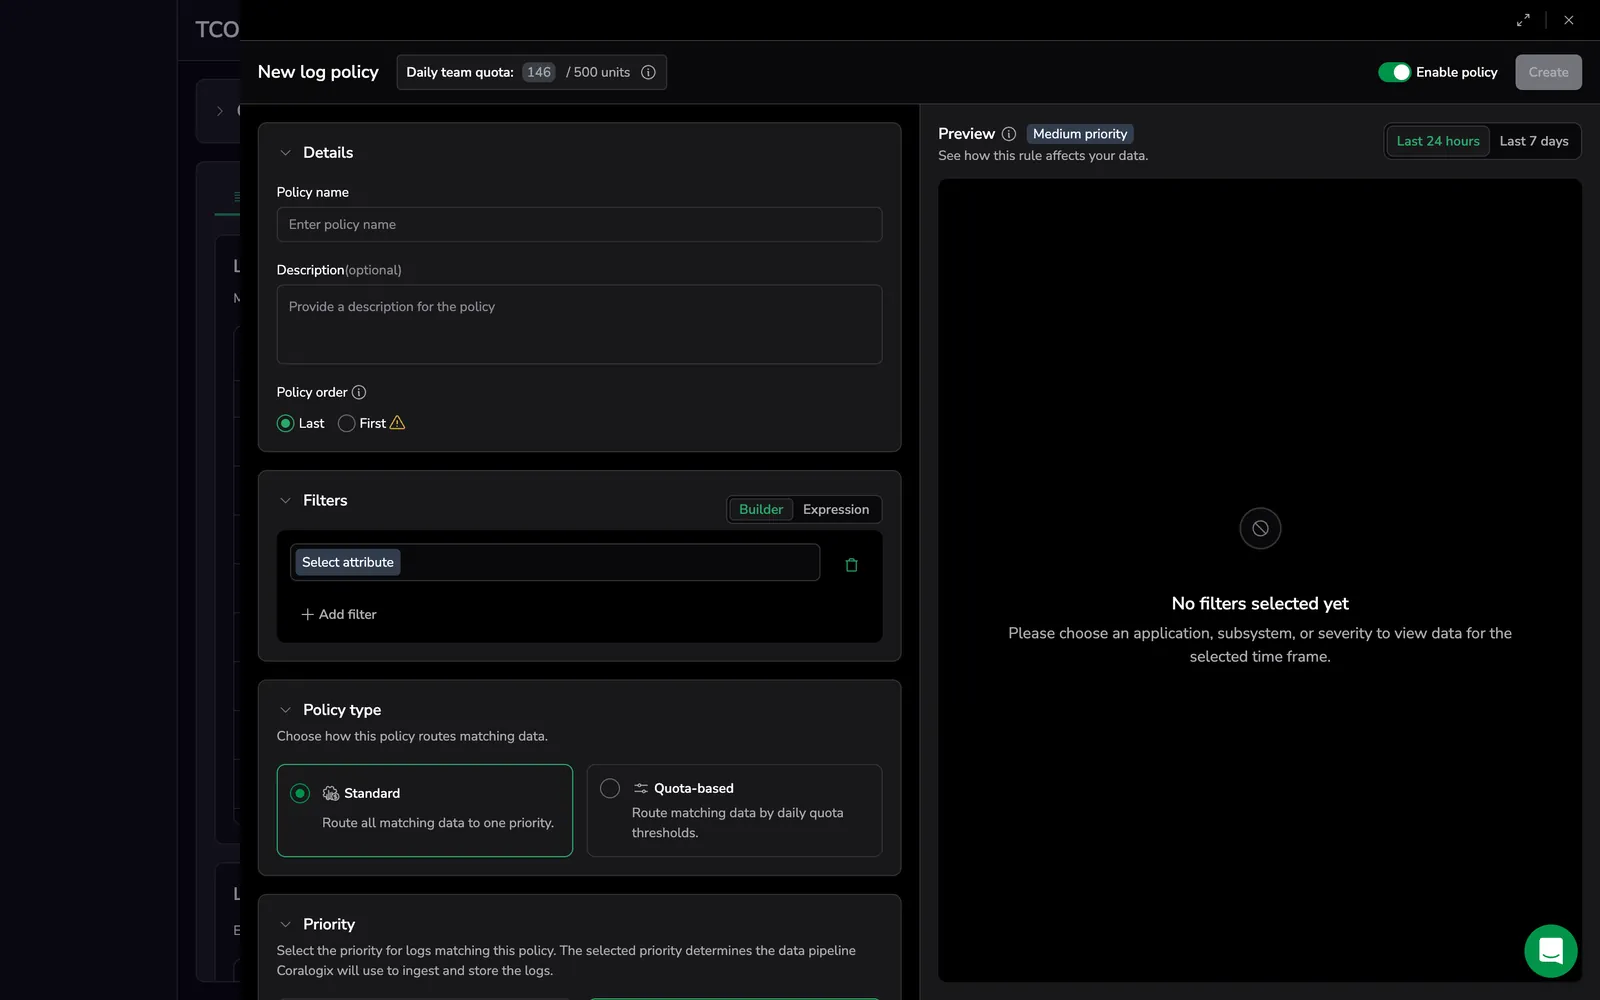
While creating or editing a policy, the Preview panel on the right side of the policy form shows how the current filter and priority match real data. Use it to validate routing decisions before saving.
The panel has two tabs: Overview (summary counters and time-series charts) and Breakdown (the per-combination grid).
The preview panel is available for log and RUM policies. The trace policy editor has no preview panel.
The panel header shows the priority the preview reflects as chips, in the order the policy applies them (for a quota-based policy, the whole chain, for example Medium → Low → Block), above the prompt See how this rule affects your data., with a time-range toggle:
- Last 24 hours
- Last 7 days
Switching the time range refetches the preview for the new window.
The counters and the time-series charts behave differently in time:
- Summary counters are a live, same-day estimate computed from your current filter and priority, available immediately while you configure the policy.
- The charts show full history in Builder mode, but in Expression (DPXL) mode they show a Limited Preview state until the day after you create the policy. Expression previews are tracked by policy ID, which doesn't exist until the policy is created, so a DPXL filter's historical trends only start to populate the next day, once tracking begins.
Summary counters
Three counter cards on the Overview tab report the aggregate impact of the current filter and priority over the selected window:
- Total data sent: total matched volume, shown in the unit that fits, for example MB or GB.
- % Quota: the matched data's share of your daily quota.
- Total units: total units (U) consumed by the matched data. When the policy action is Block, this is
0. Storage and retention units are eliminated. Blocked data still incurs a reduced ingestion processing cost (0.08 units per GB); that cost is not reflected in this counter.
For a quota-based destination, the panel adds the disclaimer Based on recent traffic patterns. Actual blocking point will vary with daily volume.
Time-series charts
The panel includes two stacked time-series charts for the selected range:
- Data sent over time: a bar chart of volume across the range, colored by priority (red for blocked data), with a dashed average line.
- Units over time: units consumption across the range, with an average reference line.
When the policy filter is in Expression (DPXL) mode, the two charts show a Limited Preview state instead of historical data:
- Data sent over time: Volume history starts the day after you save. We start tracking volume when you save this policy, and history appears the next day.
- Units over time: Unit history starts the day after you save. We start tracking unit consumption and priority changes when you save this policy, and history appears the next day.
In Builder mode, both charts display the full history for the selected range.
Breakdown grid
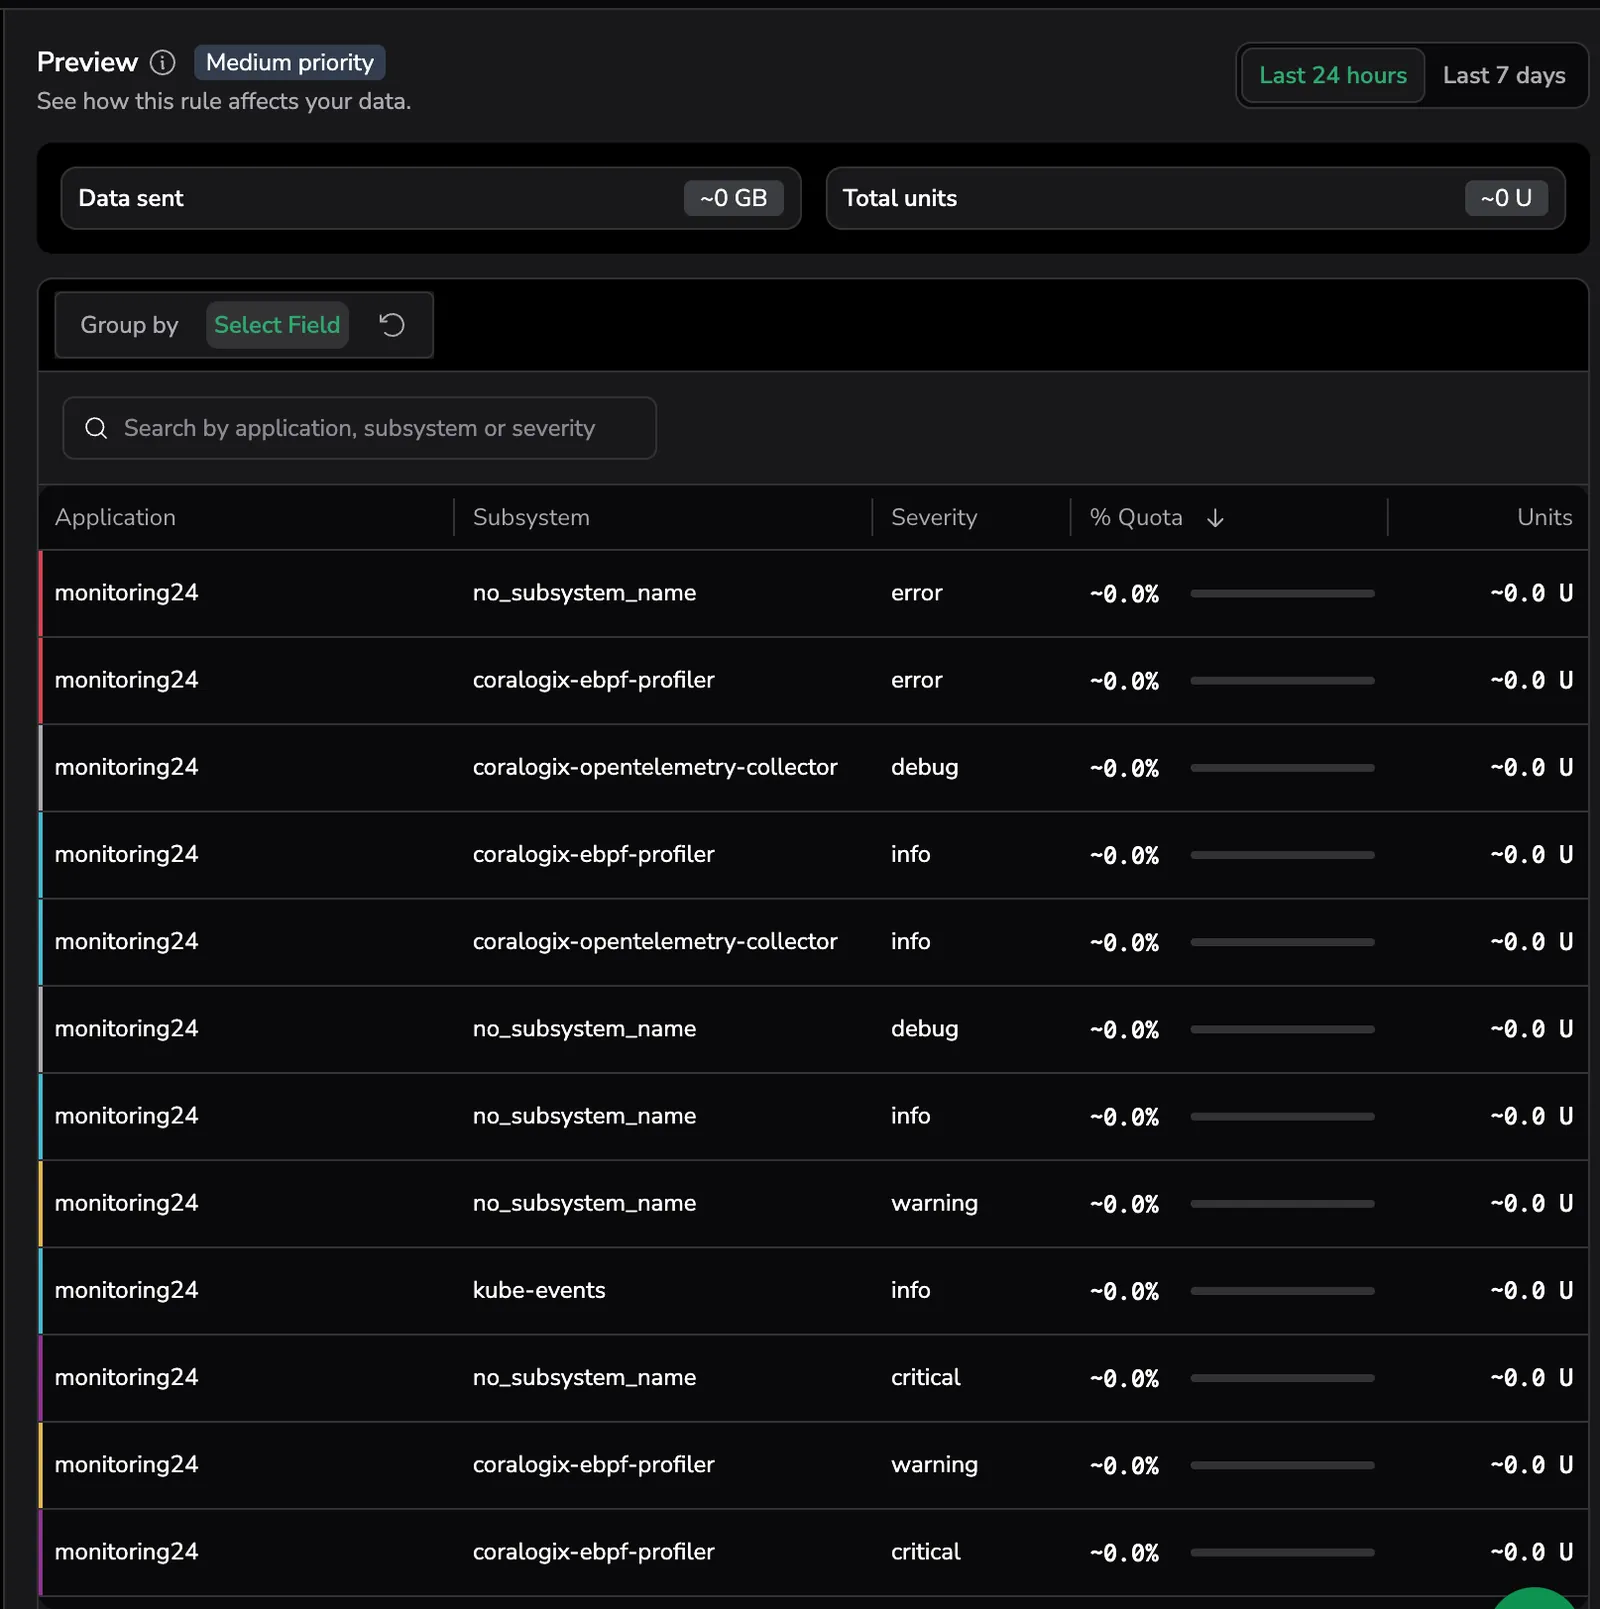
The breakdown grid breaks the matched data down by combinations of application, subsystem, and severity, color-coding each row by severity. For each row, the grid shows the Application, Subsystem, Severity, % Quota, and Units columns.
- Use the Group by selector (Select Field) to pick which dimensions to include and in what order.
- Use the search box to filter rows by application, subsystem, or severity name.
- Sort by % Quota or Units to surface the largest contributors.
The Breakdown grid is always present. It is not disabled for Expression (DPXL) filters. Whenever an Expression filter narrows the results, an info banner appears above the grid with the title Partial data. and the message Results filtered by DPXL query., alongside a Learn more link to the DPXL query tutorial. The banner confirms the grid reflects the current expression, not the unfiltered ingest.
The grid shows a temporary state in these cases:
- Preview is loading: Loading data…
- No data for the selected range: No data for the selected range.
- Preview failed to load: Data unavailable: retry preview.
Empty and loading states
Before you add any filter conditions to the policy, the panel shows the placeholder No filters selected yet and prompts you to add an application, subsystem, or severity filter to populate the preview for the selected time frame.
While the preview is being computed, the panel shows Analyzing query with a description that Coralogix is scanning logs for the selected range. If the preview can't be loaded, the panel shows Preview unavailable with a prompt to retry.
When the filter is active but returns no matching events for the selected time range, the grid shows Nothing to show here with a suggestion to widen the filter, change the time range, or reset the search.
RUM policies
The RUM tab manages TCO policies for RUM events. RUM policies use the same editor as log policies (Details, Filters, Action, Destination & Storage, policy type, priority, and archive retention) and the same Preview panel, with these differences:
- Fixed destination. RUM events route to
default/rum.events, and the dataset is locked. There is no dataset selection and no fan-out to a second destination. - Priority. Medium is the default and High is hidden. High is only meaningful for organizations that also write RUM data to the logs pillar, and Coralogix enables the option for those organizations only. Keep RUM data at Medium or High: events routed to Low (Compliance) are not available to RUM or Product Analytics features such as Heatmaps, Funnels, and Pathways.
- Filters. The Builder offers Application and Subsystem conditions. Expression mode accepts a DPXL filter, validated and autocompleted against the
rum.eventsdataset schema rather than the logs schema. Field casing differs, for example$l.applicationNamefor RUM against$l.applicationnamefor logs.
Quota-based policy types, the Block action, and archive retention all behave the same as they do for logs. The policy table carries the Severity and Policy type columns, and the Destination column shows the short name rum.events for every policy. Because that is the only destination a RUM policy can have, the RUM tab does not offer the destinations filter.
Edit, disable, or delete a policy
Hover over a policy row to show its actions: an edit icon, a delete icon, and a ⋮ menu with Edit, Delete, and Clone.
- To edit a policy, select the policy row, or select the edit icon, and modify its filter, priority, or archive retention.
- To clone a policy, open the ⋮ menu and choose Clone to start a new policy from an existing one.
- To disable a policy, toggle the policy off. Disabled policies are skipped during evaluation.
- To reorder policies, drag the policy to a new position in the list.
- To delete a policy, select the delete icon, or open the ⋮ menu and choose Delete.
Changes take effect immediately. If a policy causes unexpected routing, disable it to revert to the previous behavior.
Policy order and exception handling
Because the first matching policy applies, use this pattern:
- Put specific exceptions first.
- Put broad defaults last.
Example
Broad policy: all logs from payments-service go to Medium (Monitoring).
Exception: logs from payments-service with ERROR or CRITICAL severity go to High (Frequent Search).
Exception policy (place first):
<v1> $l.applicationname == 'payments-service' && $m.severity.in(ERROR, CRITICAL)
Broad policy (place below):
<v1> $l.applicationname == 'payments-service'
View as code
View as code shows your TCO policies as infrastructure-as-code, so you can reproduce a policy set you built in the UI in Terraform, the Coralogix Operator, or the API without translating it by hand.
Each policy tab has its own View as code button in the section header, next to Settings and Create policy. Select it to open the Code preview panel, labeled Beta, for that tab's data type.
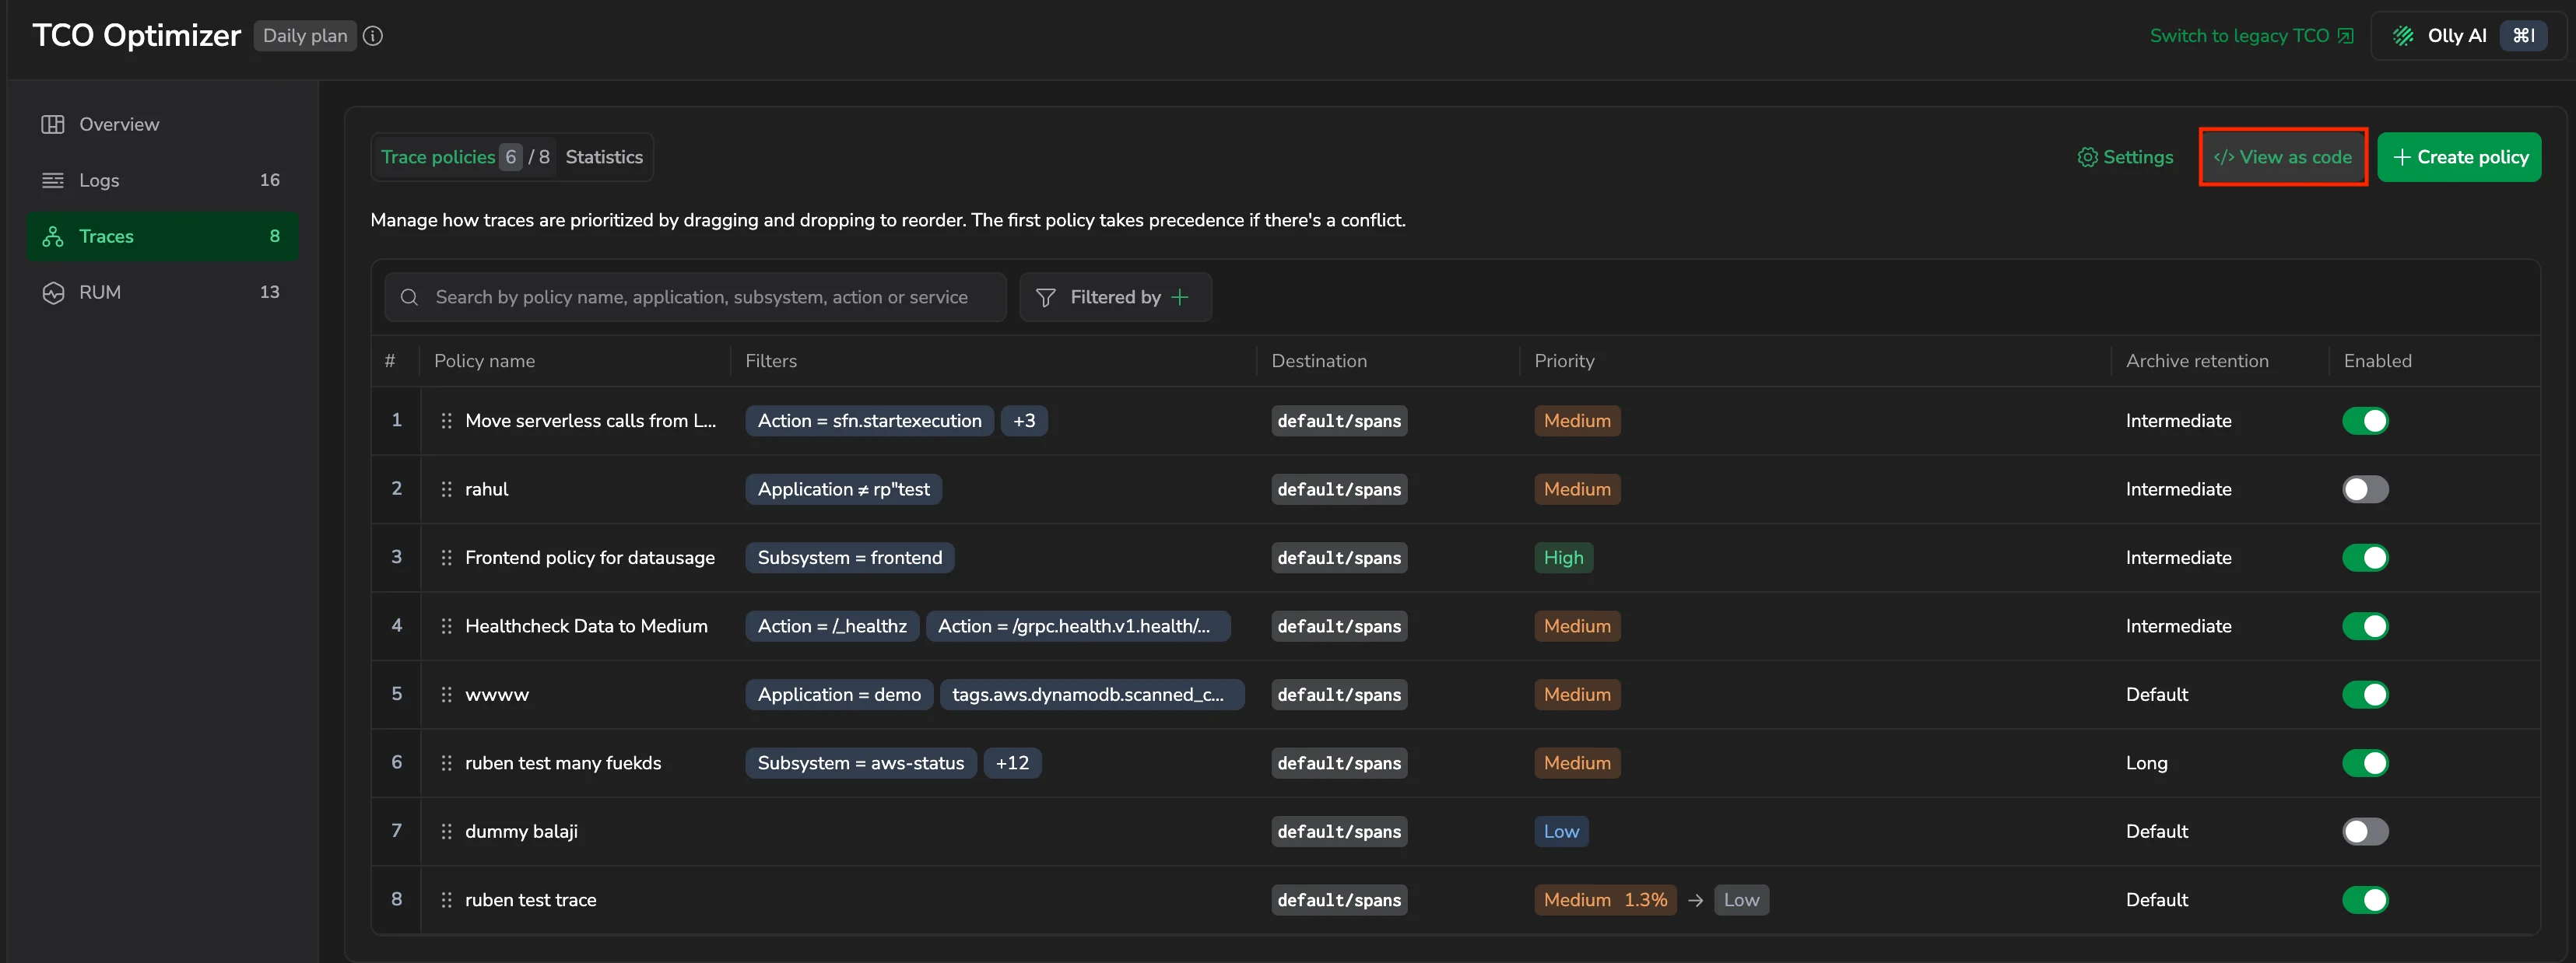
The panel renders every policy of that data type as a single document, in three formats:
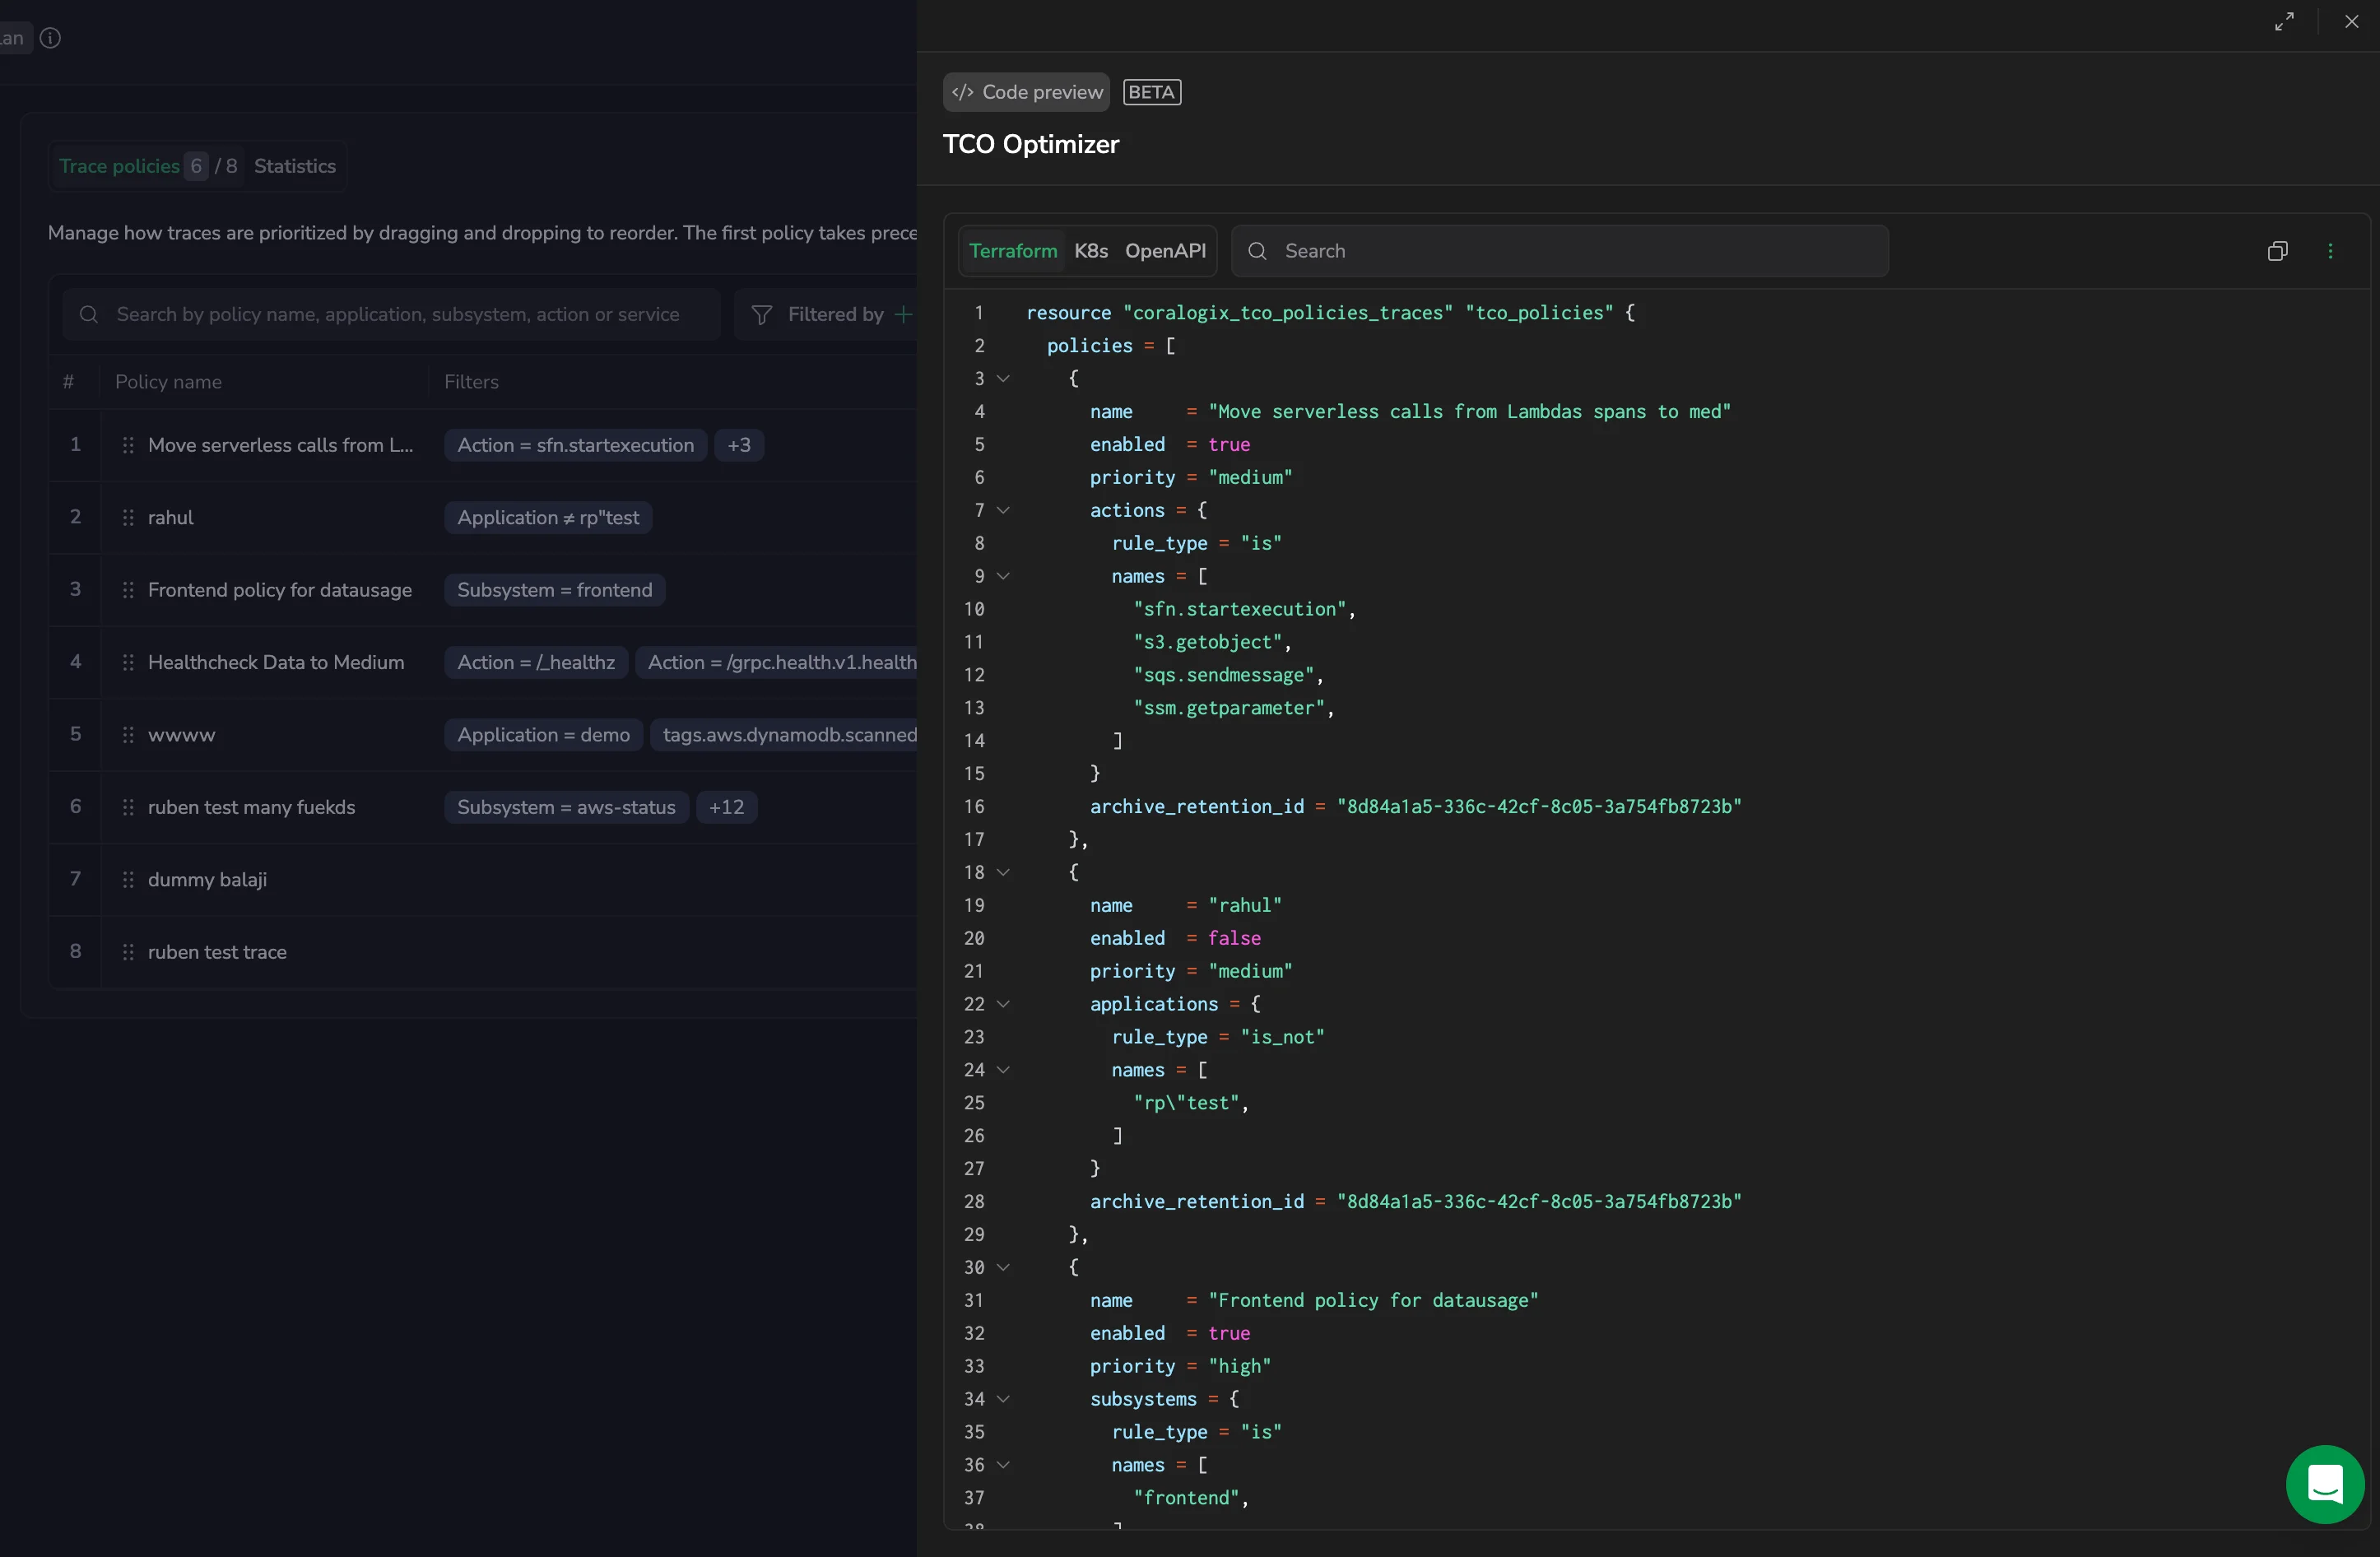
| Tab | Logs | Traces | RUM |
|---|---|---|---|
| Terraform | coralogix_tco_policies_logs | coralogix_tco_policies_traces | coralogix_tco_policies_rum |
| K8s | TCOLogsPolicies | TCOTracesPolicies | TCORumPolicies |
| OpenAPI | policies JSON array | policies JSON array | policies JSON array |
Because the document covers the whole tab, it contains every policy for that data type in evaluation order rather than one selected row. To capture all three data types, open the panel once per tab.
From the panel you can:
- Switch between the Terraform, K8s, and OpenAPI tabs.
- Search the generated code.
- Select the copy button to copy the code to your clipboard.
- Open the ⋮ menu to Download the code, or to Collapse all or Expand all sections and navigate a long policy list.
The panel is read-only and generated from your saved policies, so field names, units, and structure match the Coralogix API exactly. Edit policies on the tab itself, then reopen the panel to see the updated code.
Opening the panel needs only read access to the policies, so a role with LOGS.TCO:READPOLICIES, SPANS.TCO:READPOLICIES, or RUM.TCO:READPOLICIES can view the code without permission to modify policies.
For the same capability in other areas of Coralogix, see View as code for alerts.
API and Terraform
TCO policies can also be managed via the Coralogix API or Terraform provider. See the TCO Optimizer HTTP API and the Terraform documentation for details.