Usage overview and statistics
Usage overview
Use the Overview page to understand how your daily quota is consumed across priorities and how routing affects cost. Select Overview in the TCO Optimizer's left navigation.
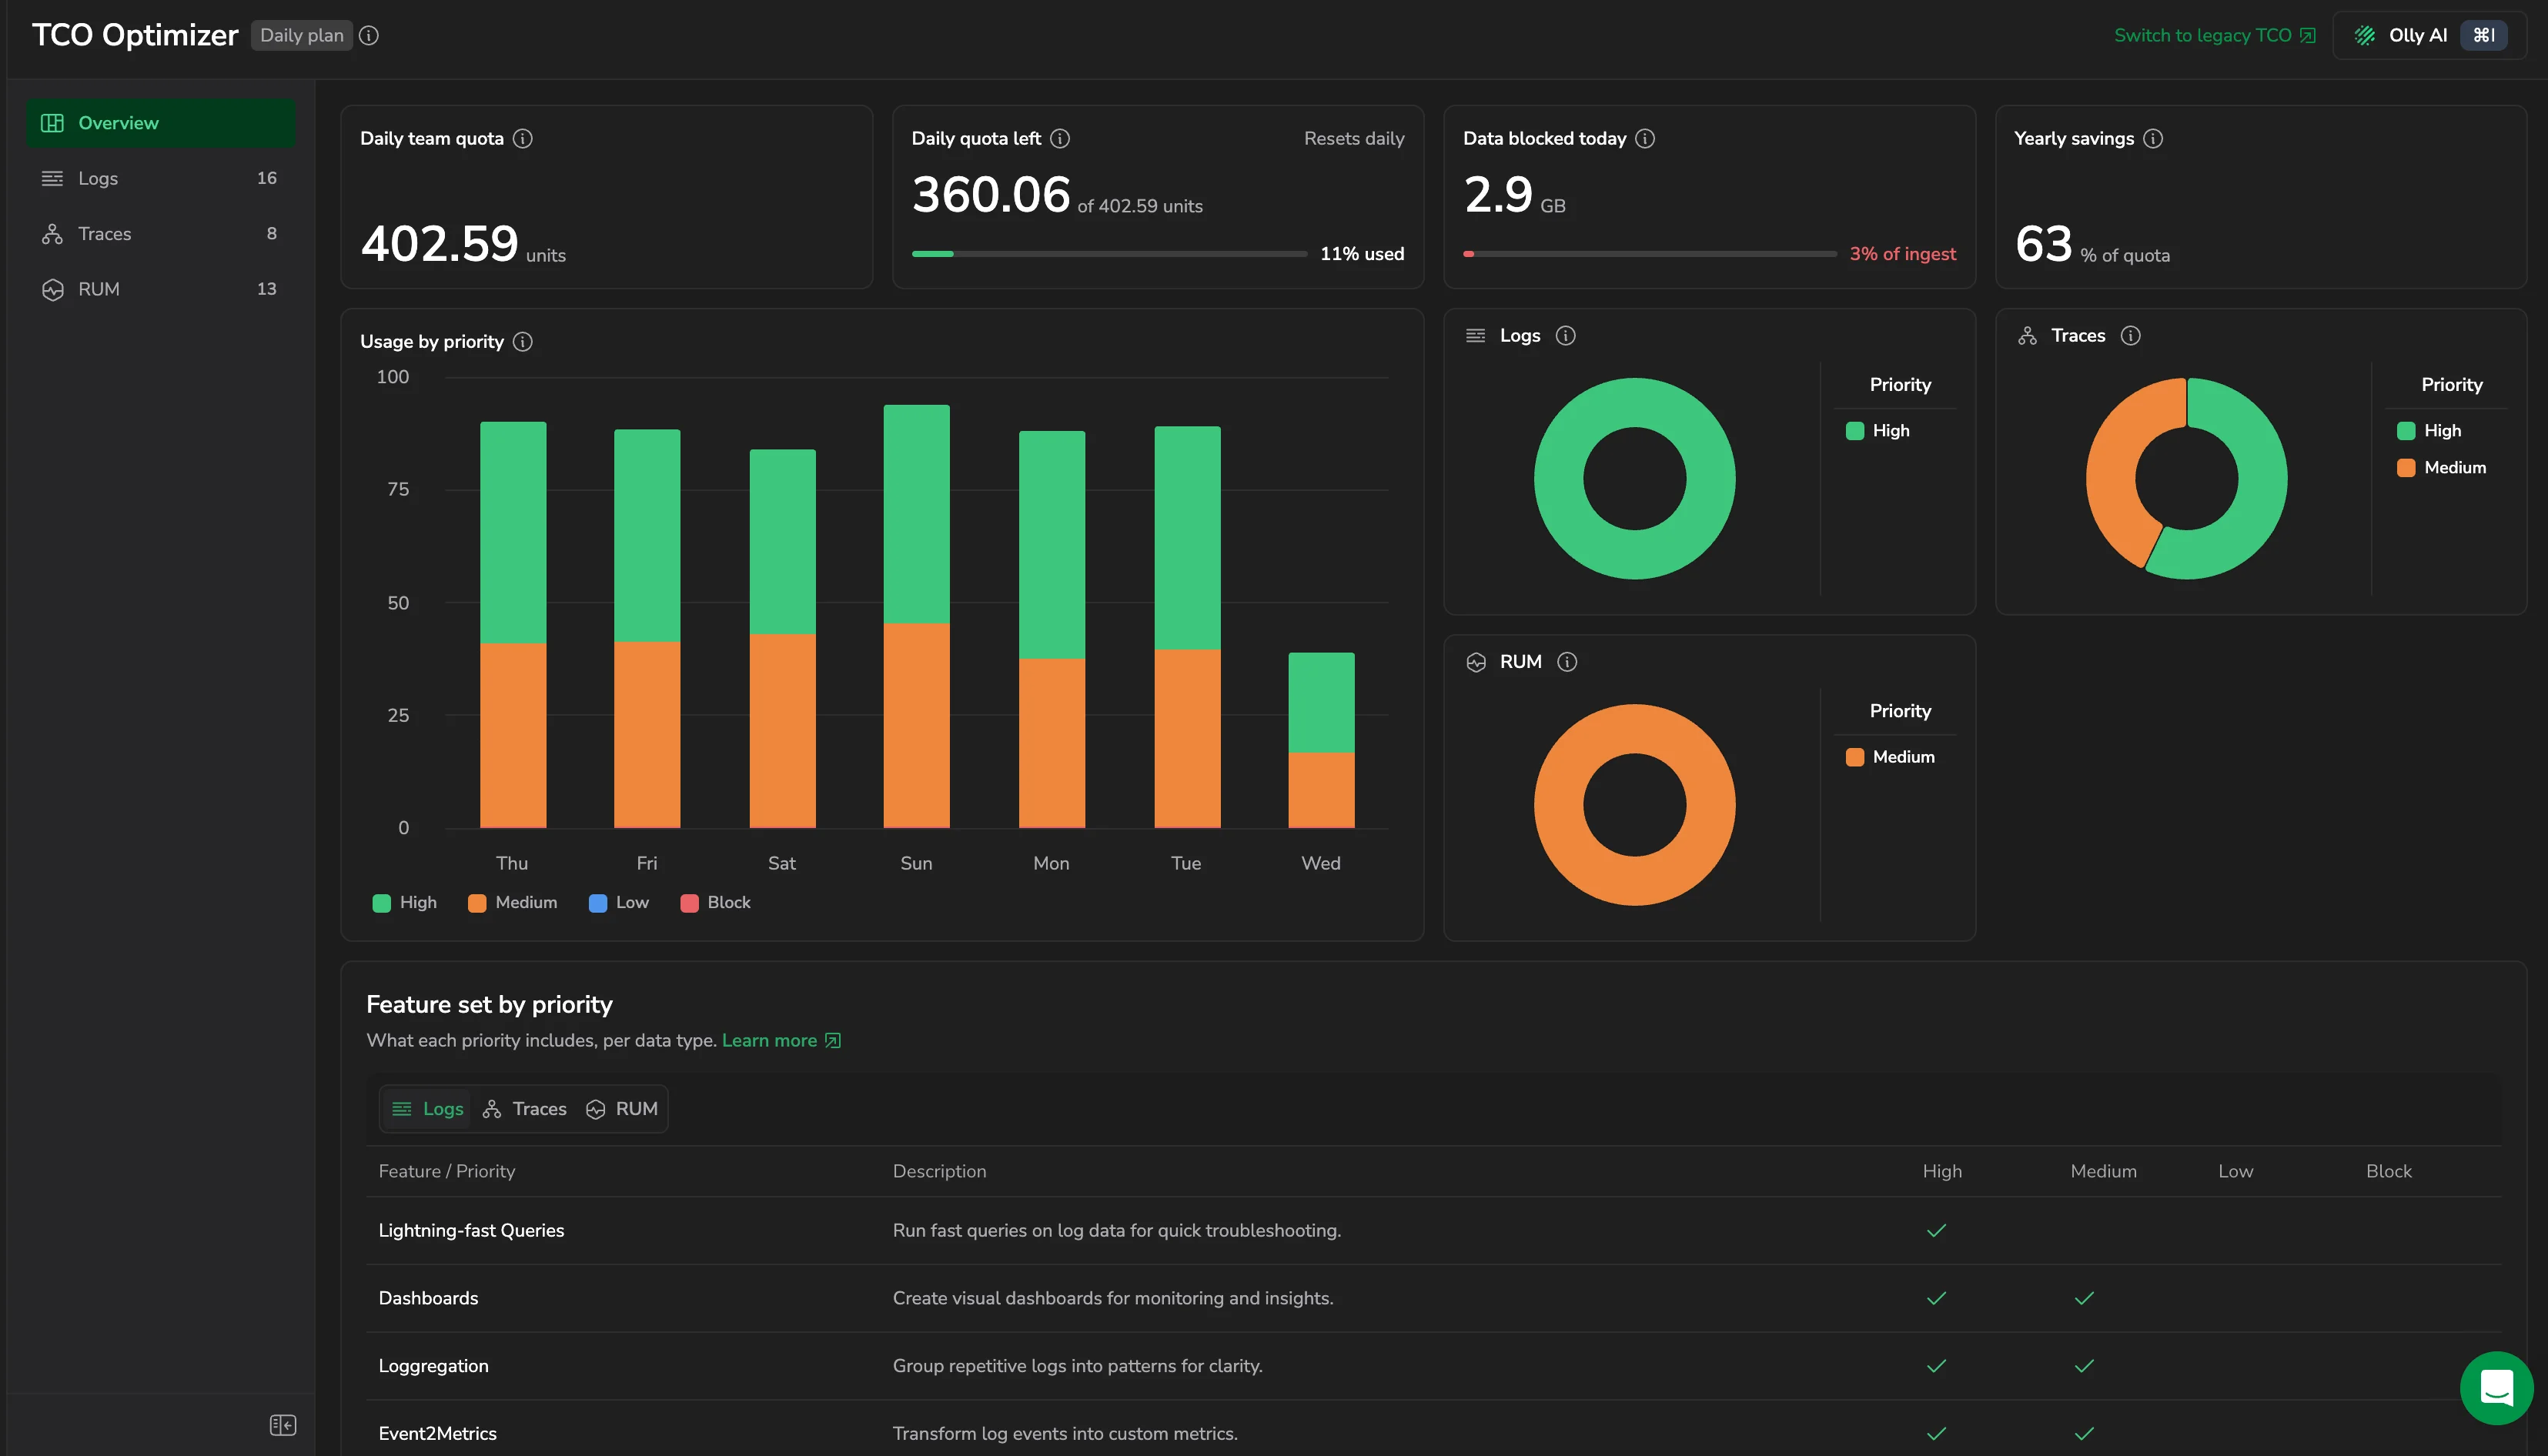
The page includes:
Daily team quota
Shows your available daily unit quota. Coralogix uses a unit-based pricing model, where a unit is a universal billing metric per observability pillar.
Daily quota left
Shows how many units remain of your daily quota, with a progress bar and the percentage used. The quota resets daily.
Data blocked today
Shows how much data your policies blocked today, in GB, and what share of your ingest that is.
Yearly savings
Shows the estimated yearly saving as a percentage of your quota, from routing data to Medium (Monitoring) and Low (Compliance) instead of High (Frequent Search).
Usage by priority
A stacked bar chart of daily usage over the last seven days, split by High, Medium, Low, and Block.
Usage per data type
A chart for each of Logs, Traces, and RUM shows how that data type's usage is split across priorities.
Feature set by priority
A table of what each priority includes, with a tab for Logs, Traces, and RUM. Each row is a feature with a description and a check mark under every priority that supports it. The Learn more link opens Features by priority level.
Use the Overview to quickly assess quota consumption, validate the impact of your TCO policies, and identify opportunities for further cost optimization.
Statistics
Statistics show ingested logs, traces, or RUM events organized by key dimensions and their contribution to usage. Use this view to identify high-volume data and turn it into policies. Statistics are an aggregate over the time range you select, Last 24 hours or Last 7 days. To see which priority a quota-based policy is in right now, see Live policy status.
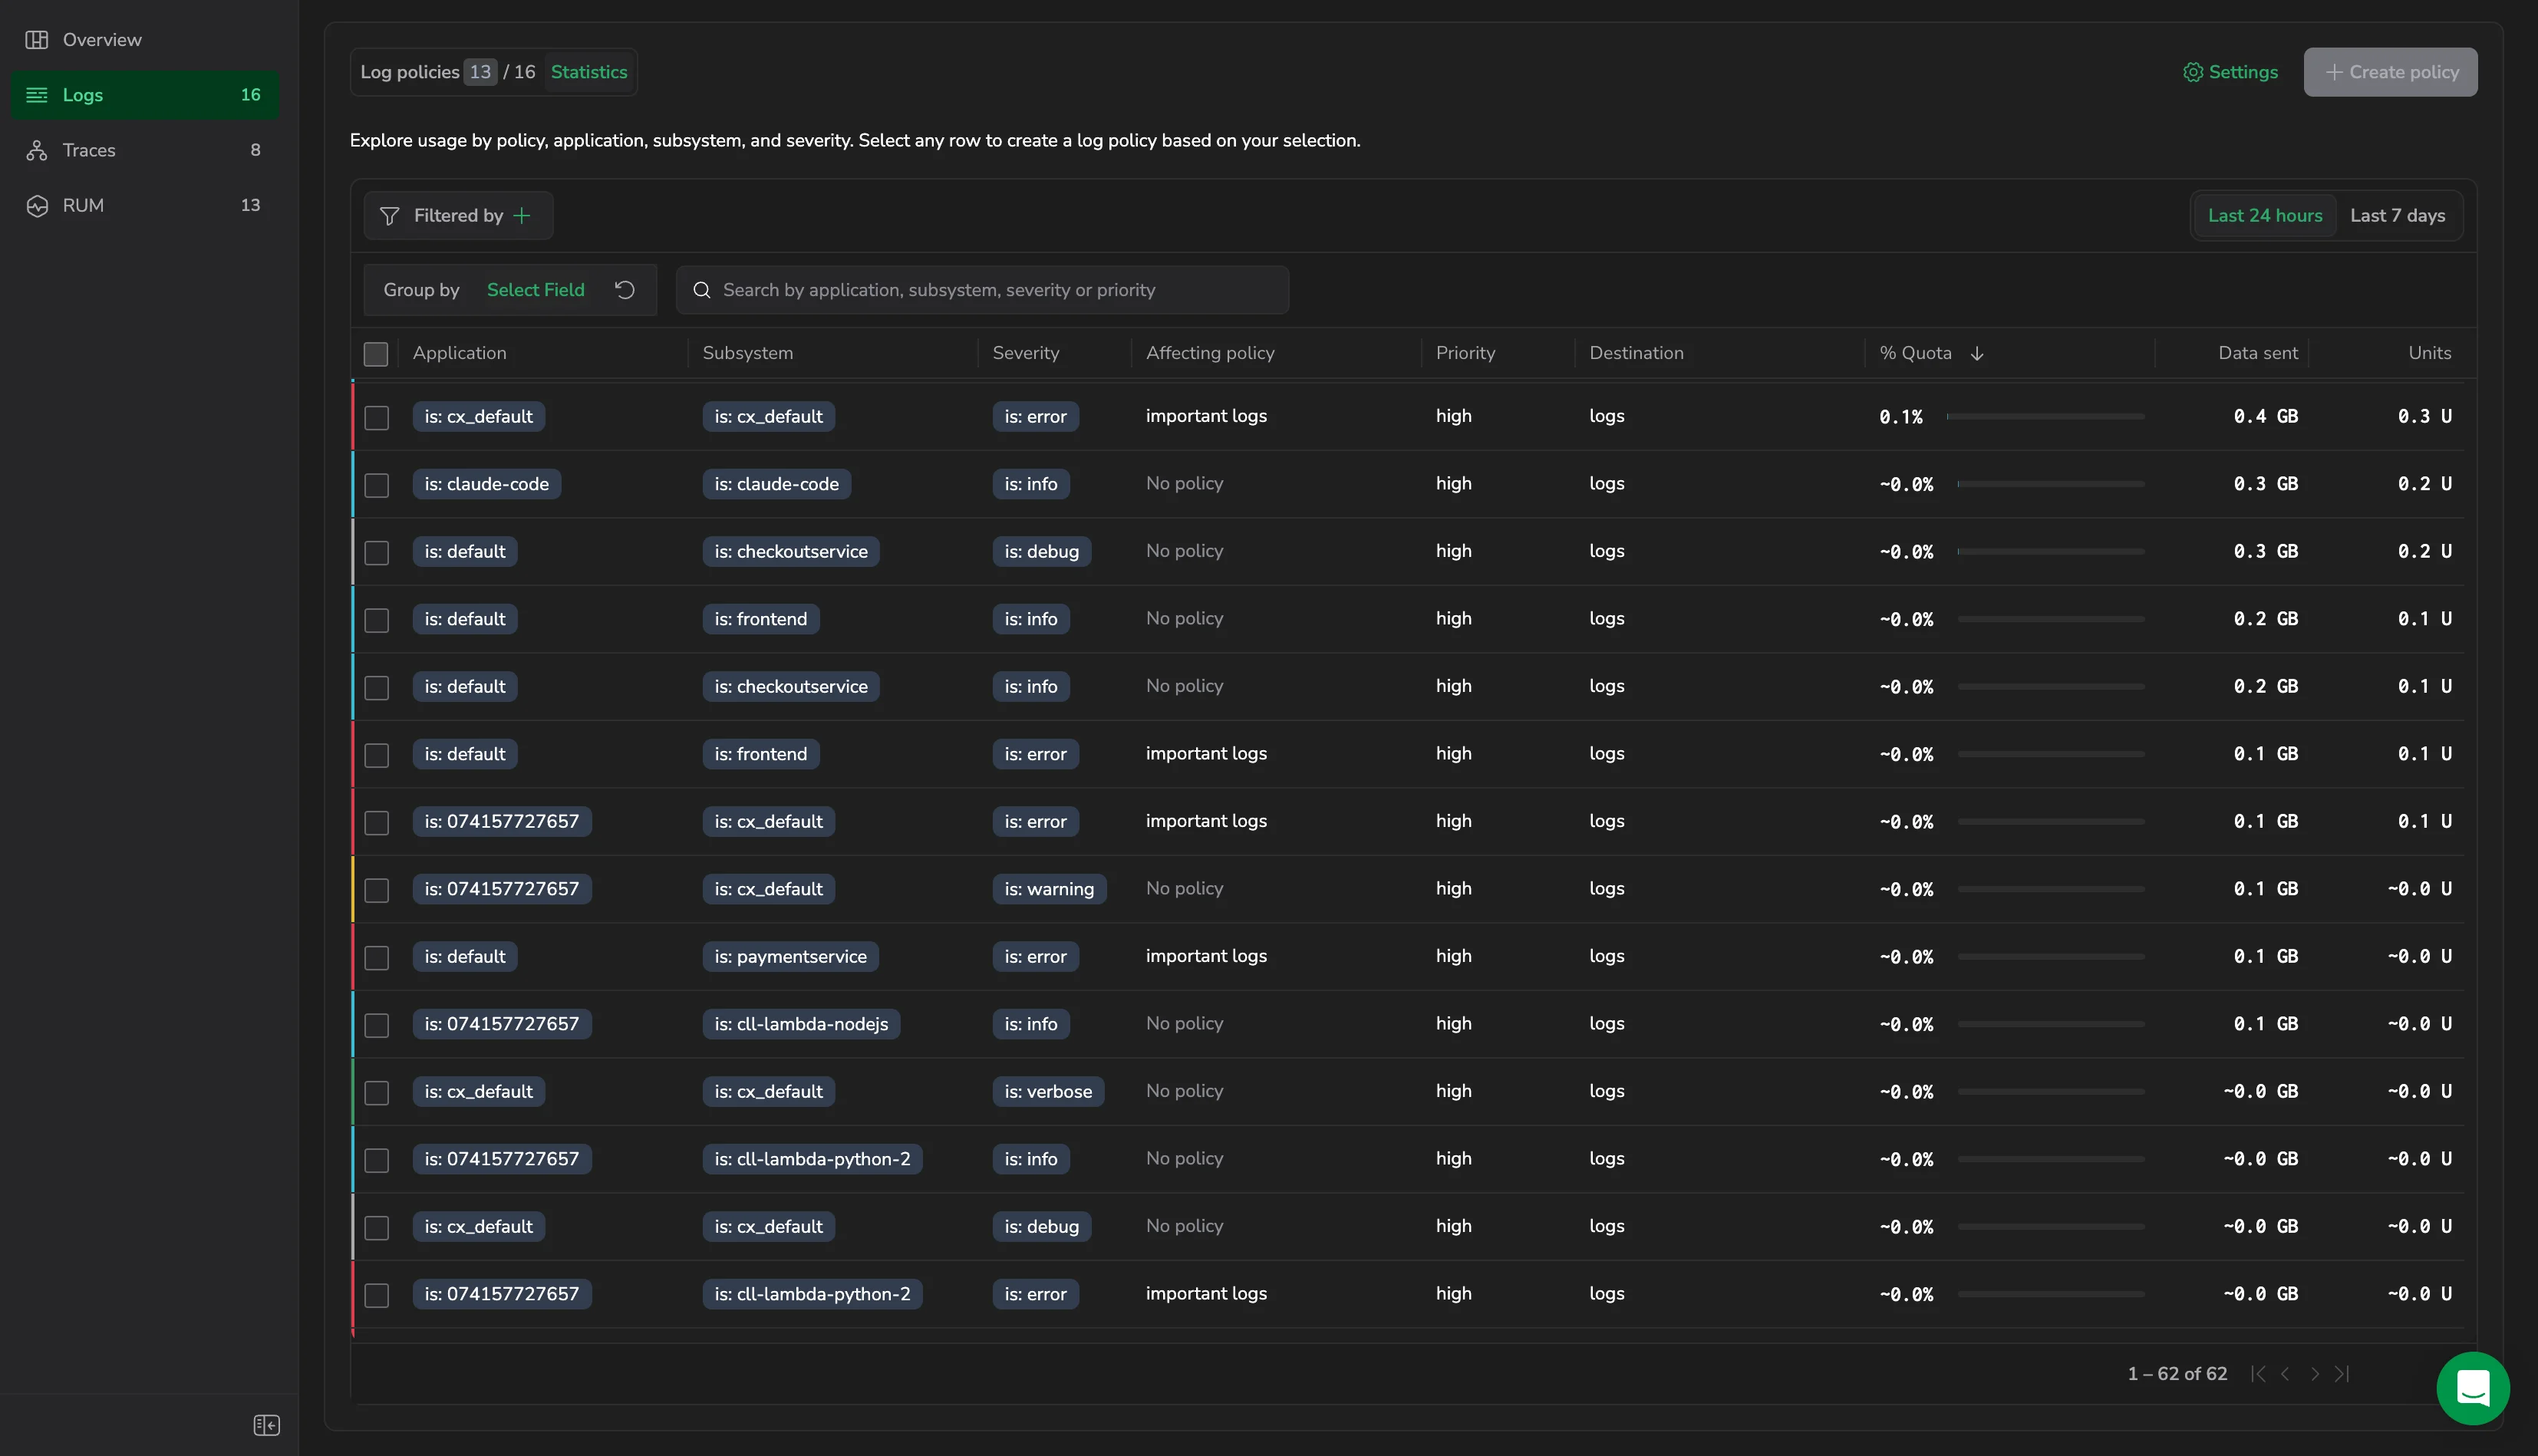
The Destination column is available on the Logs tab. RUM statistics do not include it, because RUM policies always route to default/rum.events.
Use this view to:
- Group by
application,subsystem,severity,affecting policy, andpriority - Expand an application to see its subsystems, then expand a subsystem to see its severity breakdown
- See the Destination each combination is routed to, alongside its Affecting policy and Priority
- See contribution to % Quota, Data sent, and Units (U) for each combination
- Validate expected impact before saving
Row menu actions
- Add rule: Pre-fills the policy form with the row's values
- Drill into logs: Opens a query filtered to the row's values
- Copy as filter: Copies application, subsystem, and severity chips for reuse
Slice and filter the data
- Group by chips: Choose which fields to include in the breakdown. Drag and drop chips to rearrange them.
- Filtered by: Add filters to narrow the rows.
- Search: Filter rows by application, subsystem, severity, or priority (supports partial matches).
- Include/exclude values: Use chip menus to add or remove specific values.
- Reset: Clear temporary filters and return to the default settings.
Create a policy from statistics
Turn any selection into a policy without leaving the page:
- Select a row. The Create policy button is inactive until you do.
- Choose Add rule. The Create policy form opens with the Builder pre-filled.
- Choose a priority: High (Frequent Search), Medium (Monitoring), Low (Compliance), or Blocked.
- (Optional) Set archive retention.
- Review the Preview panel for data sent, % quota, and units impact.
- Toggle Enable policy on to activate immediately.
- Select Create.
The new policy appears in the TCO rules table. Order matters. Set Policy order to place it First (highest precedence) or Last.
Understand the "affecting policy" column
When a combination already matches a policy, the Affecting policy column displays the policy currently in effect.
Use it to:
- Avoid creating duplicate policies
- Spot combinations that fall into the default High (Frequent Search) priority (shown as No policy)
- Decide whether to edit an existing policy or add a higher-precedence one