AI-SPM
Overview
AI-SPM (AI Security Posture Management) within the AI Center offers CISOs and security teams a holistic view of AI usage within their organization, enabling them to identify risks and enforce security best practices. It supports AI application discovery, allowing teams to monitor where and by whom AI is being used. The dashboard highlights key security metrics, including identified security issues, insights into risky users, and an overall AI Security Posture Score.
Why you need AI-SPM
Use the AI-SPM to:
Generate a detailed report on AI use in your repositories, empowering you to develop and execute effective mitigation strategies.
Get insights on high-risk users and activities, helping you prioritize your investigation efforts.
Visualize AI application usage across the organization to maintain compliance and ensure performance integrity.
How it works
The AI-SPM page displays security issues, user insights, and other relevant data for all previously integrated AI apps. Here’s an overview of how AI-SPM works, detailing the steps and processes for effective use:
Use AI Discovery integration with GitHub to initiate a scan across all GitHub repositories within the organization to identify AI-related code and determine if the apps are being monitored by Coralogix. This discovery helps uncover other AI-powered apps that could be monitored. For integration details, consult the GitHub App for AI Discovery guide.
Once the scan is complete, a summary of all AI projects within the organization is provided.
The AI-SPM dashboards are updated with key security and user data, including the total number of AI applications and any security violations. Additionally, AI-SPM calculates an overall security posture score (ranging from 1 to 100), based on the number of apps monitored by Coralogix and whether they have security evaluations assigned to them.
Accessing the AI-SPM
- In the Coralogix UI, navigate to AI Center > AI-SPM.
- Use the time picker to select the desired time interval for metrics collection.
Discovering new AI apps
Scan your GitHub repositories to identify all AI-related code.
- Ensure you have organization-wide GitHub access permissions, as only users with this level of access can initiate the app discovery.
In the AI App Discovery section of the AI-SPM page, click Integrate GitHub.
The system will scan all GitHub repositories within your organization.
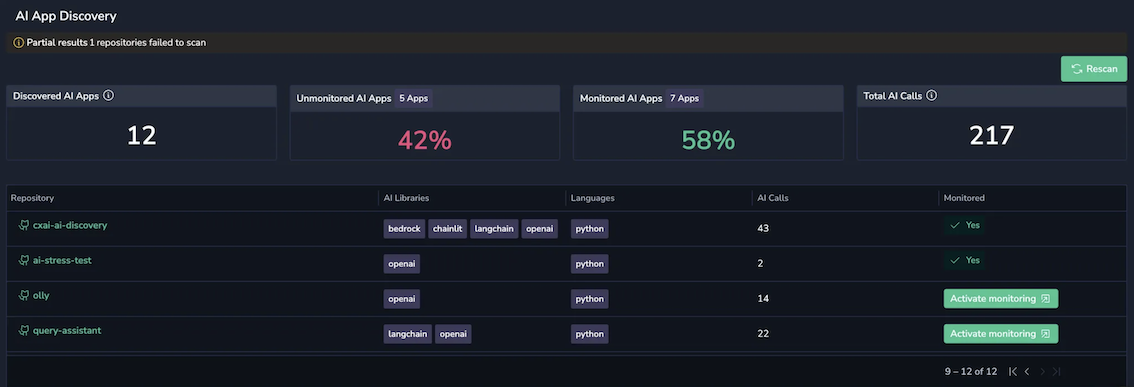
- Once the scan is complete, the list of discovered AI apps is displayed in the AI App Discovery section on the AI-SPM page.
The following details on the discovered apps will be available:
- Discovered AI Apps – Total number of AI apps identified during the scan.
- Unmonitored AI Apps – The percentage of discovered AI apps that have not yet been integrated for monitoring, relative to the total number of all discovered apps.
- Monitored AI Apps – The percentage of discovered and monitored AI apps, relative to the total number of all discovered apps.
- Total AI Calls – The total number of LLM calls made by each detected AI application.
- Repository – The GitHub repository containing the discovered AI apps.
- AI Libraries – The AI libraries utilized by the discovered AI apps.
- Languages – The programming languages in which the discovered AI apps are written.
- AI Calls – The total number of calls made by all monitored AI apps within the repository.
Monitored – Indicates whether the AI repository is currently monitored by Coralogix, meaning its app is sending data to Coralogix.
- Yes – Navigates to the application in GitHub.
- Activate monitoring – Opens the GitHub App for AI Discovery guide that outlines the app integration with Coralogix.
Totals
This section includes the following counters:
- Total AI Applications – The total number of discovered AI apps (monitored and unmonitored).
- Total Security Violations – The total number of security violations recorded across all monitored apps.
AI Security Posture Score – A calculated score based on two factors:
- 50 points if all the user's applications, including those discovered in AI discovery, are monitored by Coralogix.
- 50 points if all applications have at least one security policy.
For example, if 1 out of 7 applications lacks a security policy, the user's score will be reduced proportionally, rather than losing the full 50 points.
Security issues over time
Visualize your application usage, displaying the total number of LLM calls (prompts and responses) and the call count flagged for security issues. Hover over the graph to see the data distribution for any specific time point.
- Total LLM Calls – The total LLM calls (prompts and responses) across all monitored applications.
- Prompt Issues – The total number of prompts that contain issues.
- Response Issues – The total number of responses that contain issues. For example, if a single prompt contains three different issues, it should still be counted as one issued prompt.
User insights
Gain a clear, concise overview of user data and trends, making it easy to compare app users and identify high-cost, high-spend, and high-risk profiles.
- High-Activity Users – Top 5 users who sent the most messages in the application, including the total number of messages sent.
- High-Spending Users – The top 5 users with the highest spending (based on the cost of their messages in the application), including their total spend.
- Risky Users – The top 5 users with the most security-related issues detected in their messages, including the total number of flagged messages.
Note
This capability is available only if the optional User ID parameter is provided during the AI Observability setup.


