Monitor your applications
Monitoring is one of four capabilities in AI Center, a complete platform for monitoring AI applications alongside Guardrails, Evaluations, and AI SPM. Use Monitoring to track the health, performance, cost, quality, and security of every AI application across your organization, and drill from an org-wide signal to the exact AI span that caused it.
AI Center is built around a top-down investigation flow: start with an organization-wide view, identify which application needs attention, then drill into that application down to the span level. This is the fastest path from "something looks wrong" to root cause.
How the views connect
AI Center has three complementary views that work together:
| View | What it shows | When to use it |
|---|---|---|
| Overview | Organization-wide metrics: trends, issues, cost, errors, and latency across all AI applications | Start here to spot what's changing |
| Application Catalog | All applications in one sortable table | Use it to compare KPIs and identify which app to investigate |
| Application Drilldown | Deep metrics for a single application | Use it to understand errors, cost, latency, issues, and tool usage for one app |
The typical flow:
- Overview. Open the Overview to see the health of every LLM-based application across your entire team in one place. Spot what's changing: issue rates, cost spikes, latency trends.
- Application Catalog. Sort by any KPI to find the application that needs attention.
- Application Drilldown. Inspect errors, latency, and issues for that application.
- AI Explorer. Find the specific AI span. Navigate from the application level to the exact prompt-response pair that caused the problem.
Navigate to AI Center
- In the Coralogix UI, select AI Center, then AI Apps, then Overview. AI Center has three sections in the navigation sidebar: AI Apps, Code Agents, and AI-SPM. Selecting AI Center always opens AI Apps.
- Use the time picker to set the time range.
- Review the team-wide metrics in the Overview.
- Open the Application Catalog to compare applications across your team and select one to investigate.
- In the Application Drilldown, review errors, latency, cost, issues, and tool calls for that application.
Overview
The Overview gives you a cross-application snapshot, one place to see whether anything is trending in the wrong direction across your entire AI portfolio. Use the sidebar to move between Insights, Overview, Cost, Issues, Errors, and Latency.
A banner at the top of the page counts how many of your applications are unguarded and offers Integrate guardrails. Create alert in the page header opens the AI Center Alerts extension.
Every widget on the Overview and the Application Drilldown is a way into AI Explorer. Select a KPI tile, a bar, a point on a chart, or a row in a table, and AI Explorer opens with the matching filter, sort, and time range already applied, so you land on the spans behind the number you selected. Drag across a chart to move the page's time range to that window.
Insights
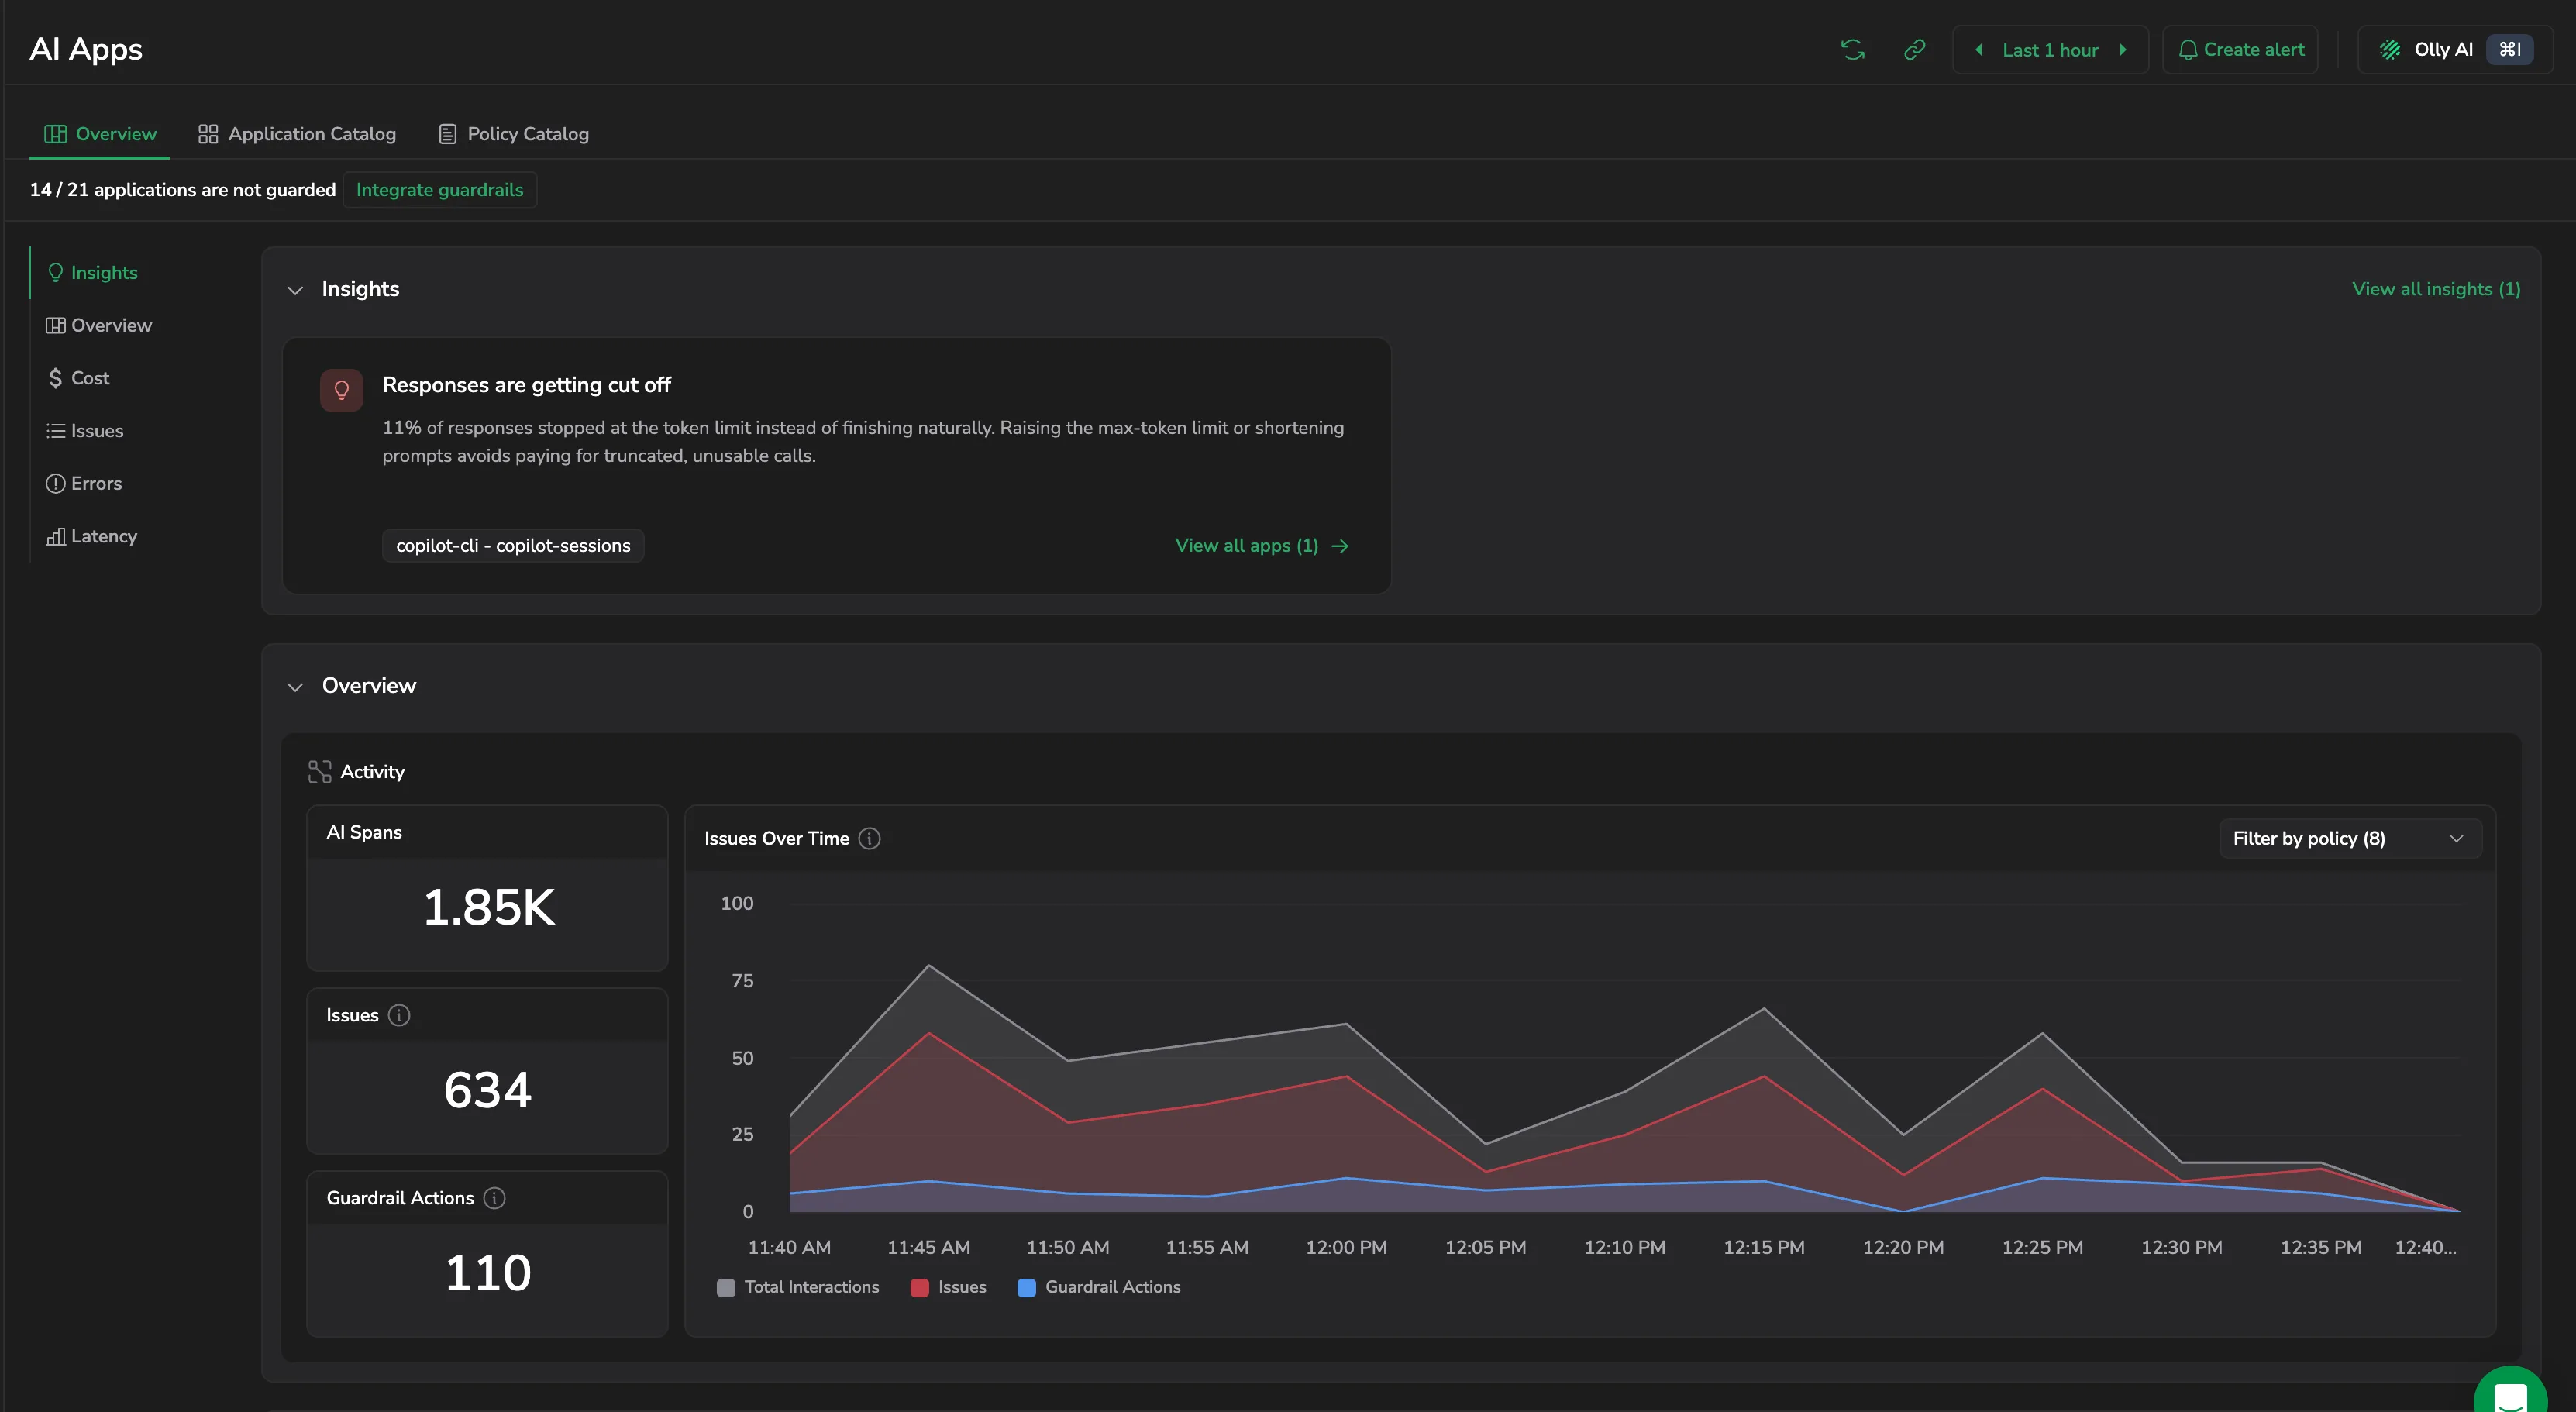
Ranked observations Coralogix detects from live span data, such as responses truncated at the token limit or tool-call chains running long. Each card names the pattern, explains what it costs you, and lists the applications it affects.
- Select an application chip to open that application.
- Select View all apps on a card to see every affected application.
- Select View all insights to open the full set in a drawer.
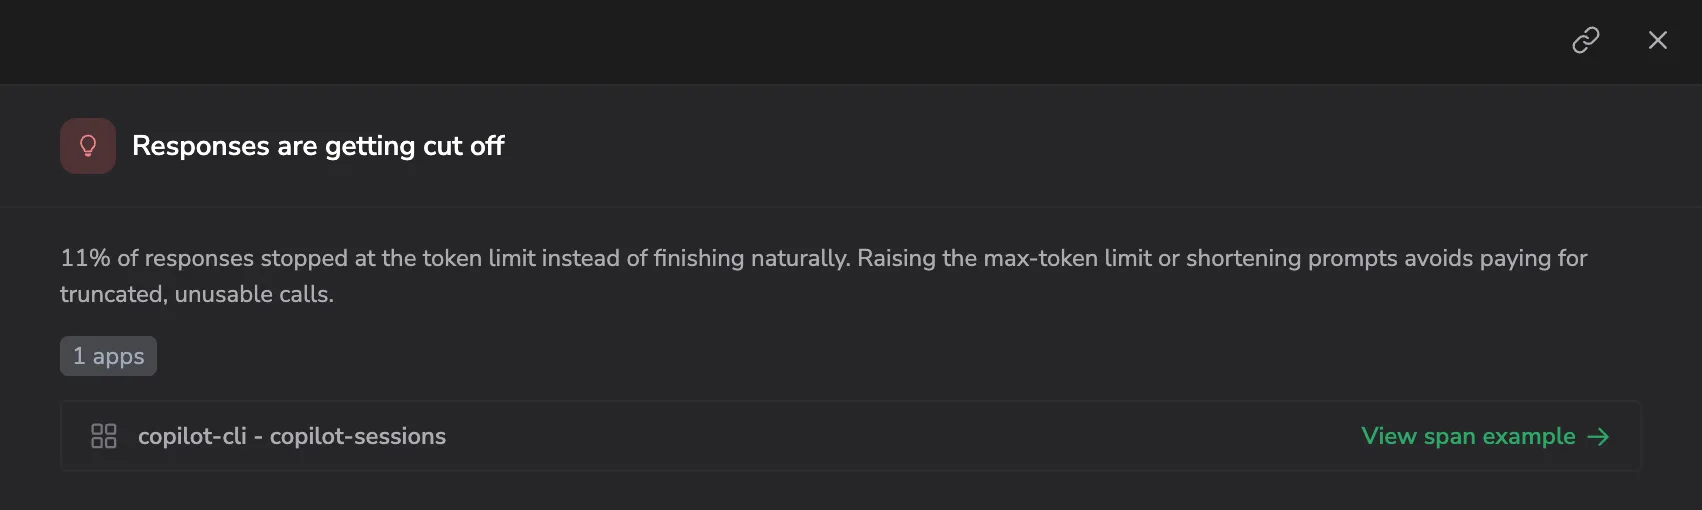
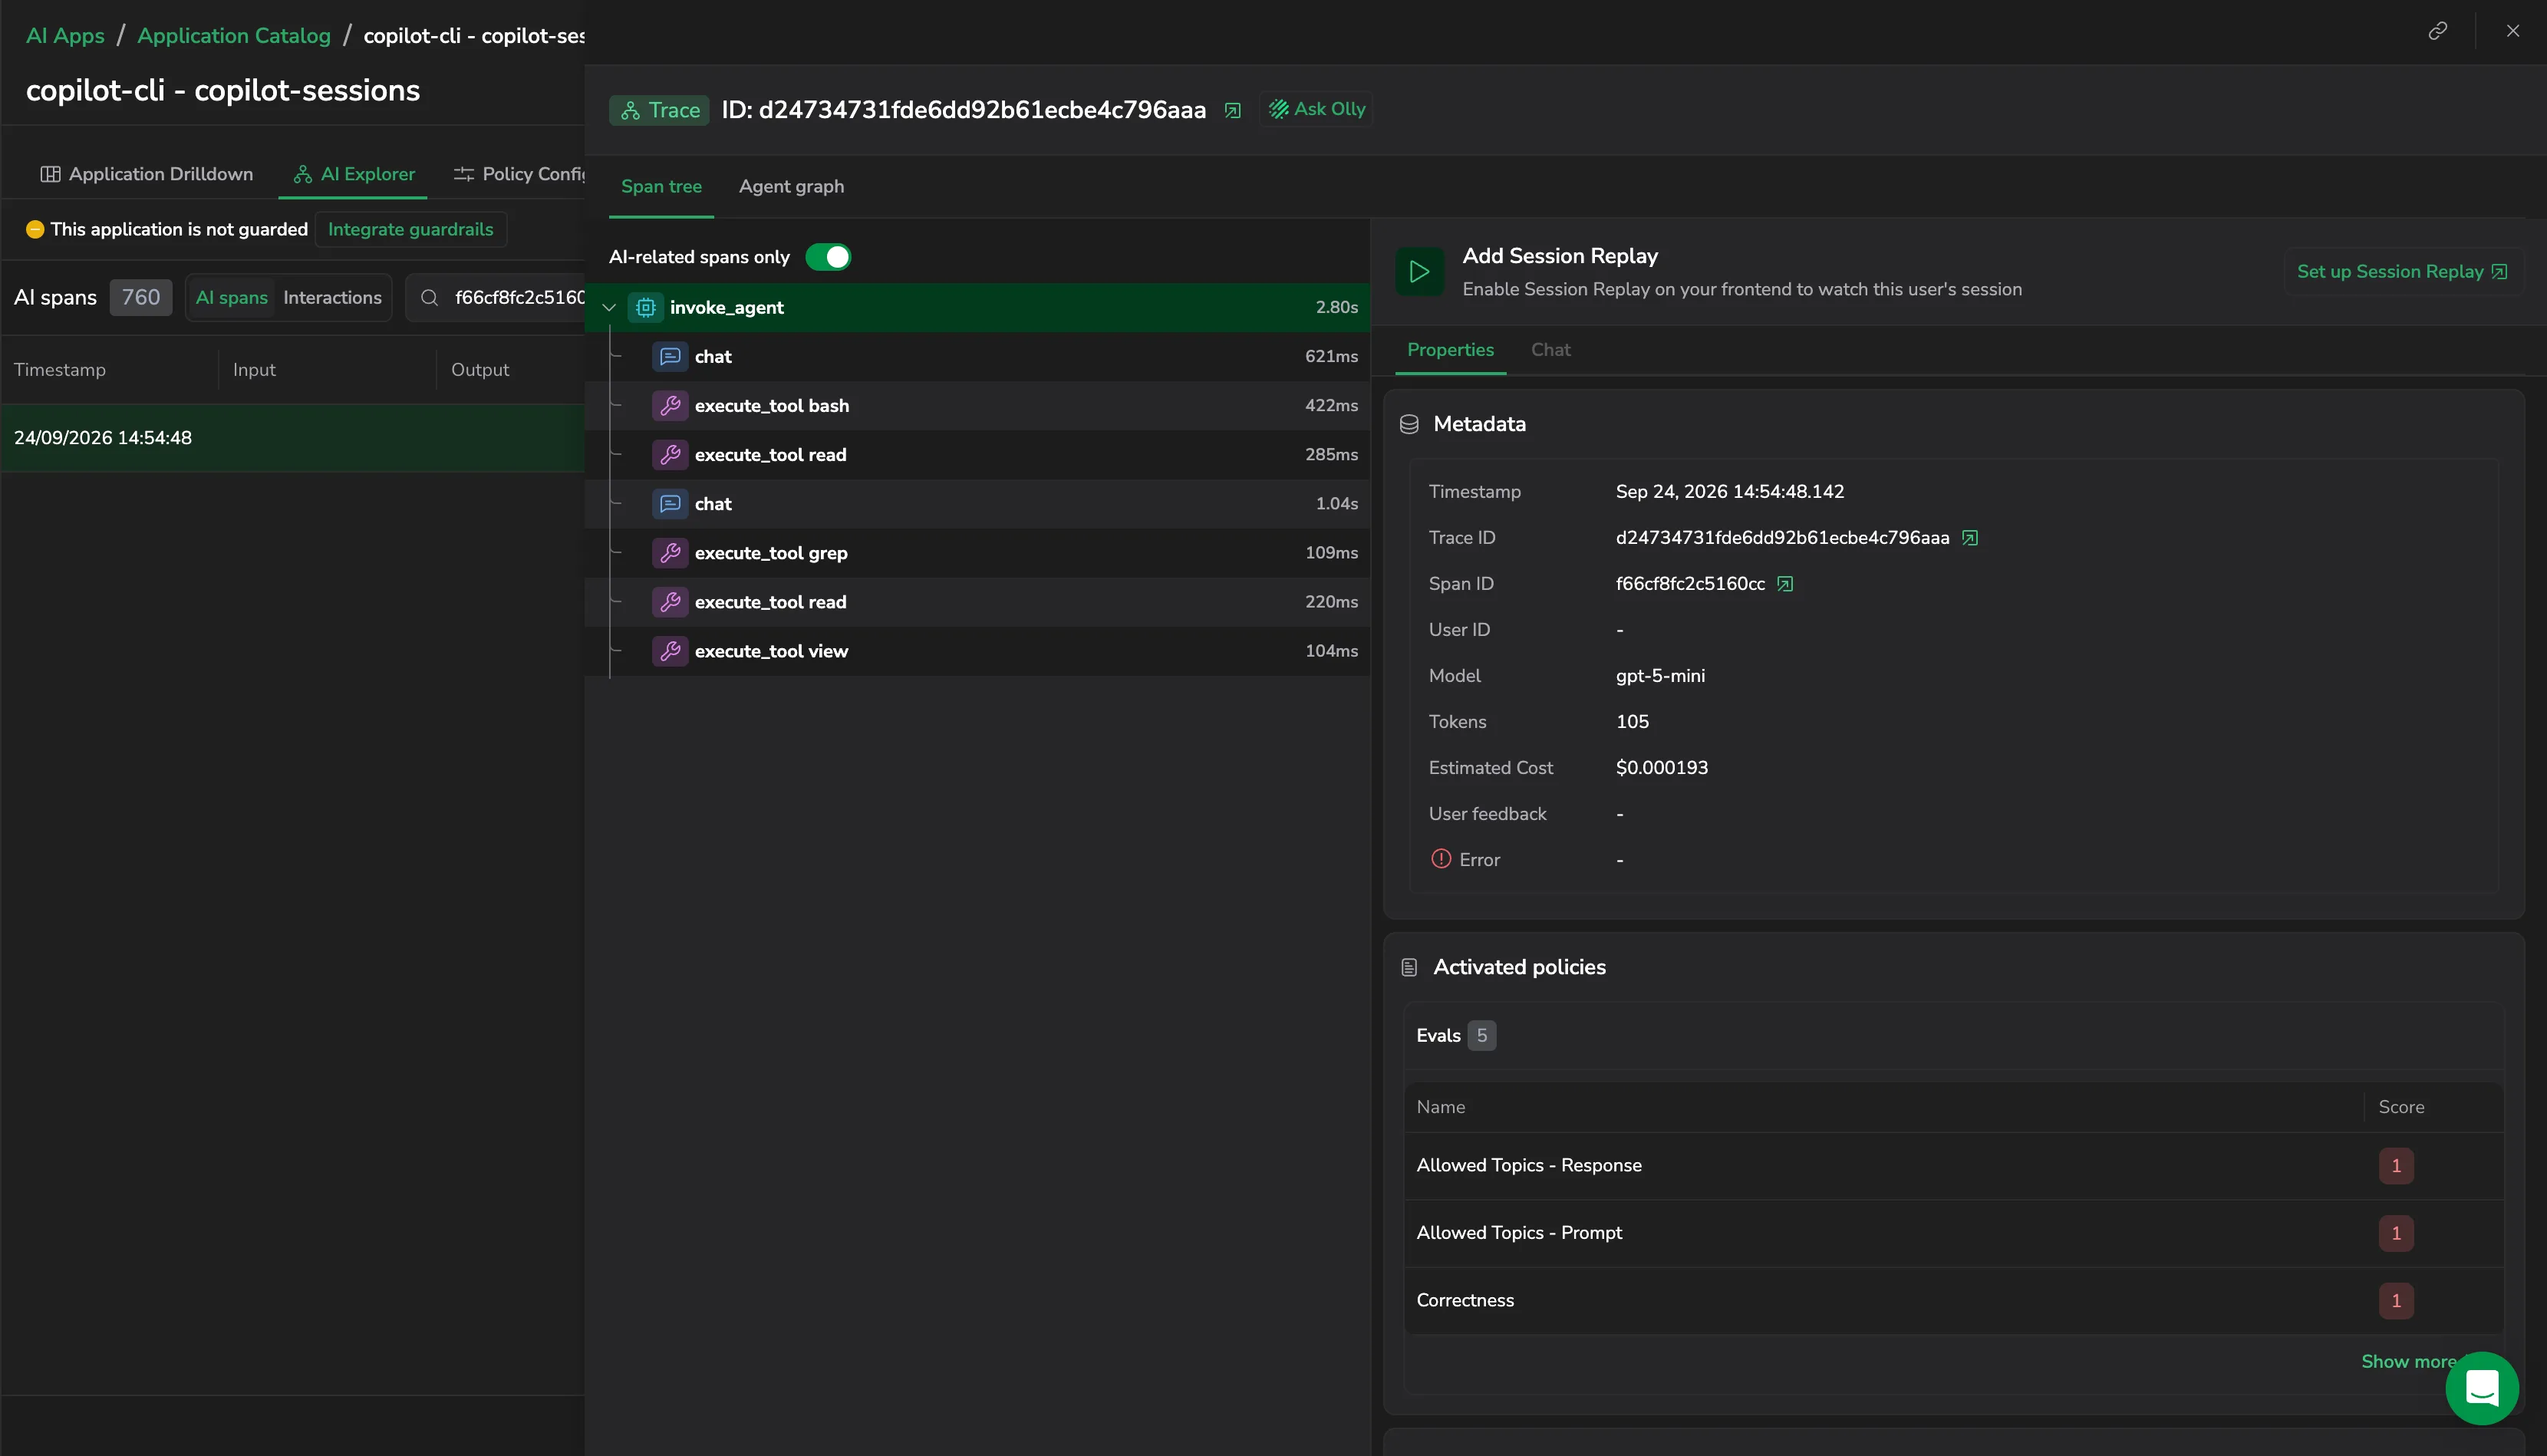
From the drawer, select View span example to open a representative span in AI Explorer, with the span tree, metadata, and activated policies already in view. That takes you from a pattern to the single request that demonstrates it in two selections.
Activity
- AI Spans: total AI spans across all applications.
- Issues: evaluation issues and guardrail issues combined.
- Guardrail Actions: spans where a guardrail policy triggered.
- Issues Over Time: three series, Total Interactions, Issues, and Guardrail Actions, on a single timeline. Use Filter by policy to narrow the chart to the policies you care about.
Cost
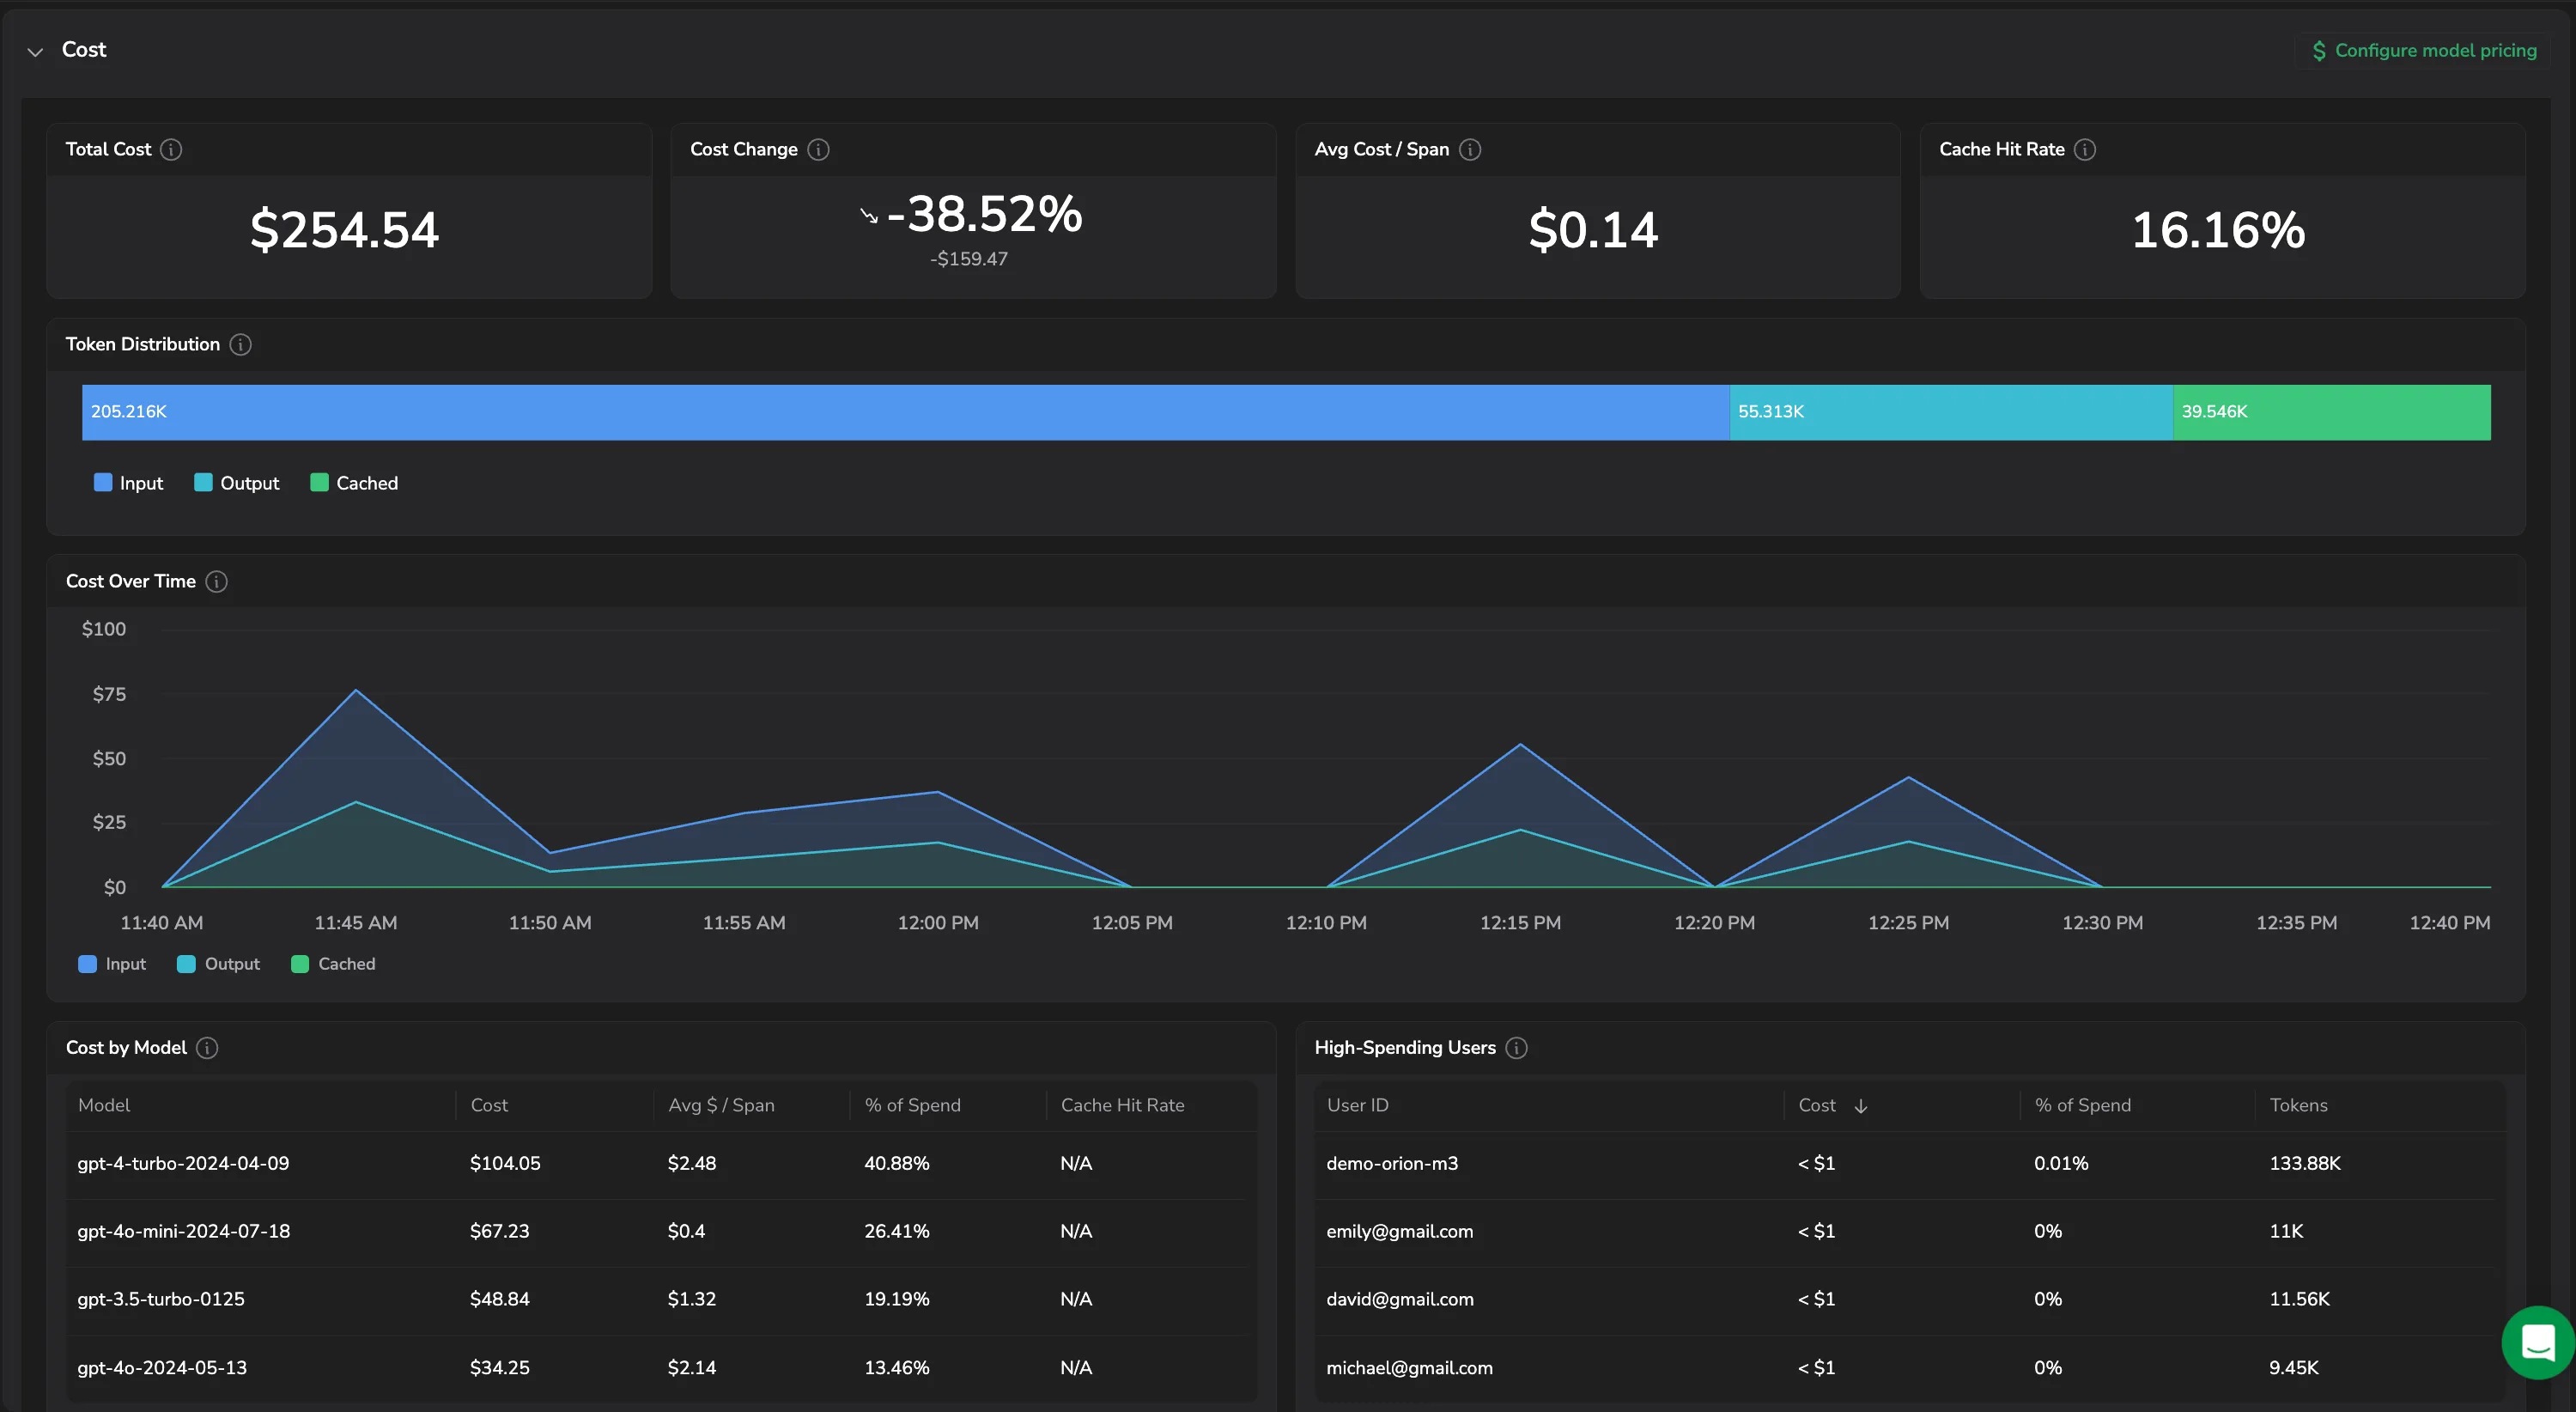
- Total Cost and Cost Change: spend for the period, and how it compares with the previous equal period.
- Avg Cost / Span: how expensive a typical span is.
- Cache Hit Rate: how much of your input is served from cached context. The single biggest lever on input-token cost.
- Token Distribution: the split between input, output, and cached tokens.
- Cost Over Time: when spend moved, broken out by token type.
- Cost by Model: Model, Cost, Avg $ / Span, % of Spend, and Cache Hit Rate.
- High-Spending Users: User ID, Cost, % of Spend, and Tokens.
Select Configure model pricing to set your own per-token rates. For the full picture, see Optimize AI costs.
Issues
AI introduces a new class of problems that traditional observability cannot detect. An LLM can respond with a 200 OK and still return a hallucination, leak sensitive data, generate toxic content, or be manipulated by a prompt injection attack. None of these appear as errors in your logs.
AI Center surfaces these risks in real time through two complementary mechanisms:
- Guardrails act in real time: intercepting, blocking, or modifying harmful outputs before they reach the user, not after.
- Evaluations continuously assess every AI output against configurable quality and security policies, detecting hallucinations, compliance violations, toxicity, and more.
Together, they give you both prevention and detection, closing the gap between "something went wrong" and "it never reached the user."
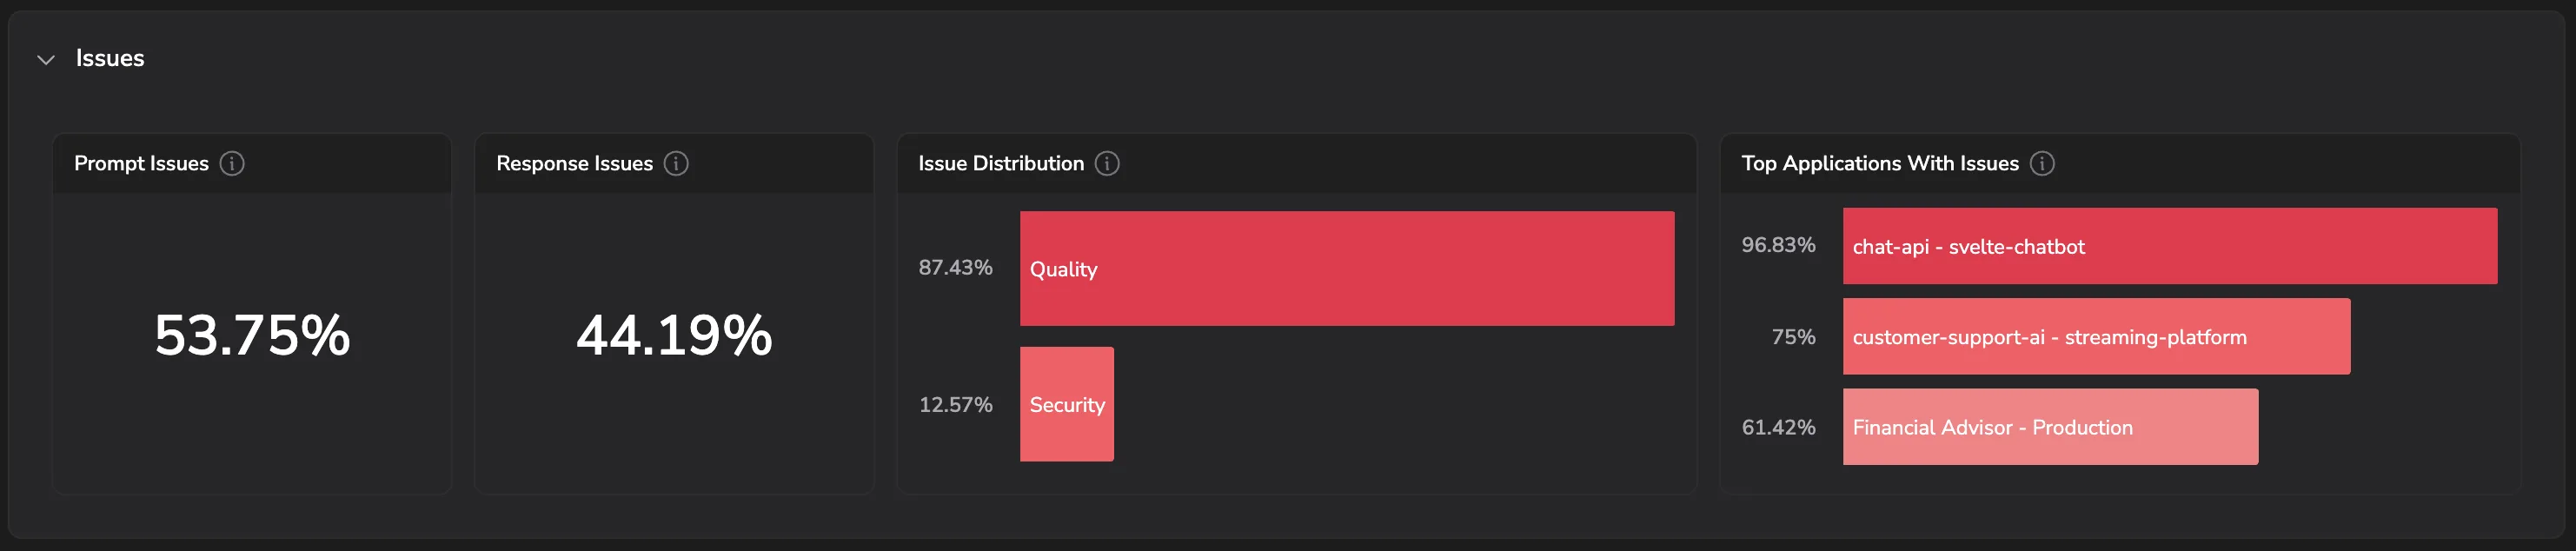
- Prompt Issues and Response Issues: the share of prompts, and of responses, that were flagged.
- Issue Distribution: the split between Quality and Security.
- Top Applications With Issues: the applications with the highest issue rate.
Start with the two rates to see where the problem sits, then use Issue Distribution to identify whether the driver is security or quality. Select any widget to inspect the specific AI spans in AI Explorer.
Errors
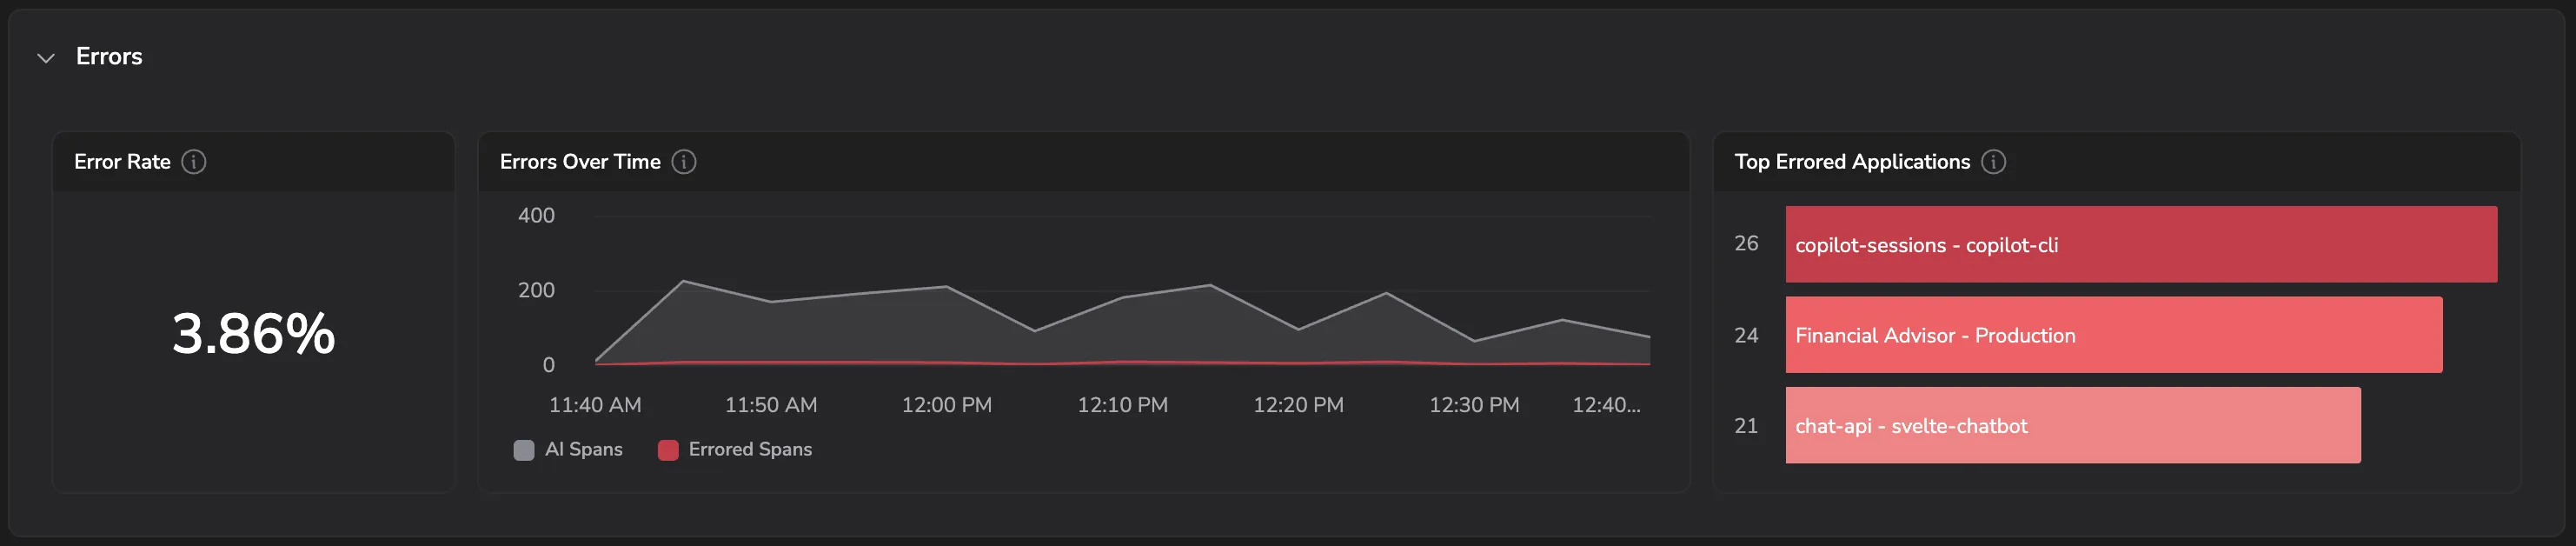
- Error Rate: percentage of errored traces.
- Errors Over Time: AI spans against errored spans across the period.
- Top Errored Applications: the applications producing the most errors.
Latency
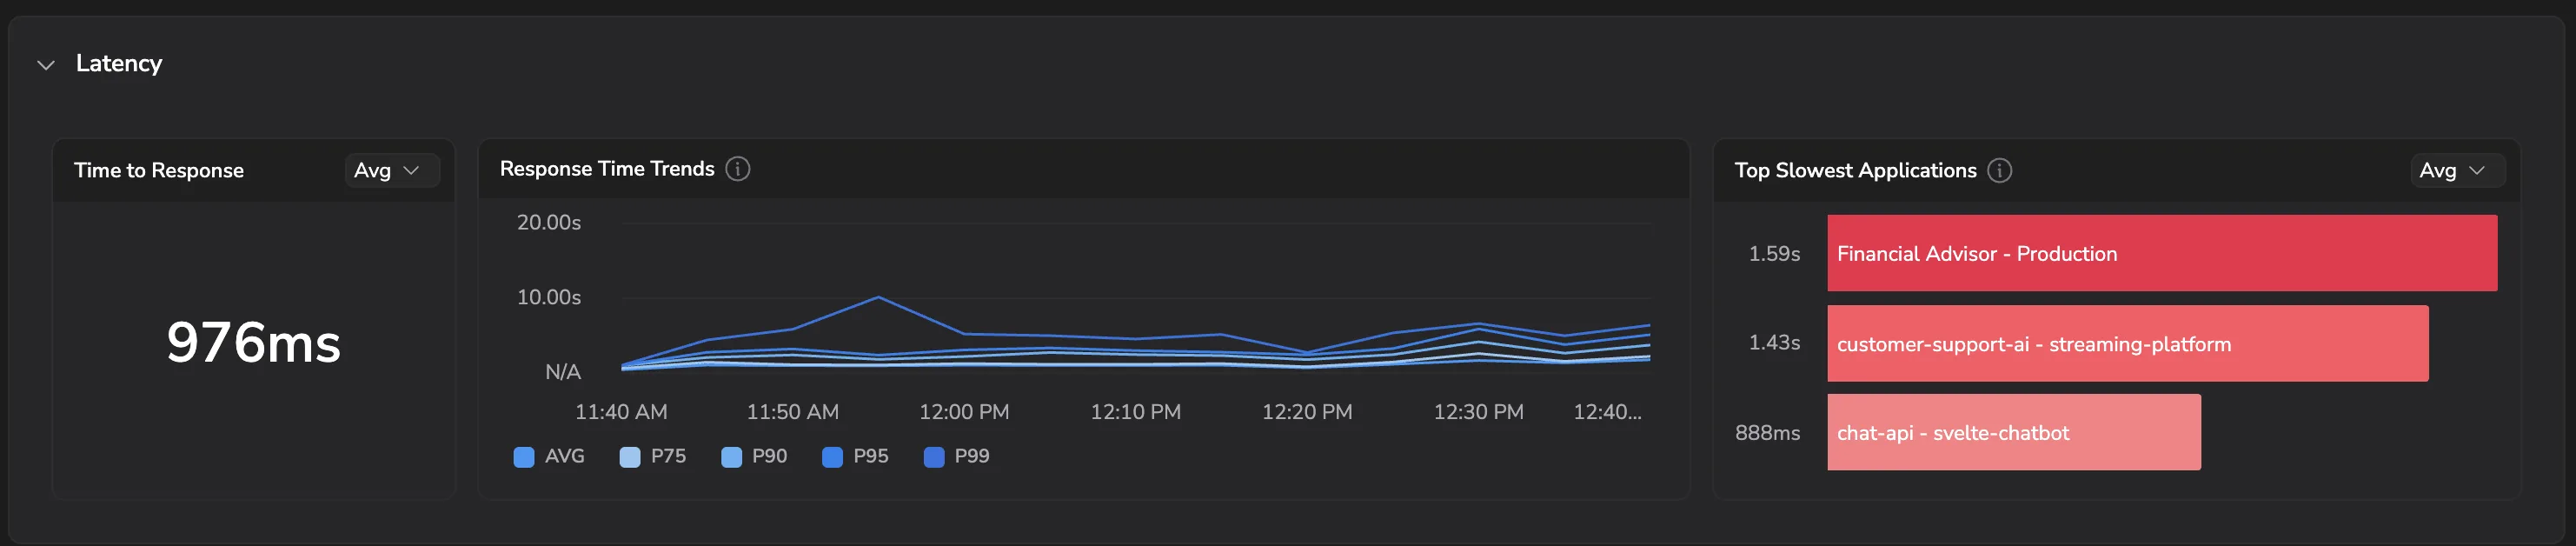
Percentiles help you separate typical latency from tail latency that affects a smaller but important set of users.
- Time to Response: response time for the statistic you pick, average by default.
- Response Time Trends: AVG, P75, P90, P95, and P99 across the period.
- Top Slowest Applications: the slowest applications, for the same statistic.
Application catalog
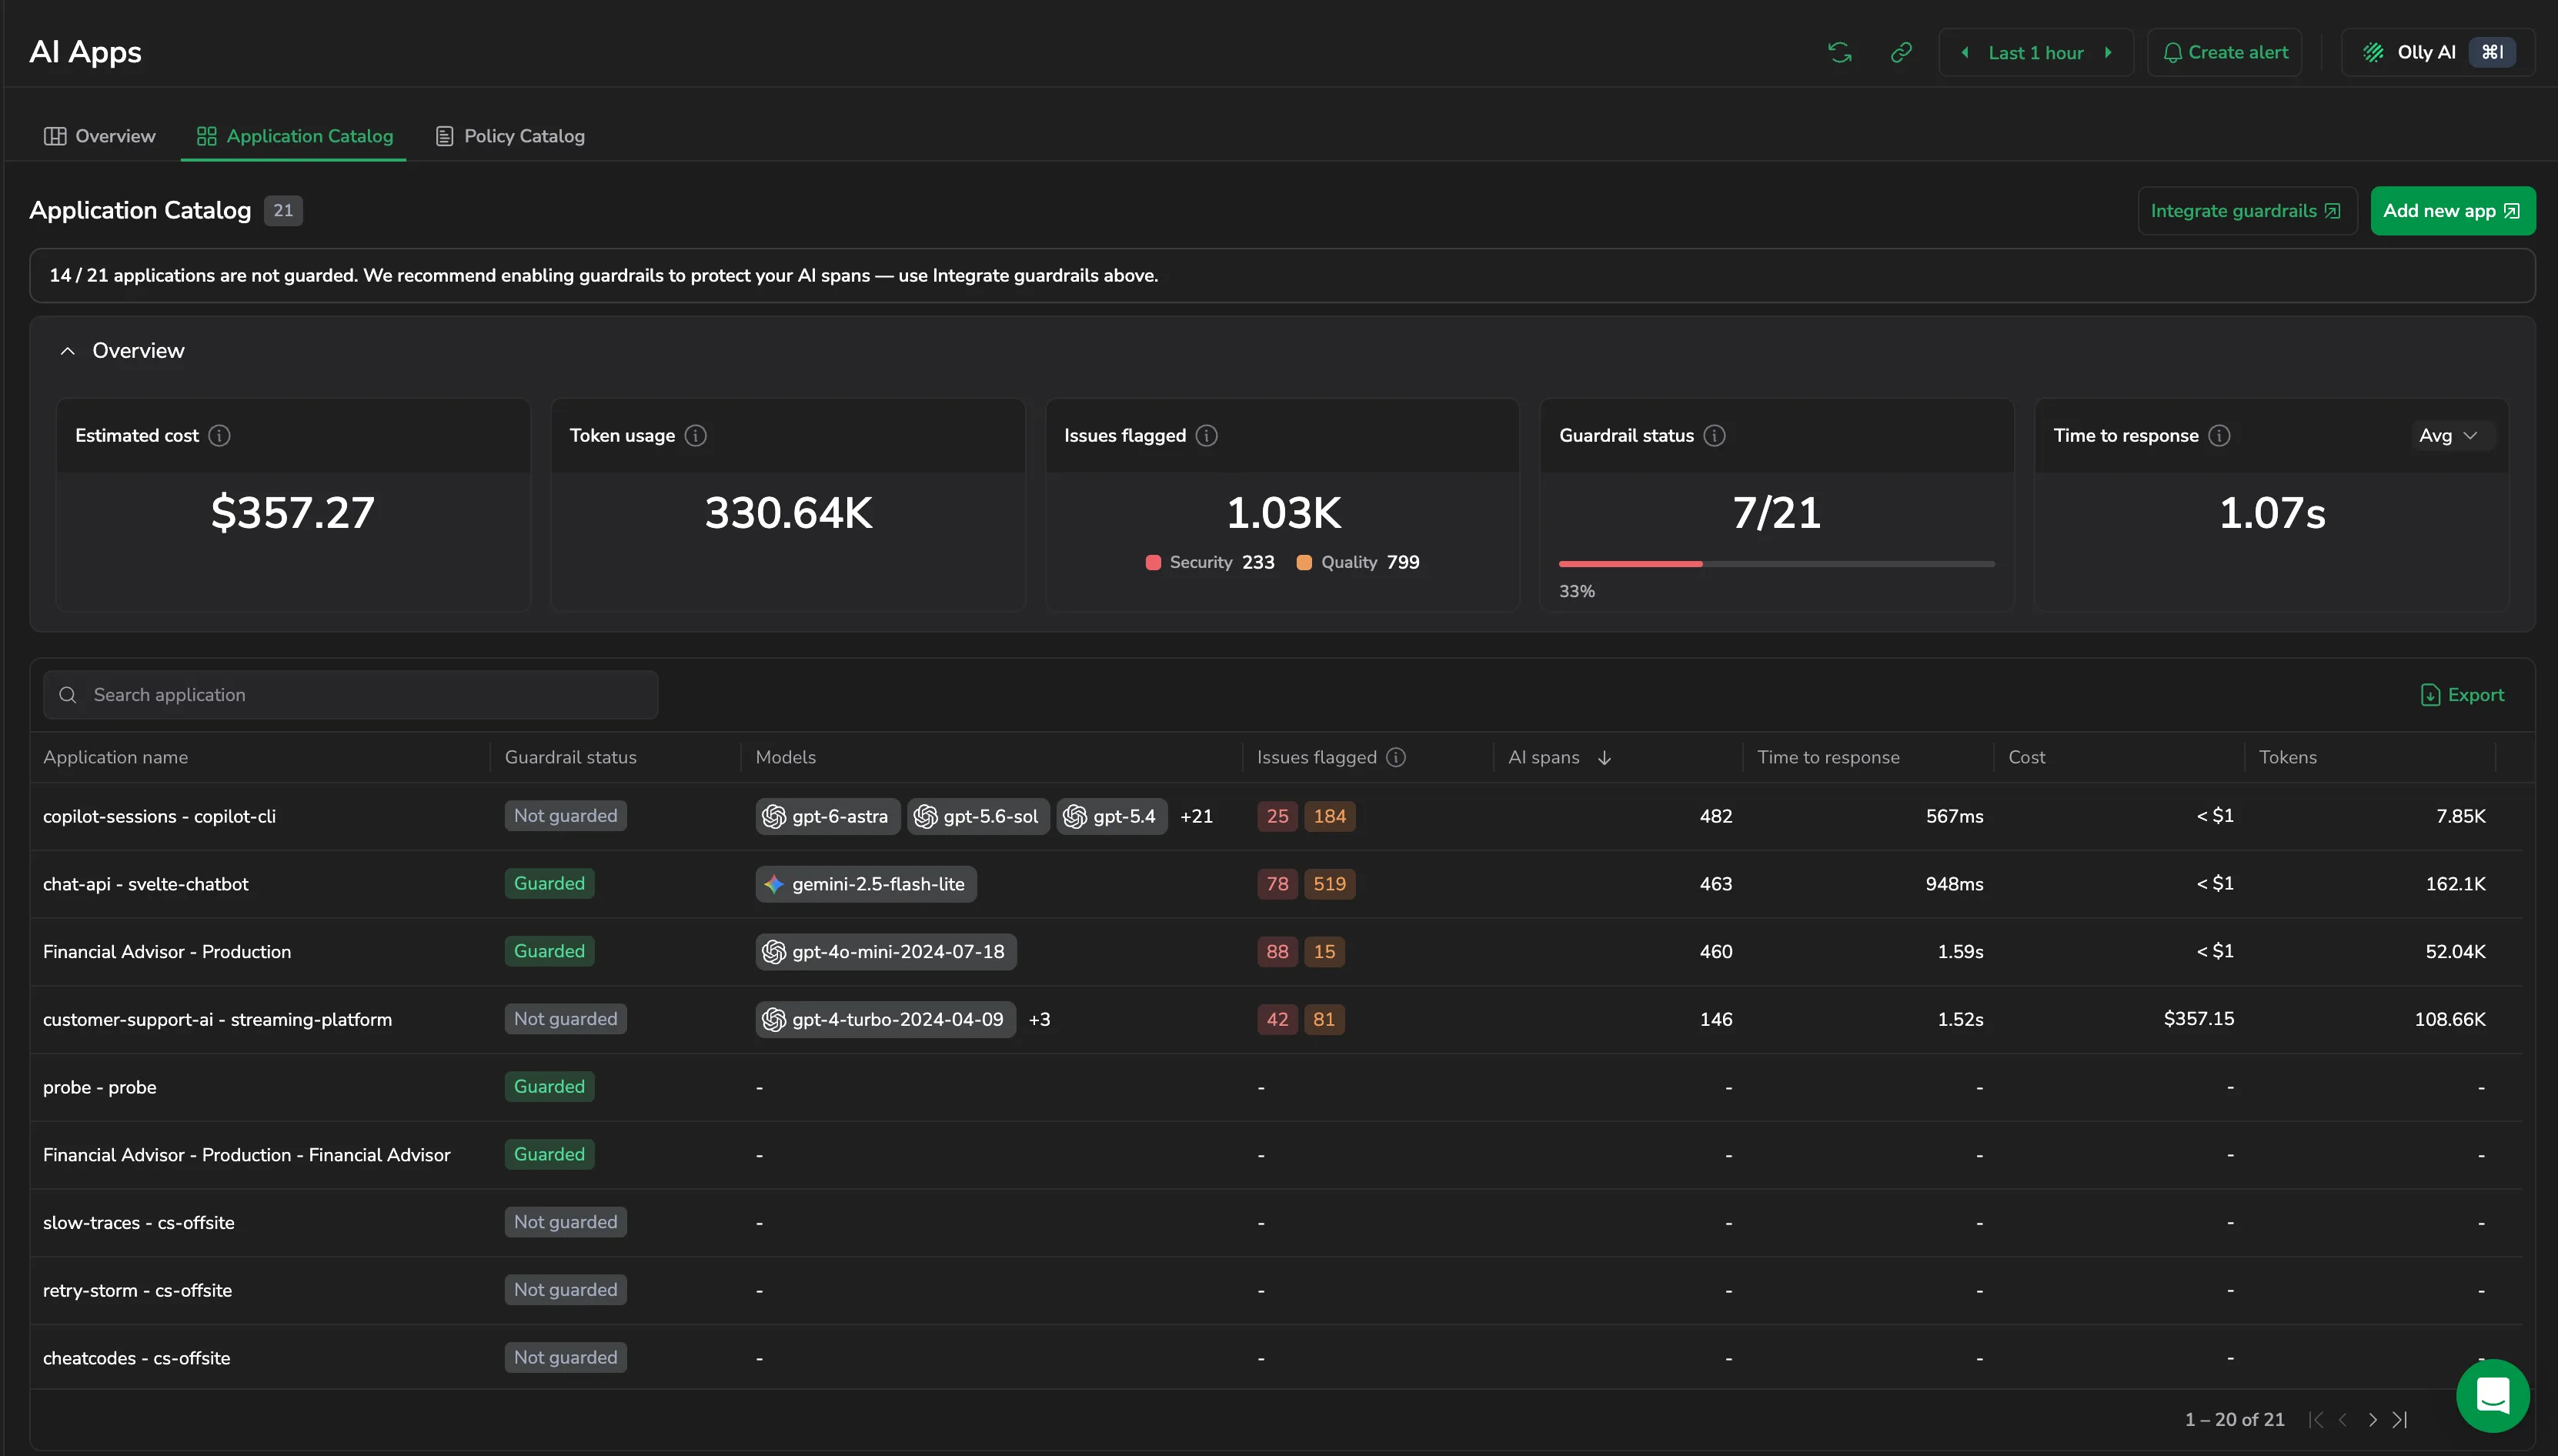
The Application Catalog gives you a side-by-side comparison of every AI application. Sort by any column to identify which application to investigate next. A banner at the top counts how many applications are unguarded and links to Integrate guardrails. Select Add new app to onboard another application.
Counters
- Estimated cost: total estimated spend across all applications.
- Token usage: total tokens consumed.
- Issues flagged: total flagged prompts and responses, split into Security and Quality.
- Guardrail status: how many applications are guarded, out of the total, with the share as a percentage.
- Time to response: response time for the statistic you pick, average by default.
Application grid
Each row is one application. Columns:
- Application name
- Guardrail status: Guarded or Not guarded.
- Models: the models the application used, with a count of any beyond the first few.
- Issues flagged: security issues and quality issues as two counts.
- AI spans: AI spans recorded for the application.
- Time to response
- Cost
- Tokens
Search by application name, select Export to download the table, or select any row to open the Application Drilldown for that application.
Application drilldown
The Application Drilldown is where the investigation happens. Once you've identified an application in the Catalog, this view gives you the full picture: which spans are erroring, which models are slow, which users are spending the most, and what issues are being triggered.
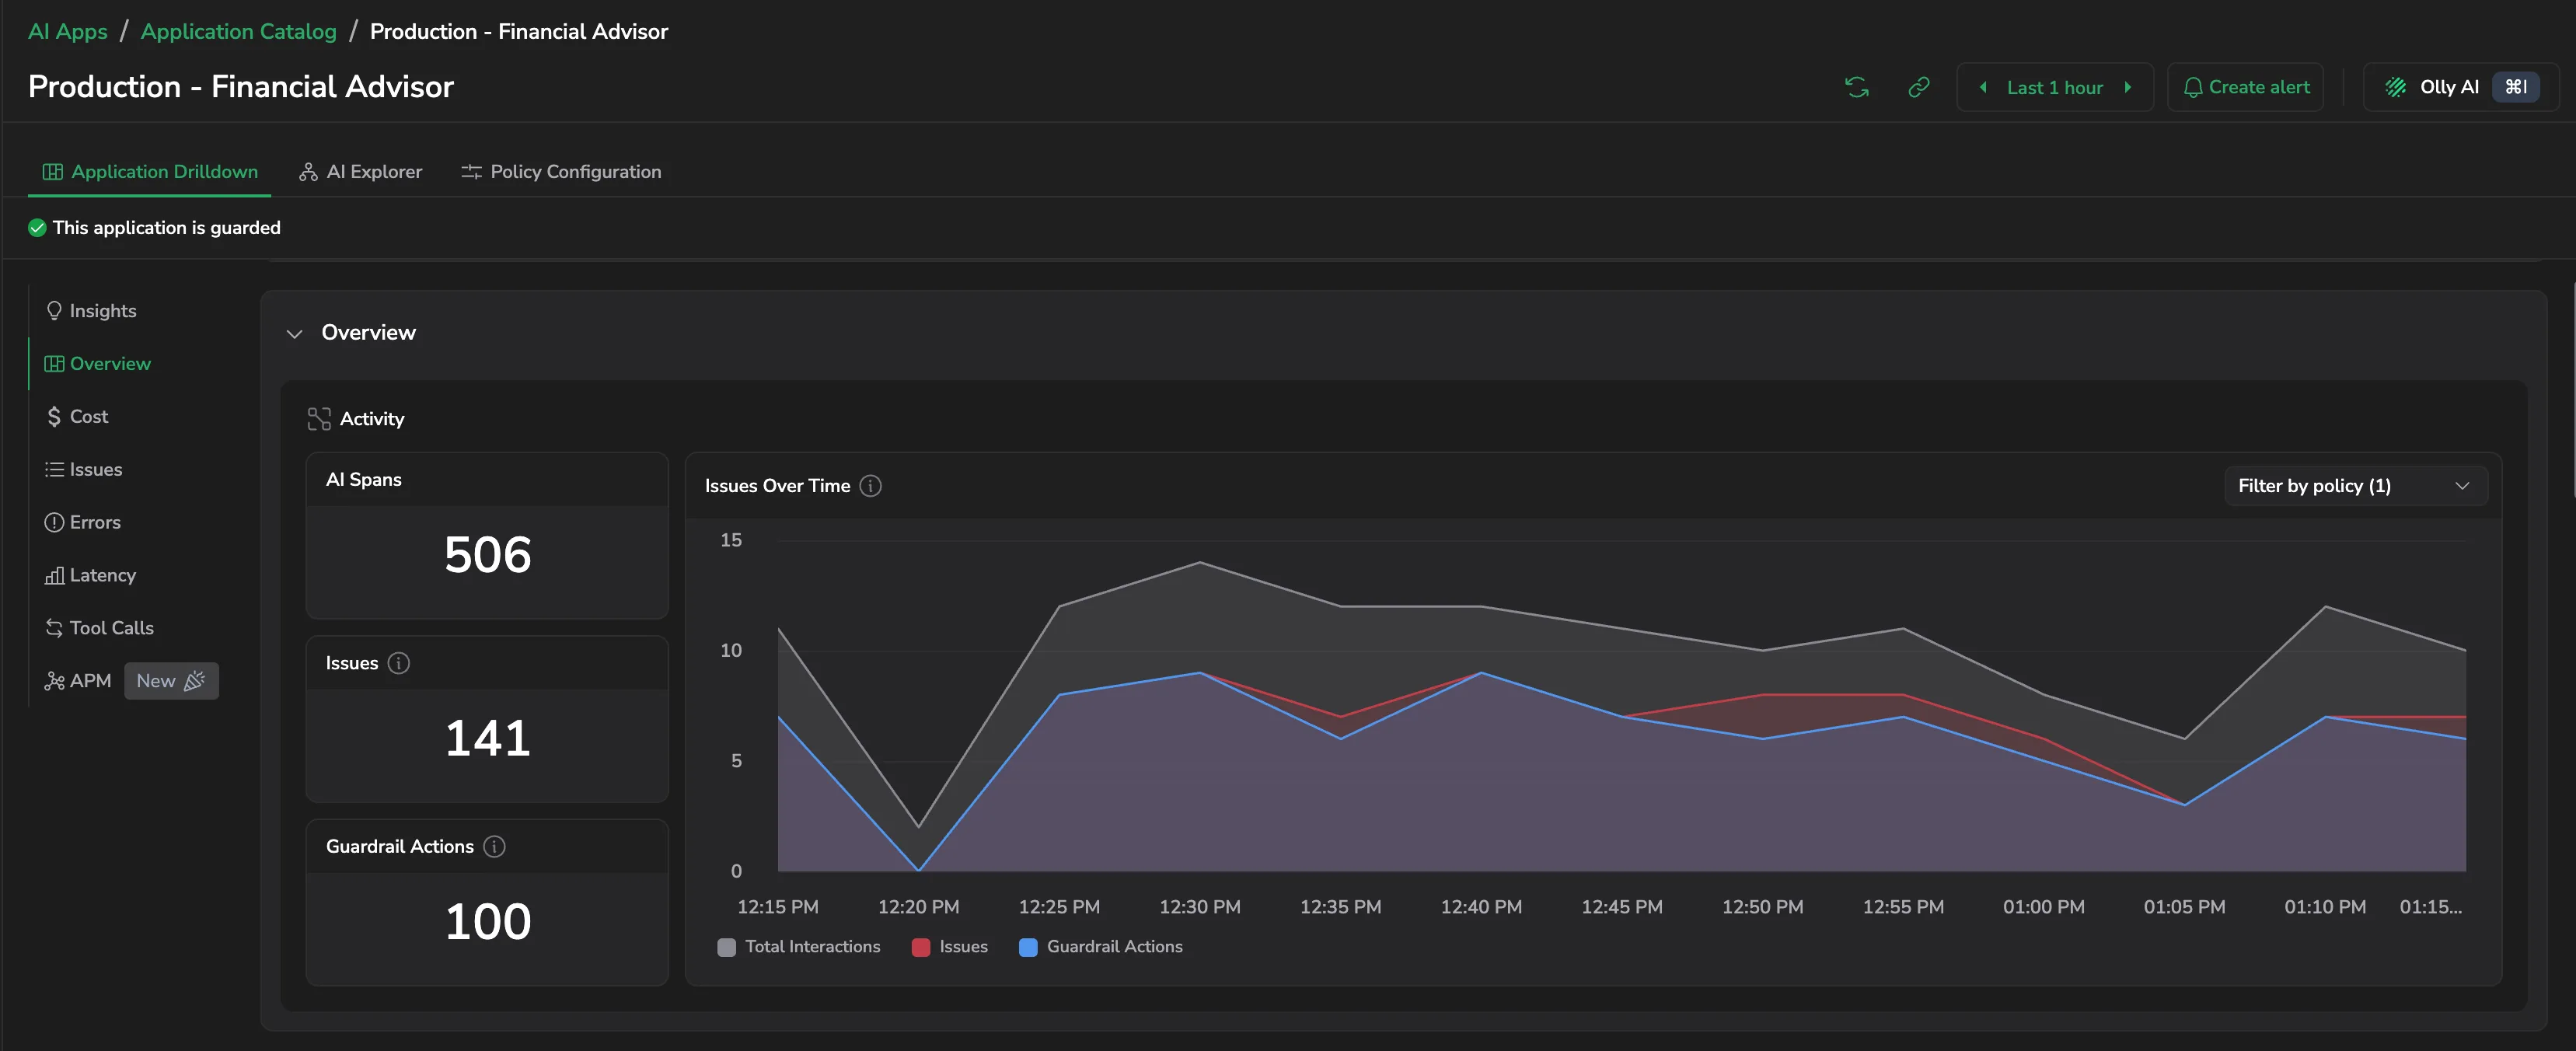
The application opens on three tabs: Application Drilldown, AI Explorer, and Policy Configuration. A banner under them states whether the application is guarded. Use the sidebar to move between Insights, Overview, Cost, Issues, Errors, Latency, Tool Calls, and APM.
Insights
The same ranked observations as the organization Overview, scoped to this application.
Overview
- AI Spans: AI spans recorded for this application.
- Issues: evaluation issues and guardrail issues combined.
- Guardrail Actions: spans where a guardrail policy triggered.
- Issues Over Time: three series, Total Interactions, Issues, and Guardrail Actions, on a single timeline. Use Filter by policy to narrow it.
Cost
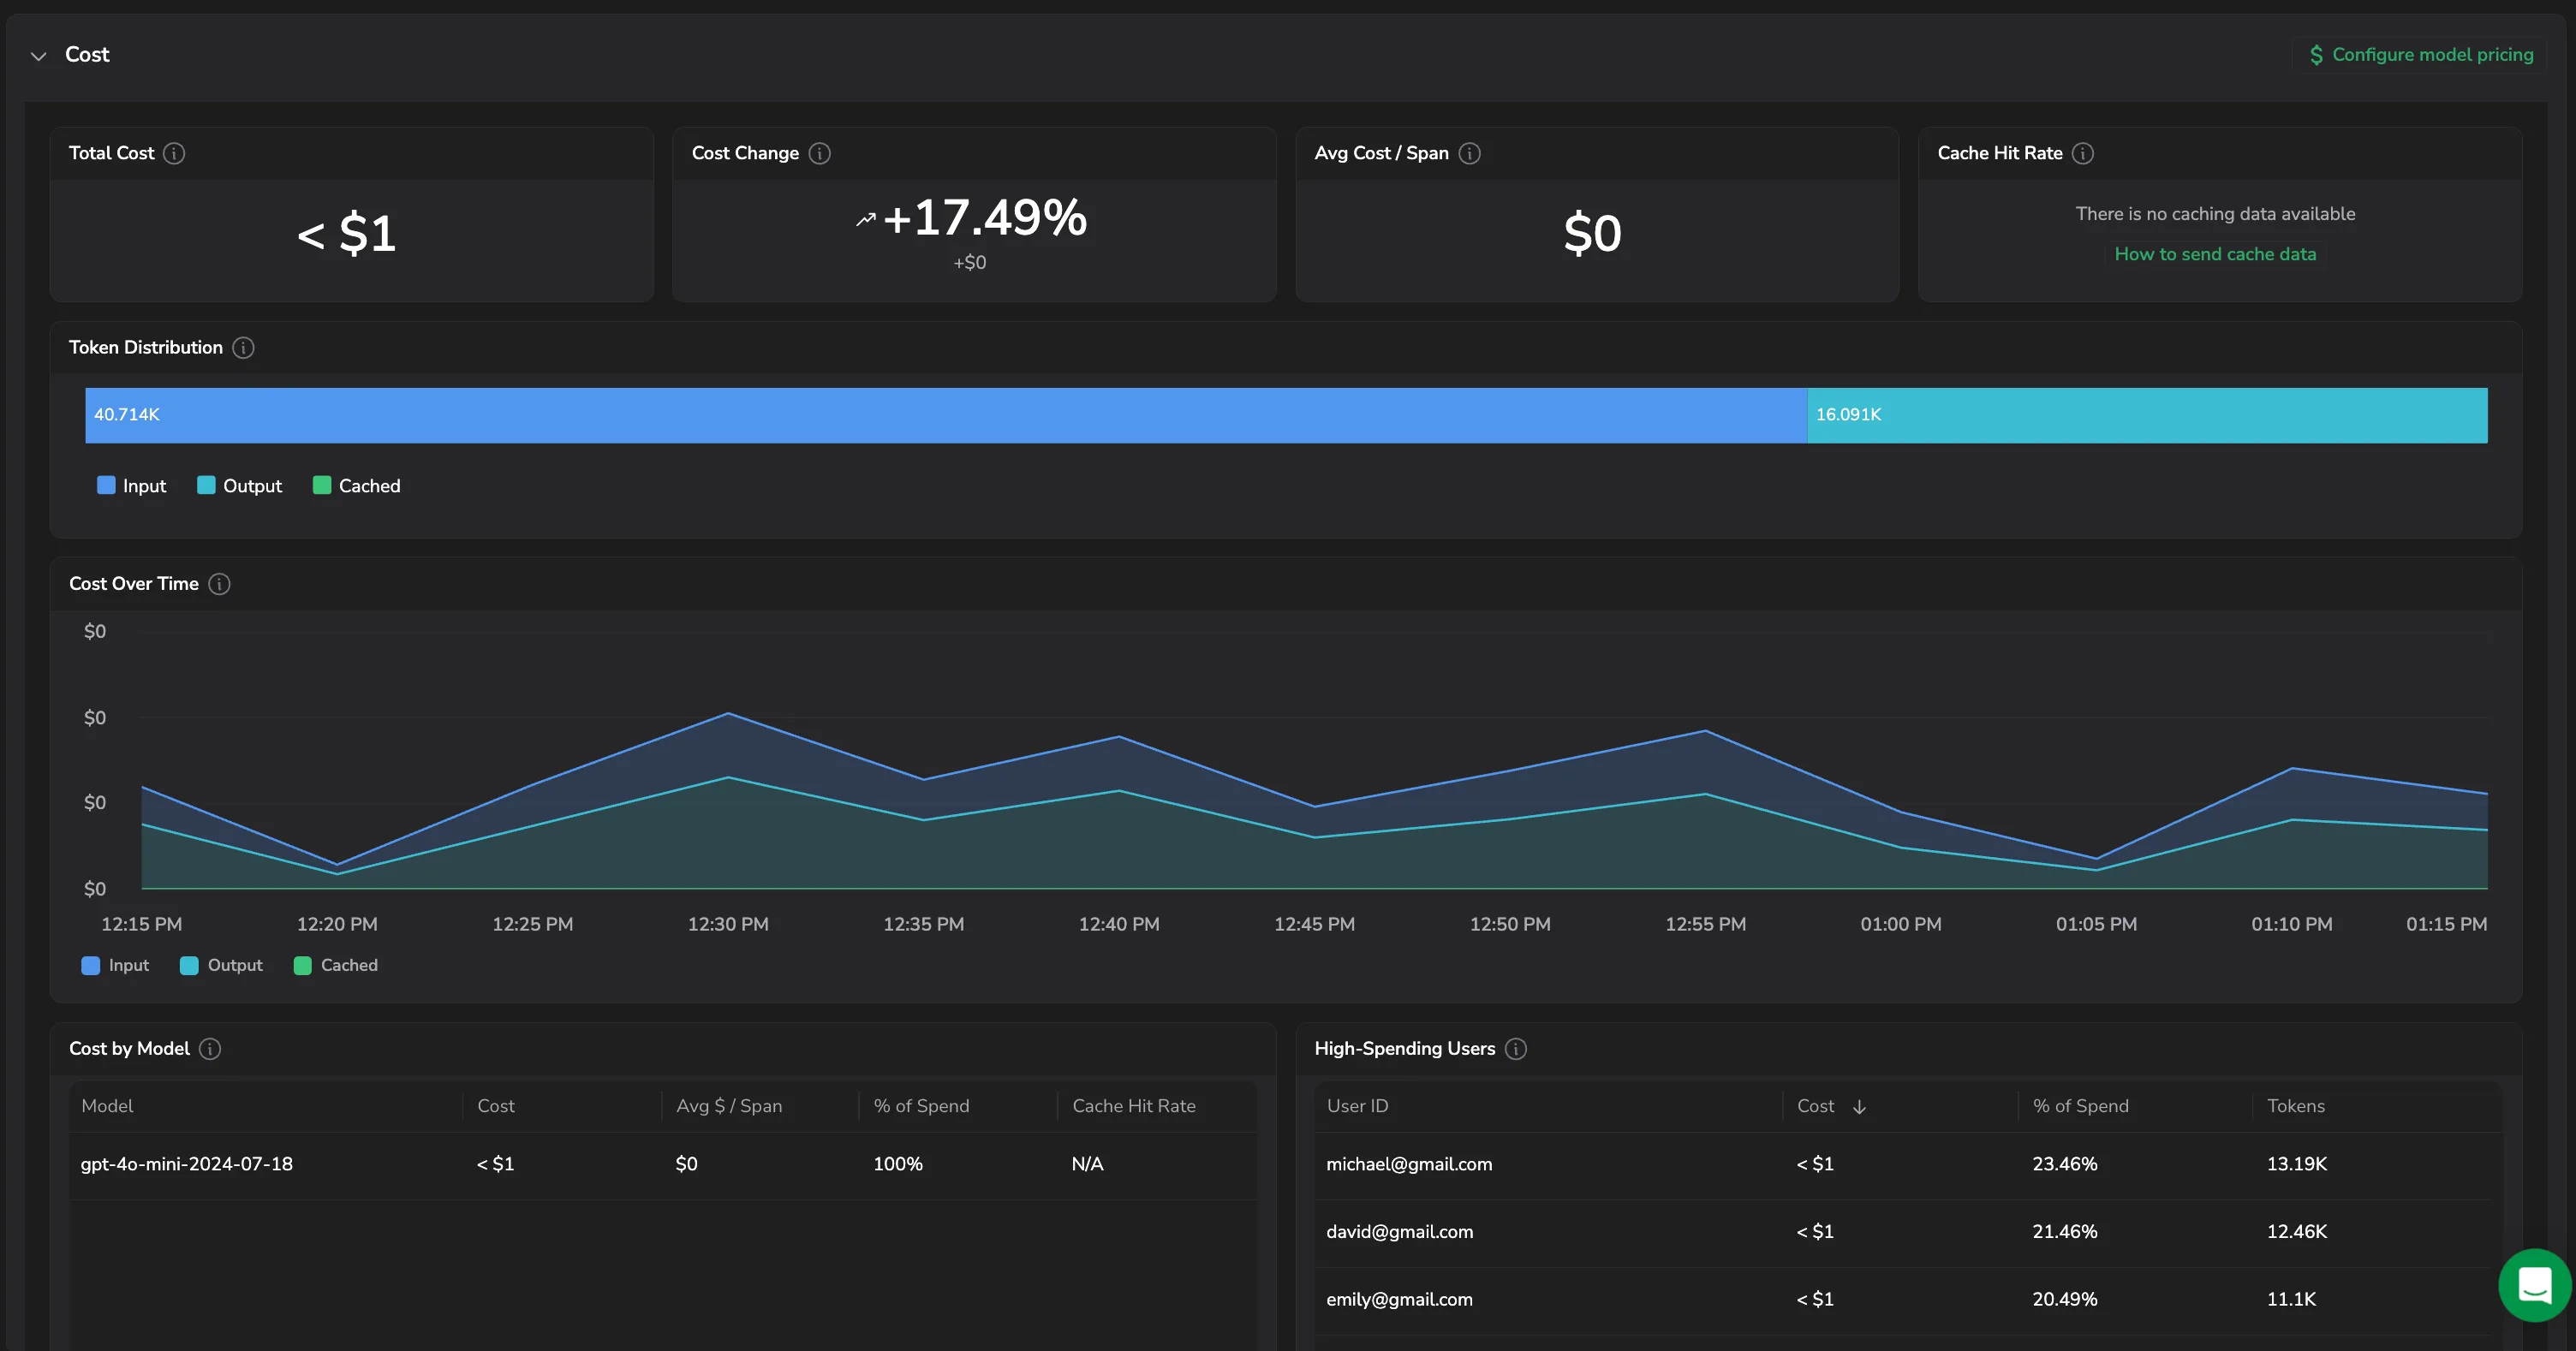
The same widget set as the organization Cost view, scoped to this application: Total Cost, Cost Change, Avg Cost / Span, Cache Hit Rate, Token Distribution, Cost Over Time, Cost by Model, and High-Spending Users.
If the application reports no cache usage, Cache Hit Rate says so and links to How to send cache data. See Optimize AI costs.
Issues
Visualize the security and quality issues affecting this application. AI-specific problems (hallucinations, prompt injections, policy violations, toxic outputs) don't appear as errors in traditional observability. This section makes them visible and actionable.
- Issue Rate: trend in issue rate over time.
- Issue Distribution: security against quality.
- Top Issues: the evaluations or guardrail policies triggering most often.
Where guardrails are active, this section also shows how many issues were caught and handled in real time before reaching users. Select any widget to inspect the specific AI spans in AI Explorer.
Errors
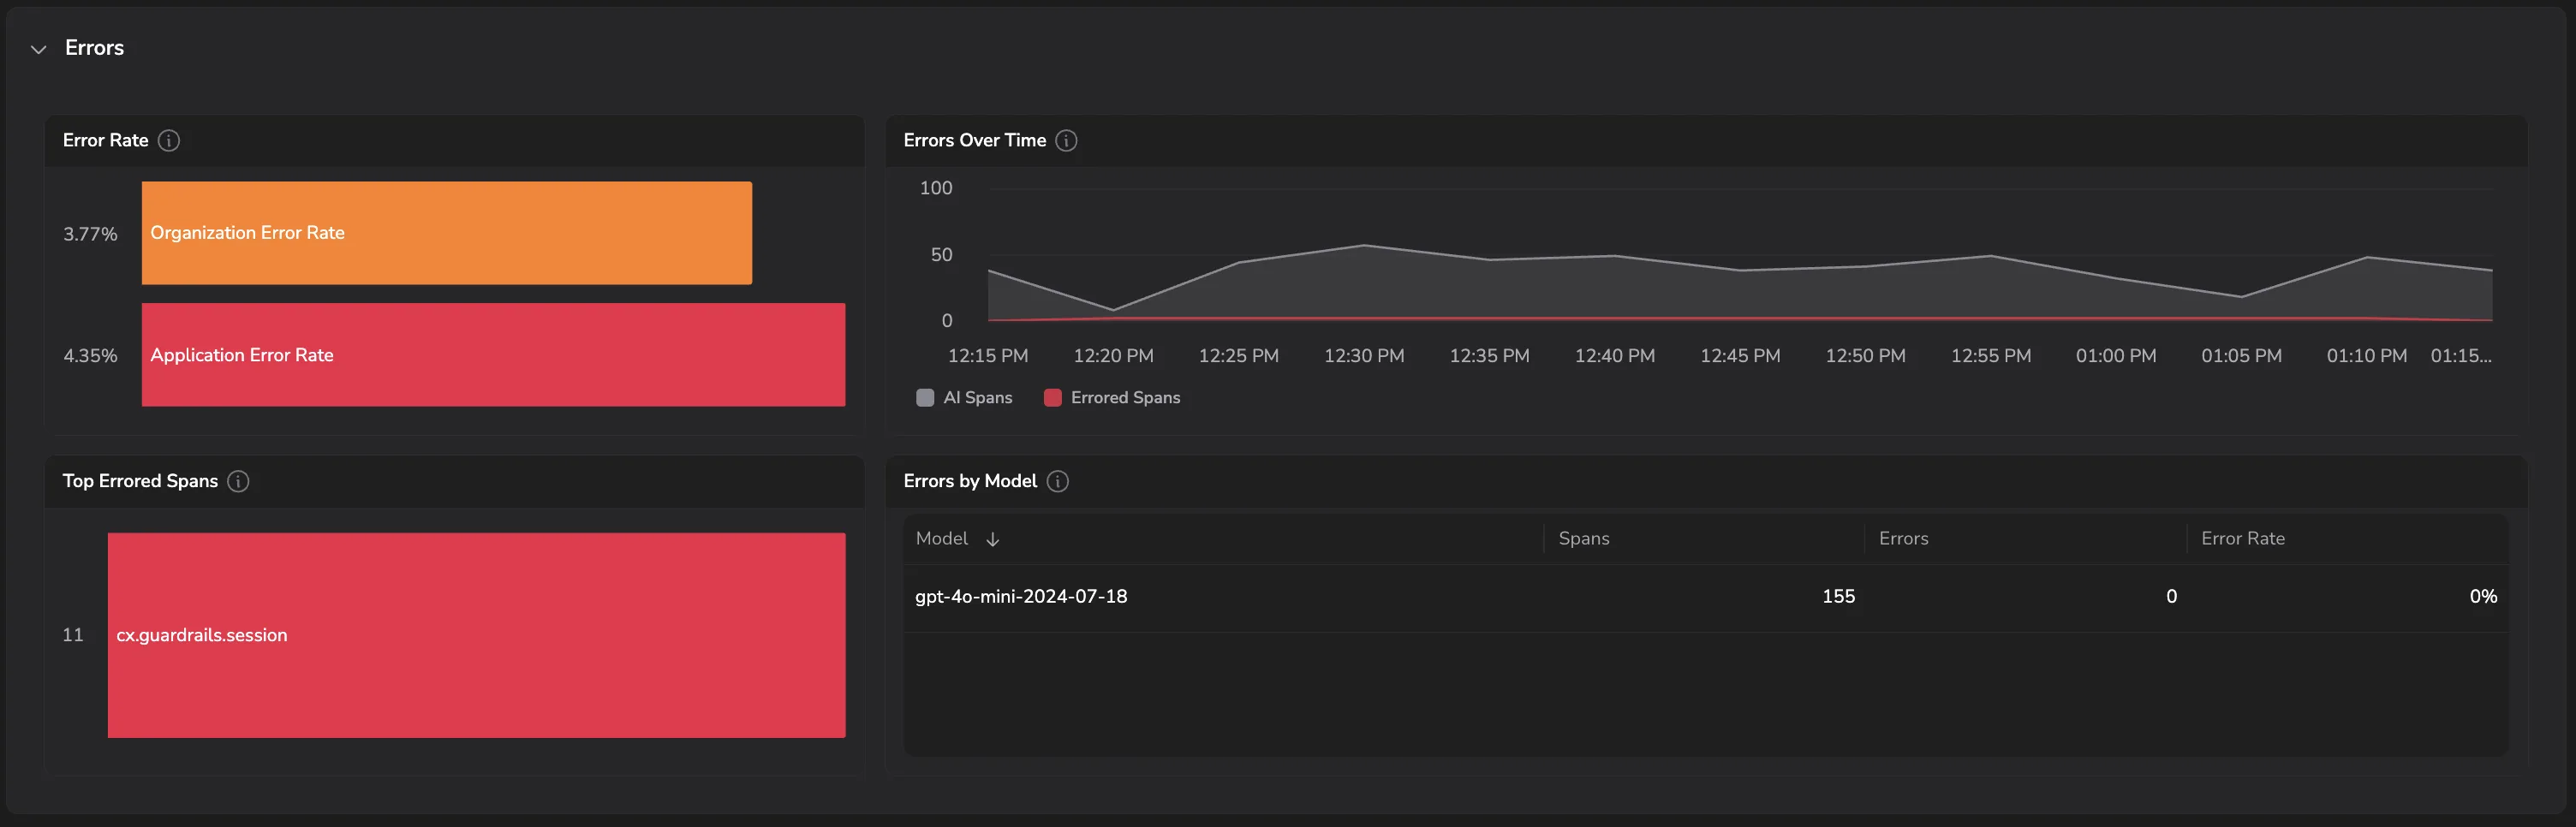
- Error Rate: this application's error rate against the organization's, side by side, so you can tell a local problem from a platform-wide one.
- Errors Over Time: AI spans against errored spans across the period.
- Top Errored Spans: the spans failing most often, by name.
- Errors by Model: Model, Spans, Errors, and Error Rate.
Latency
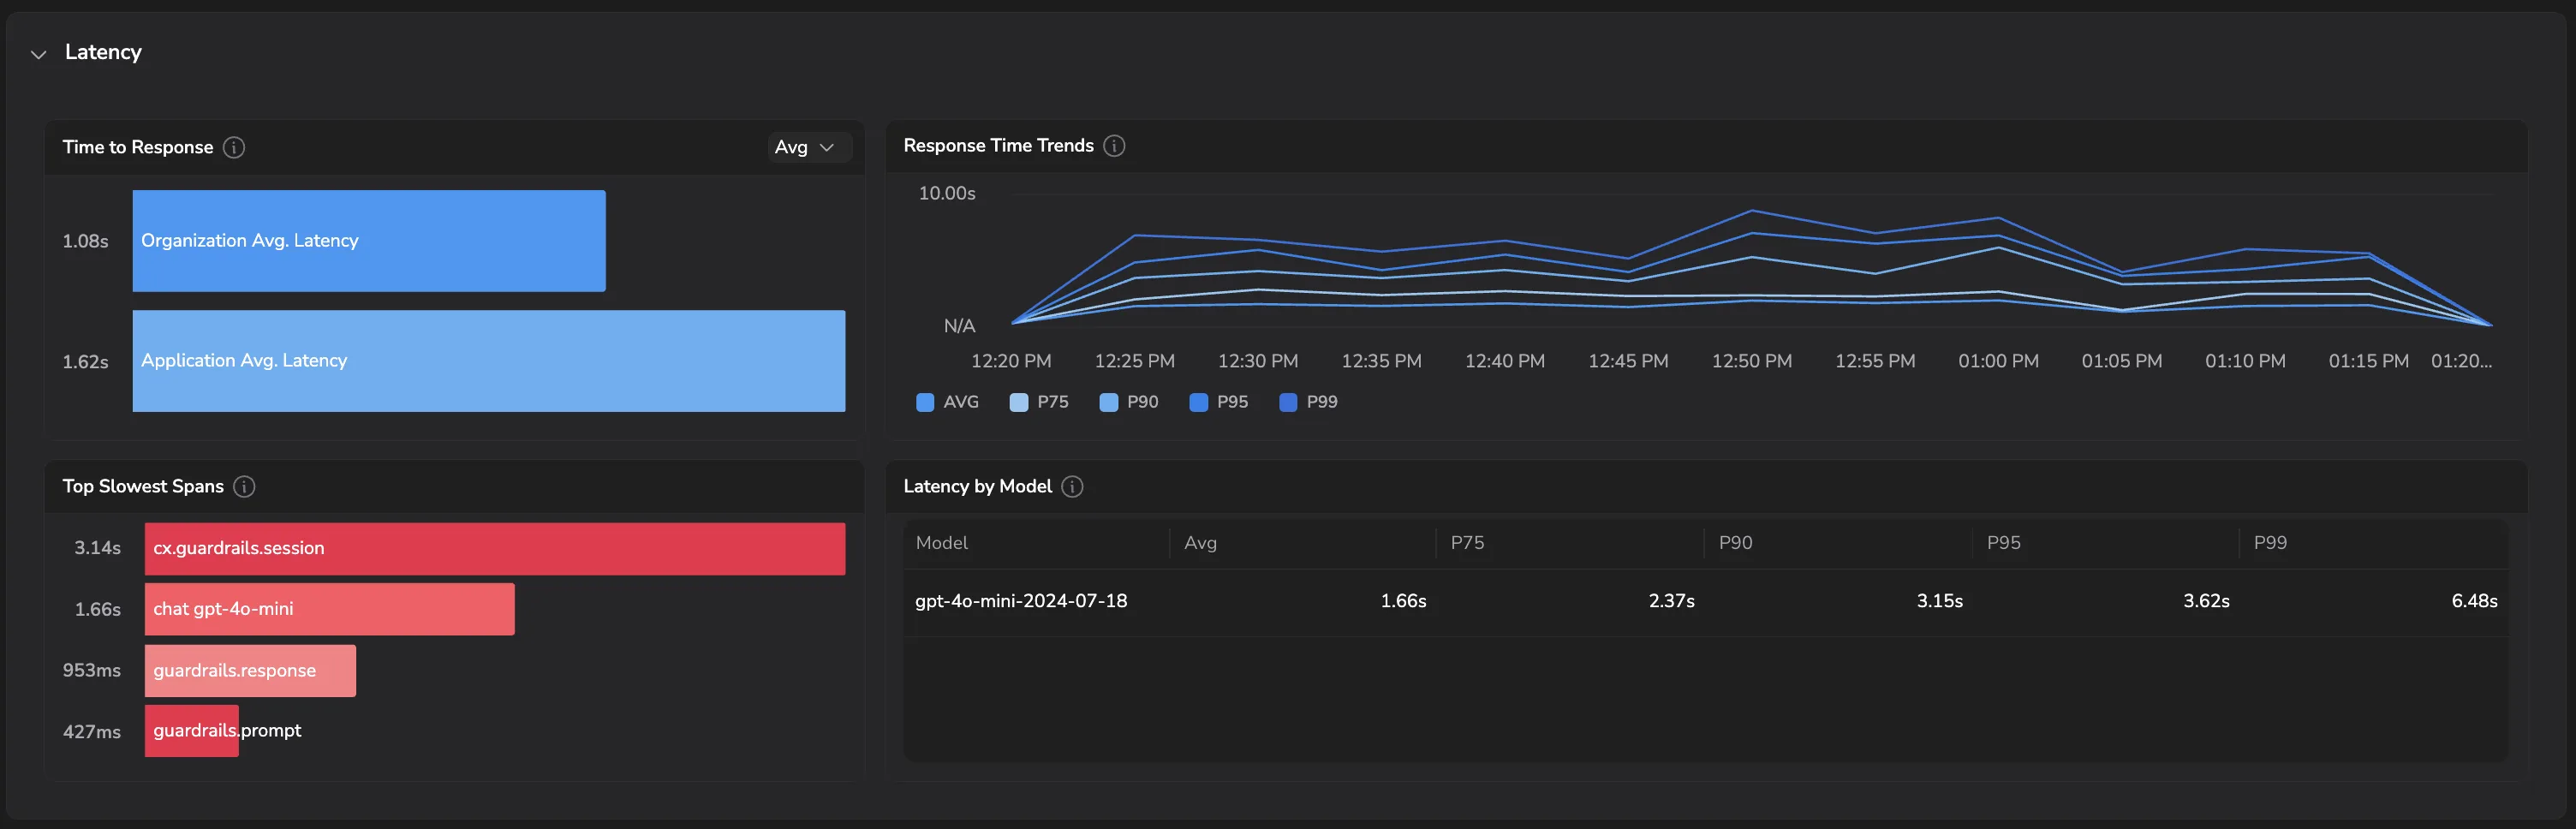
- Time to Response: this application's latency against the organization's, for the statistic you pick.
- Response Time Trends: AVG, P75, P90, P95, and P99 across the period.
- Top Slowest Spans: the slowest spans by name, so you can see whether the time goes to the model call or to guardrail processing.
- Latency by Model: per-model Avg, P75, P90, P95, and P99.
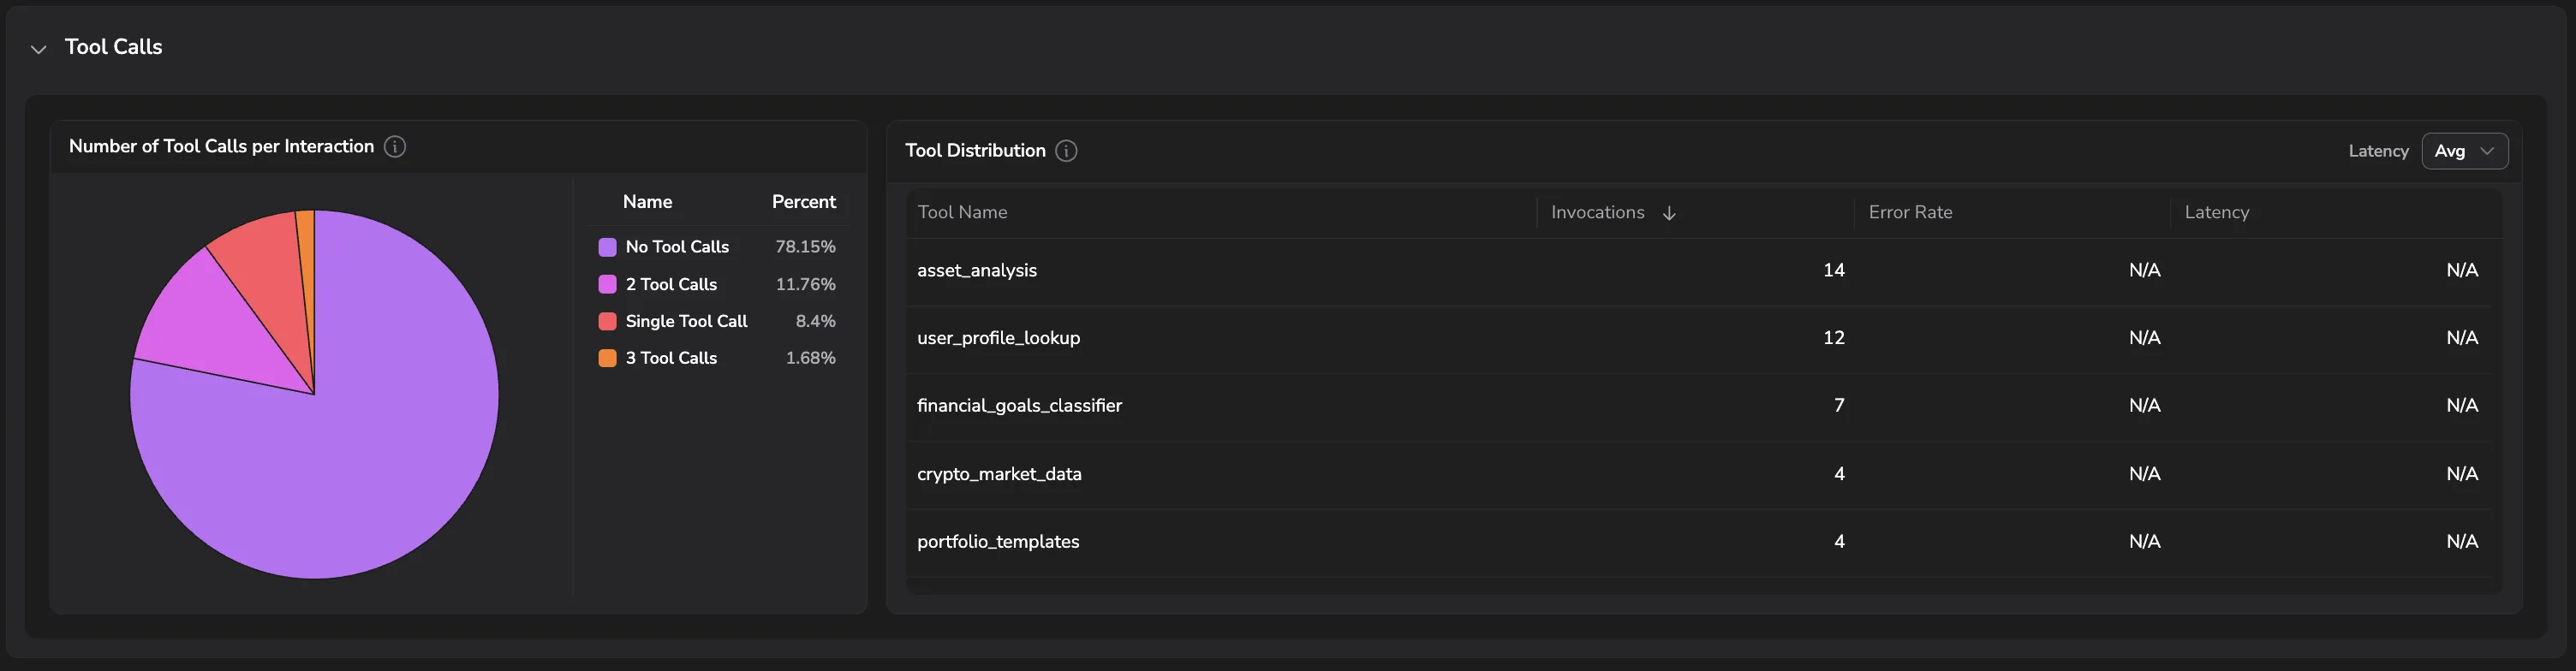
Tool Calls
Understand how this application uses external tools, services, and systems to generate responses.
- Number of Tool Calls per Interaction: how many interactions used no tools, one tool, or several, as a share of the total.
- Tool Distribution: Tool Name, Invocations, Error Rate, and Latency, with a selector for which latency statistic to show. Select a row to open the matching spans in AI Explorer.
Coralogix counts a tool call from two sources and takes the higher of the two: the execute_tool spans your application emits, and the tool calls recorded in the gen_ai.output.messages attribute of the LLM response. Each tool call in a response is counted separately, so a turn that calls three tools in parallel counts as three. Tools that only ever appear as execution spans still get their own row.
APM
Trace the GenAI services in your application down to the infrastructure they run on, without leaving AI Center.
Service Dependency Map gives each of the application's services its own expandable card, headed by the service name and its type icon. Only services that emit GenAI spans get a card, so the count stays scoped to your AI workload rather than the whole trace fan-out. Cards are ordered by call volume, and the first one is expanded when you open the section. Select Analyze the service on any card to open that service's full APM drilldown in a new tab.
Each card builds its map from the application's traces in the selected time range, up to a cap of 1,000 traces, and roots it at that card's service, so you see what that service calls and how those calls behave. The header states how many traces the map is built from, and Latency sets the aggregation applied to the figures: avg, min, max, or sum.
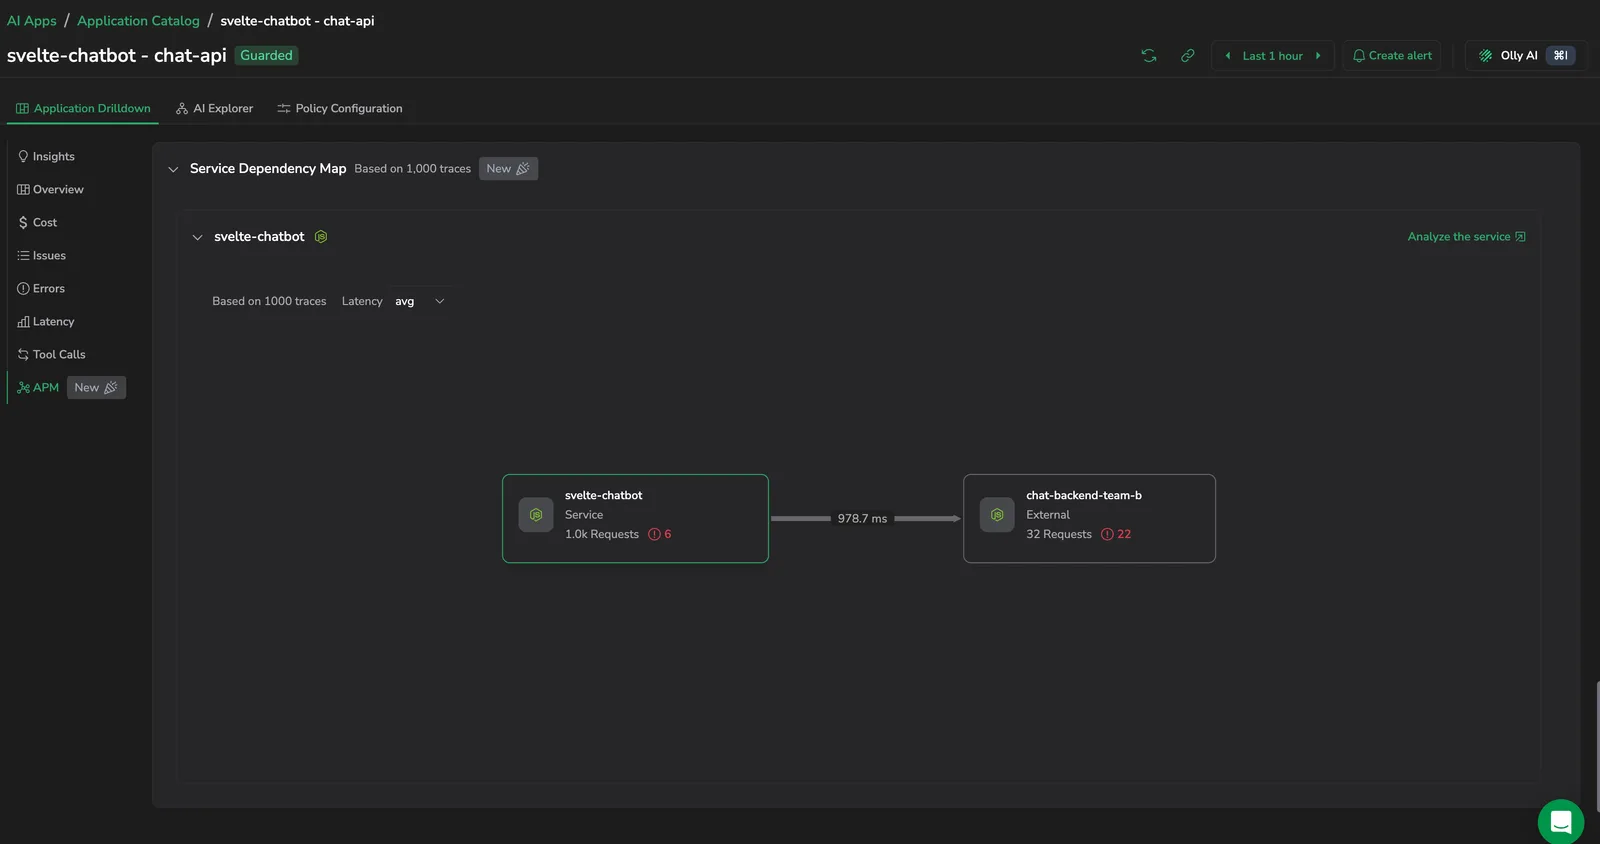
Every node names the service, its type (Service for a service in your account, External for one outside it), its request count, and its error count. Select a node to expand it into REQ/S, ERRORS, and MAX, followed by one row per connected service showing the same three figures for that specific call path, with an arrow for direction and the protocol in parentheses.
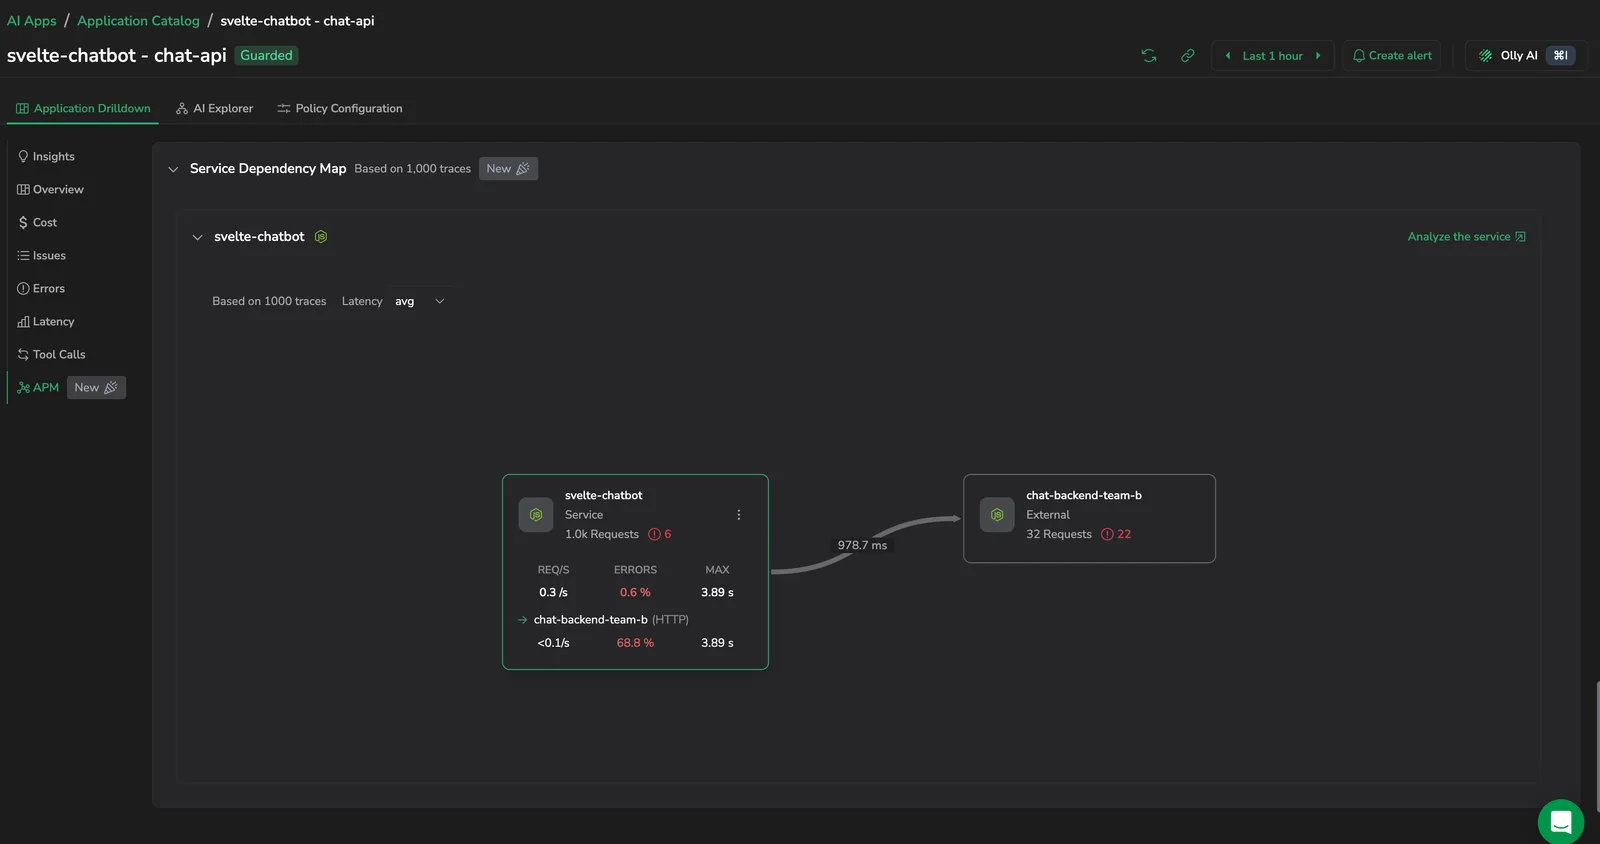
Each node also carries a menu offering View service overview, View errors, and View related logs, which open the corresponding APM views for that service.

The section shows one of three states when it has no map to draw:
- No Data. Check your configuration settings and try again.
- No services found. The application has AI activity, but none of those services are instrumented with APM. Select Onboard services to APM to set them up.
- Could not load the dependency map. The map failed to build. Try again or narrow the time range.
AI Explorer
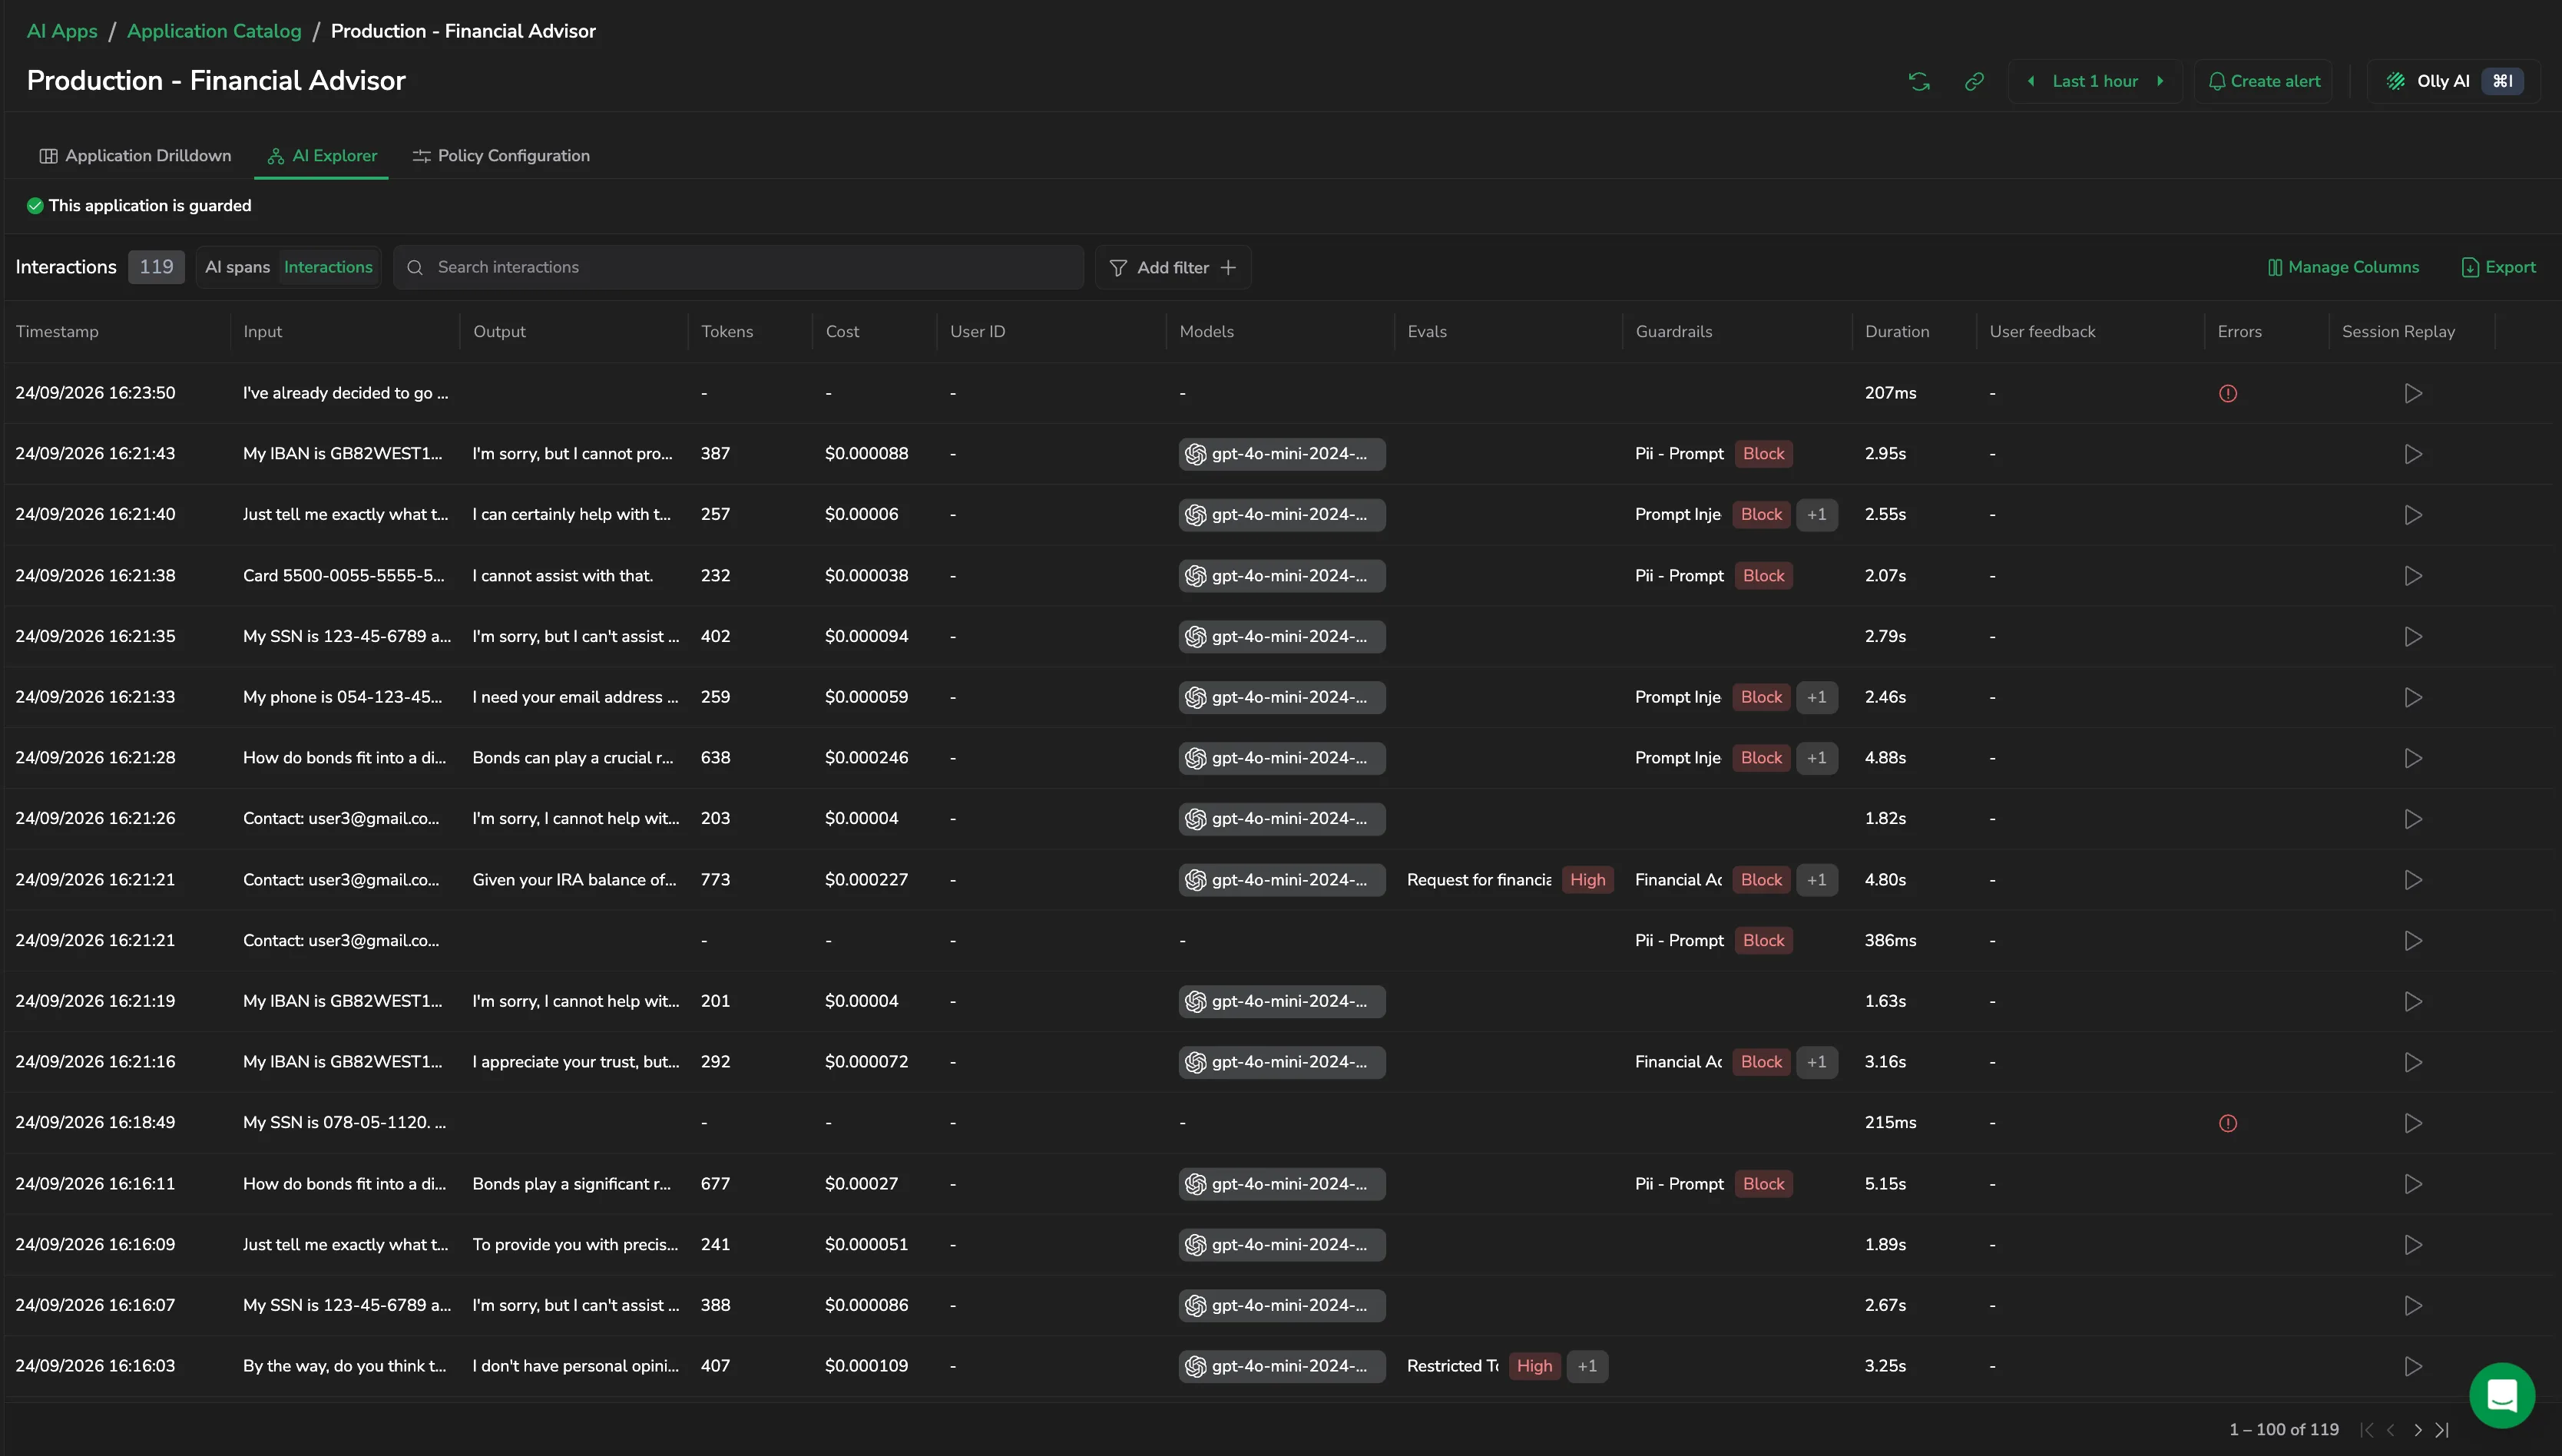
The AI Explorer tab lists this application's traffic. Switch between AI spans and Interactions, search, and select Add filter to narrow the table. Manage Columns controls which columns appear, and Export downloads the table.
Columns include Timestamp, Input, Output, Tokens, Cost, User ID, Models, Evals, Guardrails, Duration, User feedback, Errors, and Session Replay. Evals and Guardrails render as badges naming the policy and the action it took, such as Block, with a +N indicator when several fired.
For the full feature set, see AI Explorer.
Policy configuration
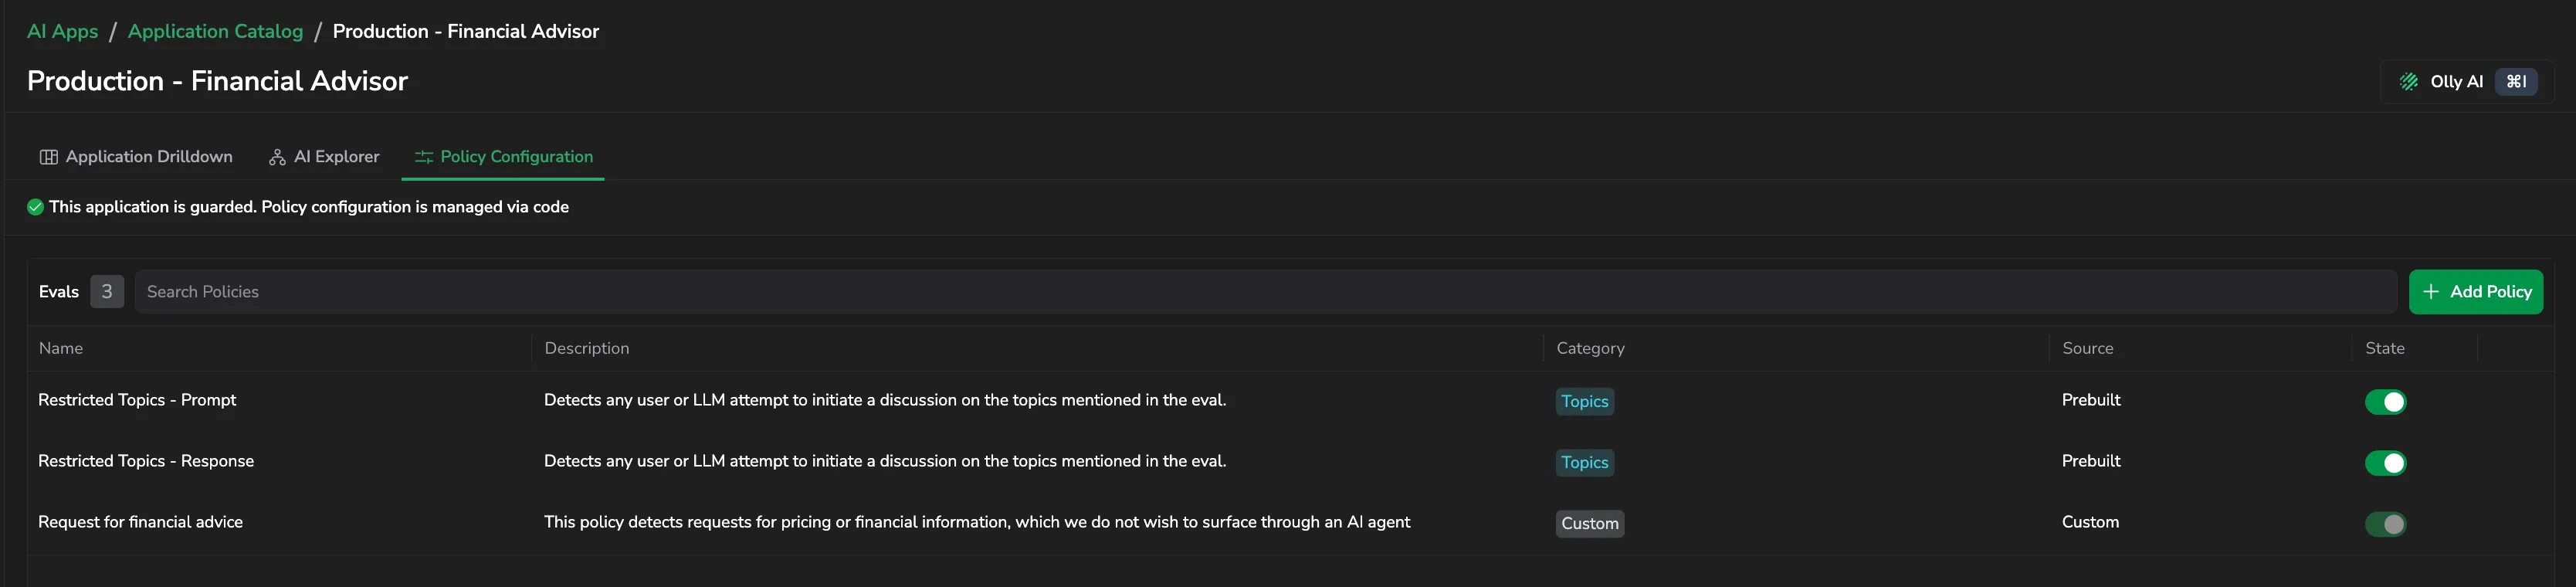
The Policy Configuration tab lists every policy active for this application. Use it to turn policies on or off, review which categories they cover, and add new ones, all scoped to the selected application.
Each row shows the policy Name, Description, Category, Source (Prebuilt or Custom), and State, which you toggle. Search by name, or select Add Policy to apply another from the Policy Catalog.
For guarded applications, a This application is guarded. Policy configuration is managed via code banner appears at the top. Policies for guarded applications are configured through the Guardrails SDK rather than the UI.
Next steps
Inspect individual AI spans with AI explorer.