Claude
The Claude dashboard covers every Claude product in one place: Claude Code and Cowork sessions alongside claude.ai chats. It has three tabs, Activity, Cost, and Impact, and each one opens with an Insights section of ranked observations drawn from your usage in the selected range, such as token usage concentrated in one user or a handful of sessions dominating consumption. Each card ends in an action that takes you to the evidence, like View users or Analyze sessions, and View all insights opens the full set.
Before the dashboard shows data, set up at least one source. See Connect Claude.
Where the numbers come from
The dashboard draws on two independent sources. A Source chip on the Users grid tells you where a row's data came from, and a user reporting through both carries both chips.
| Source | Chip | What it gives you |
|---|---|---|
| Claude Enterprise API | Enterprise API | Actual post-discount cost, claude.ai chats, Skills and Connectors adoption, and per-group and per-product spend. Data is restated once every 24 hours. |
| OpenTelemetry | OTEL | Session-level detail, code impact, and repository attribution, within minutes of the work happening. List price only, so it excludes seat and plan-specific pricing. |
Connect both for the full picture. With OpenTelemetry alone, the Cost tab is locked, and selecting it takes you to the Enterprise API integration instead. With neither, the dashboard shows the Code Agents Connect your first AI tool screen.
Where a single widget has no source behind it, it names the one it needs and offers Integrate now or Set up OTel connection. If you don't have permission to create an integration, the button is disabled and tells you to contact your team admin.
Because only the Enterprise API reports what you actually paid, Actual Cost reads N/A for a user whose data arrived through OpenTelemetry alone. List Cost is always populated.
Activity
Use the control in the section header to switch between Claude Code & Cowork and claude.ai. Both panes stay loaded, so switching is instant.
Under Claude Code & Cowork:
- Sessions and Sessions Over Time: session volume for the period. Live OpenTelemetry is used when it covers the period; otherwise Enterprise API figures, restated every 48 hours.
- Most Expensive Sessions: the costliest sessions, with Started, AI analysis, List Cost, Git Repositories, Repo Status, Model, and Session ID. Needs OpenTelemetry.
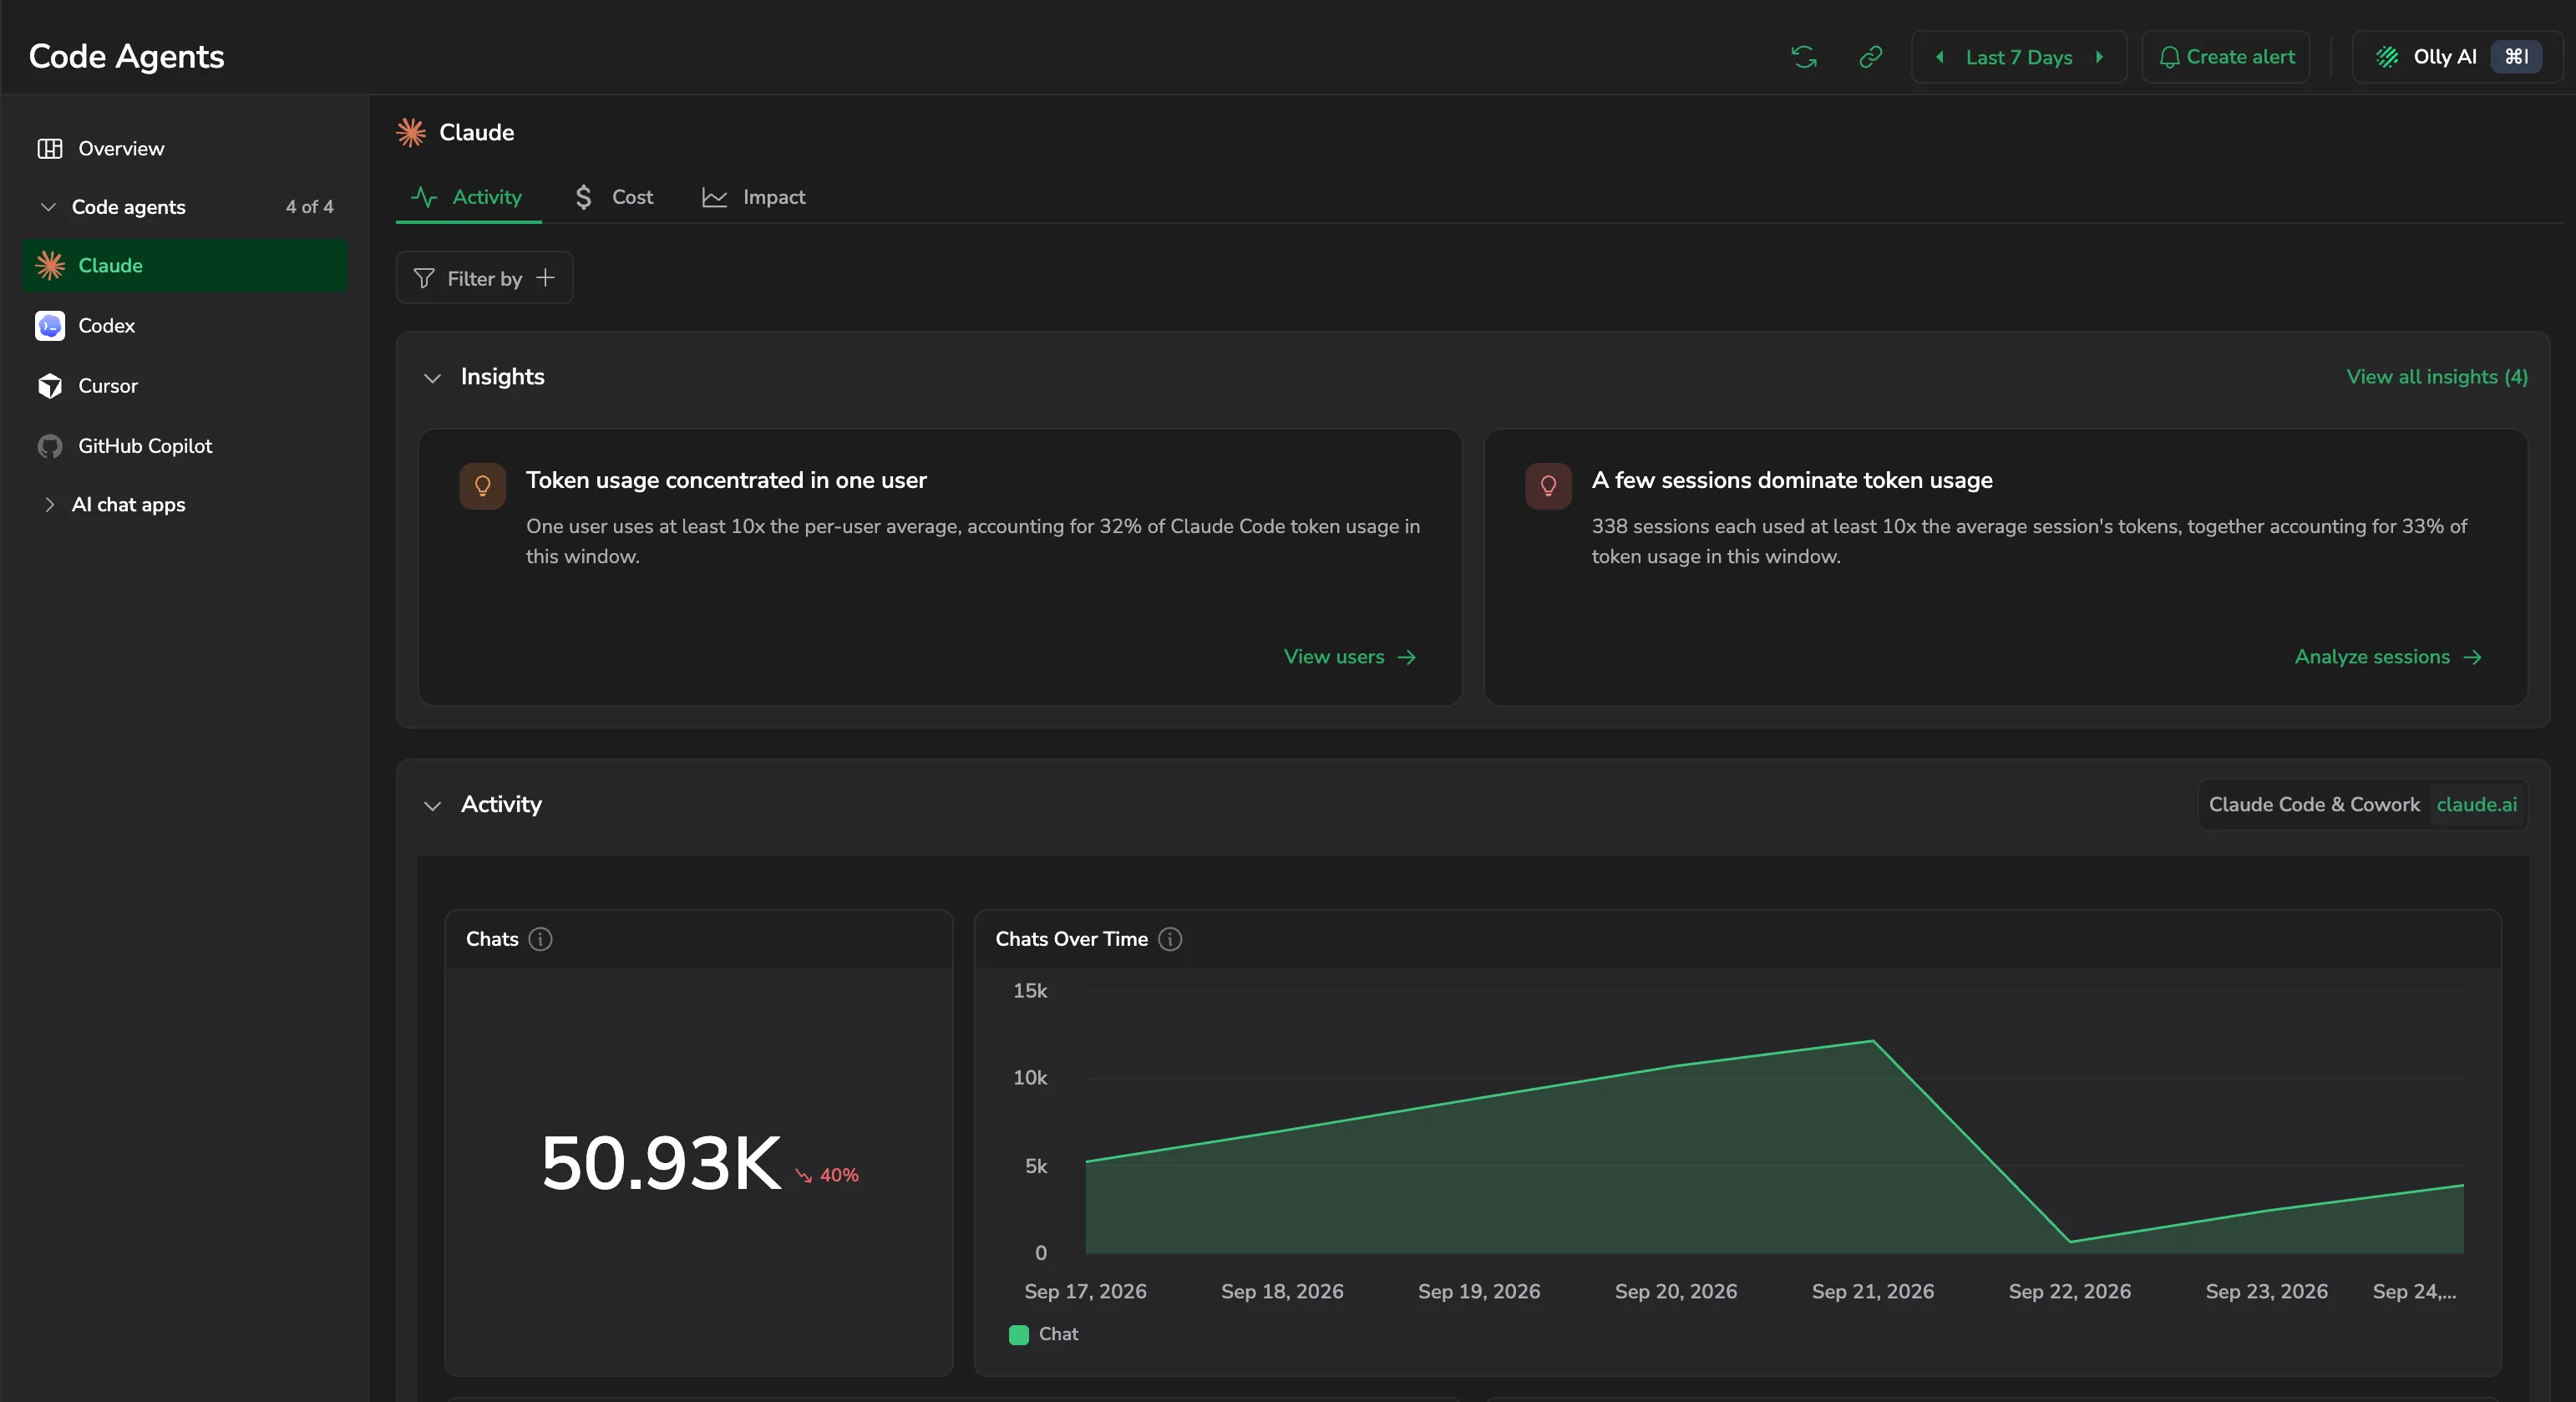
Under claude.ai:
- Chats and Chats Over Time: chat volume, from the Enterprise API.
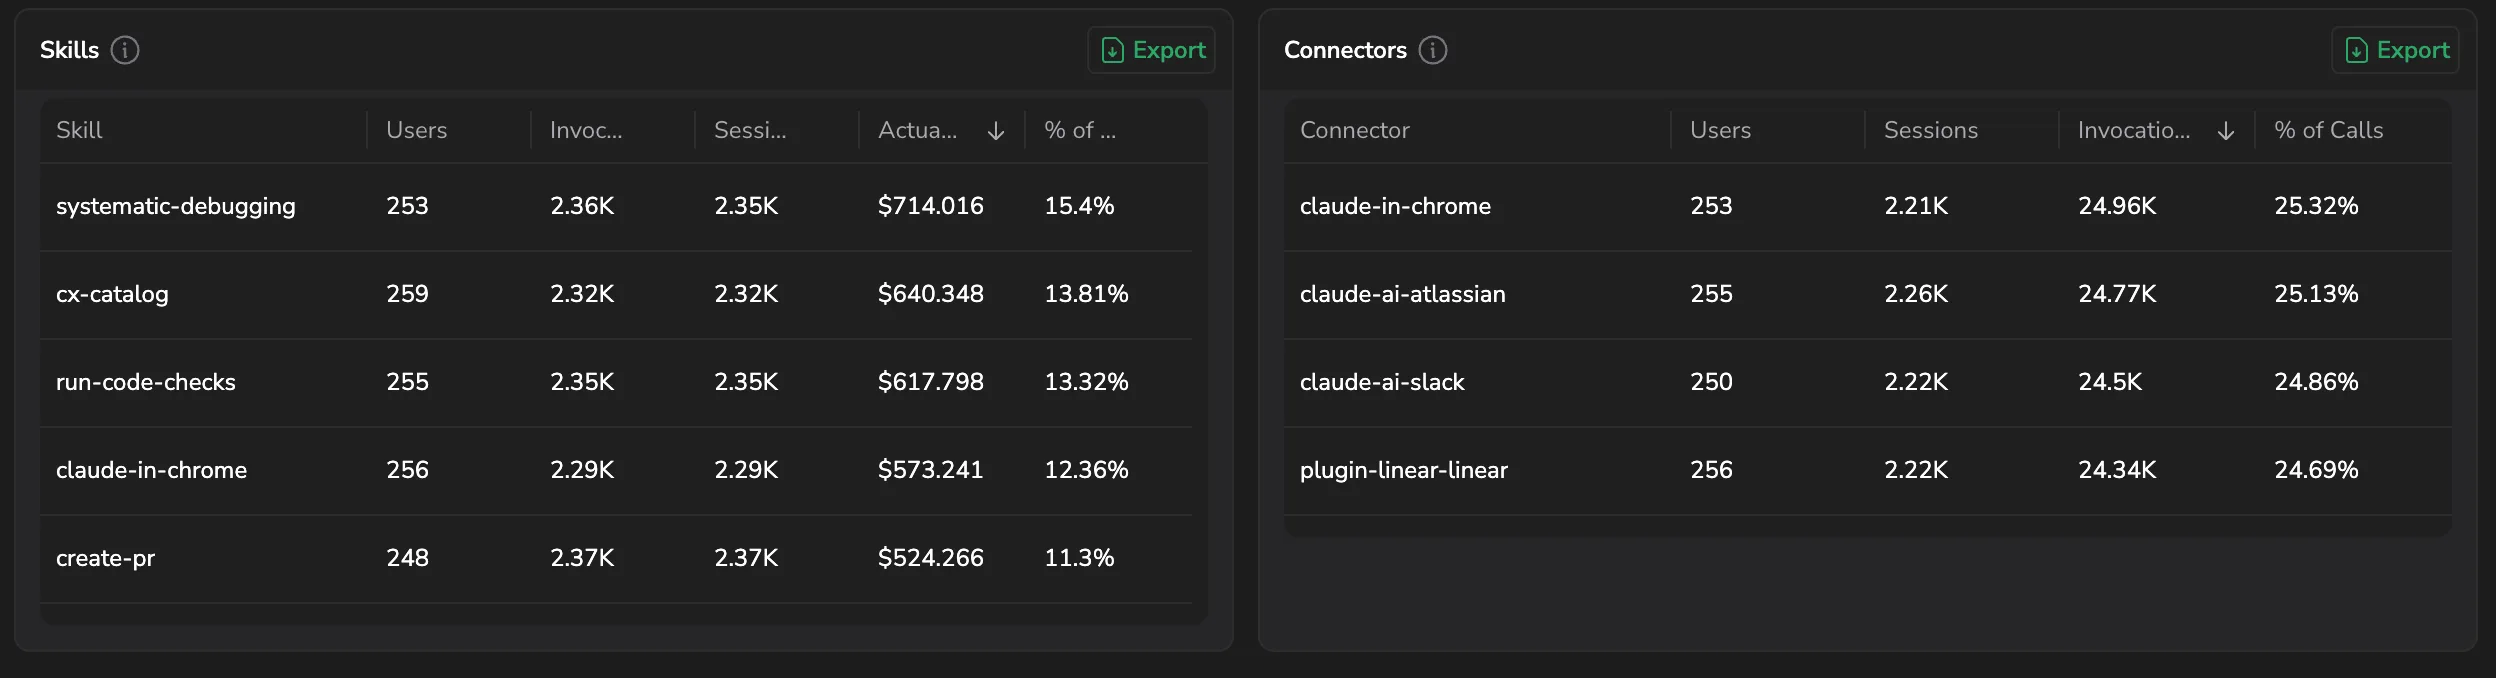
- Skills and Connectors: adoption of each, with distinct users, invocations, sessions, and attributed cost. Each table exports on its own.
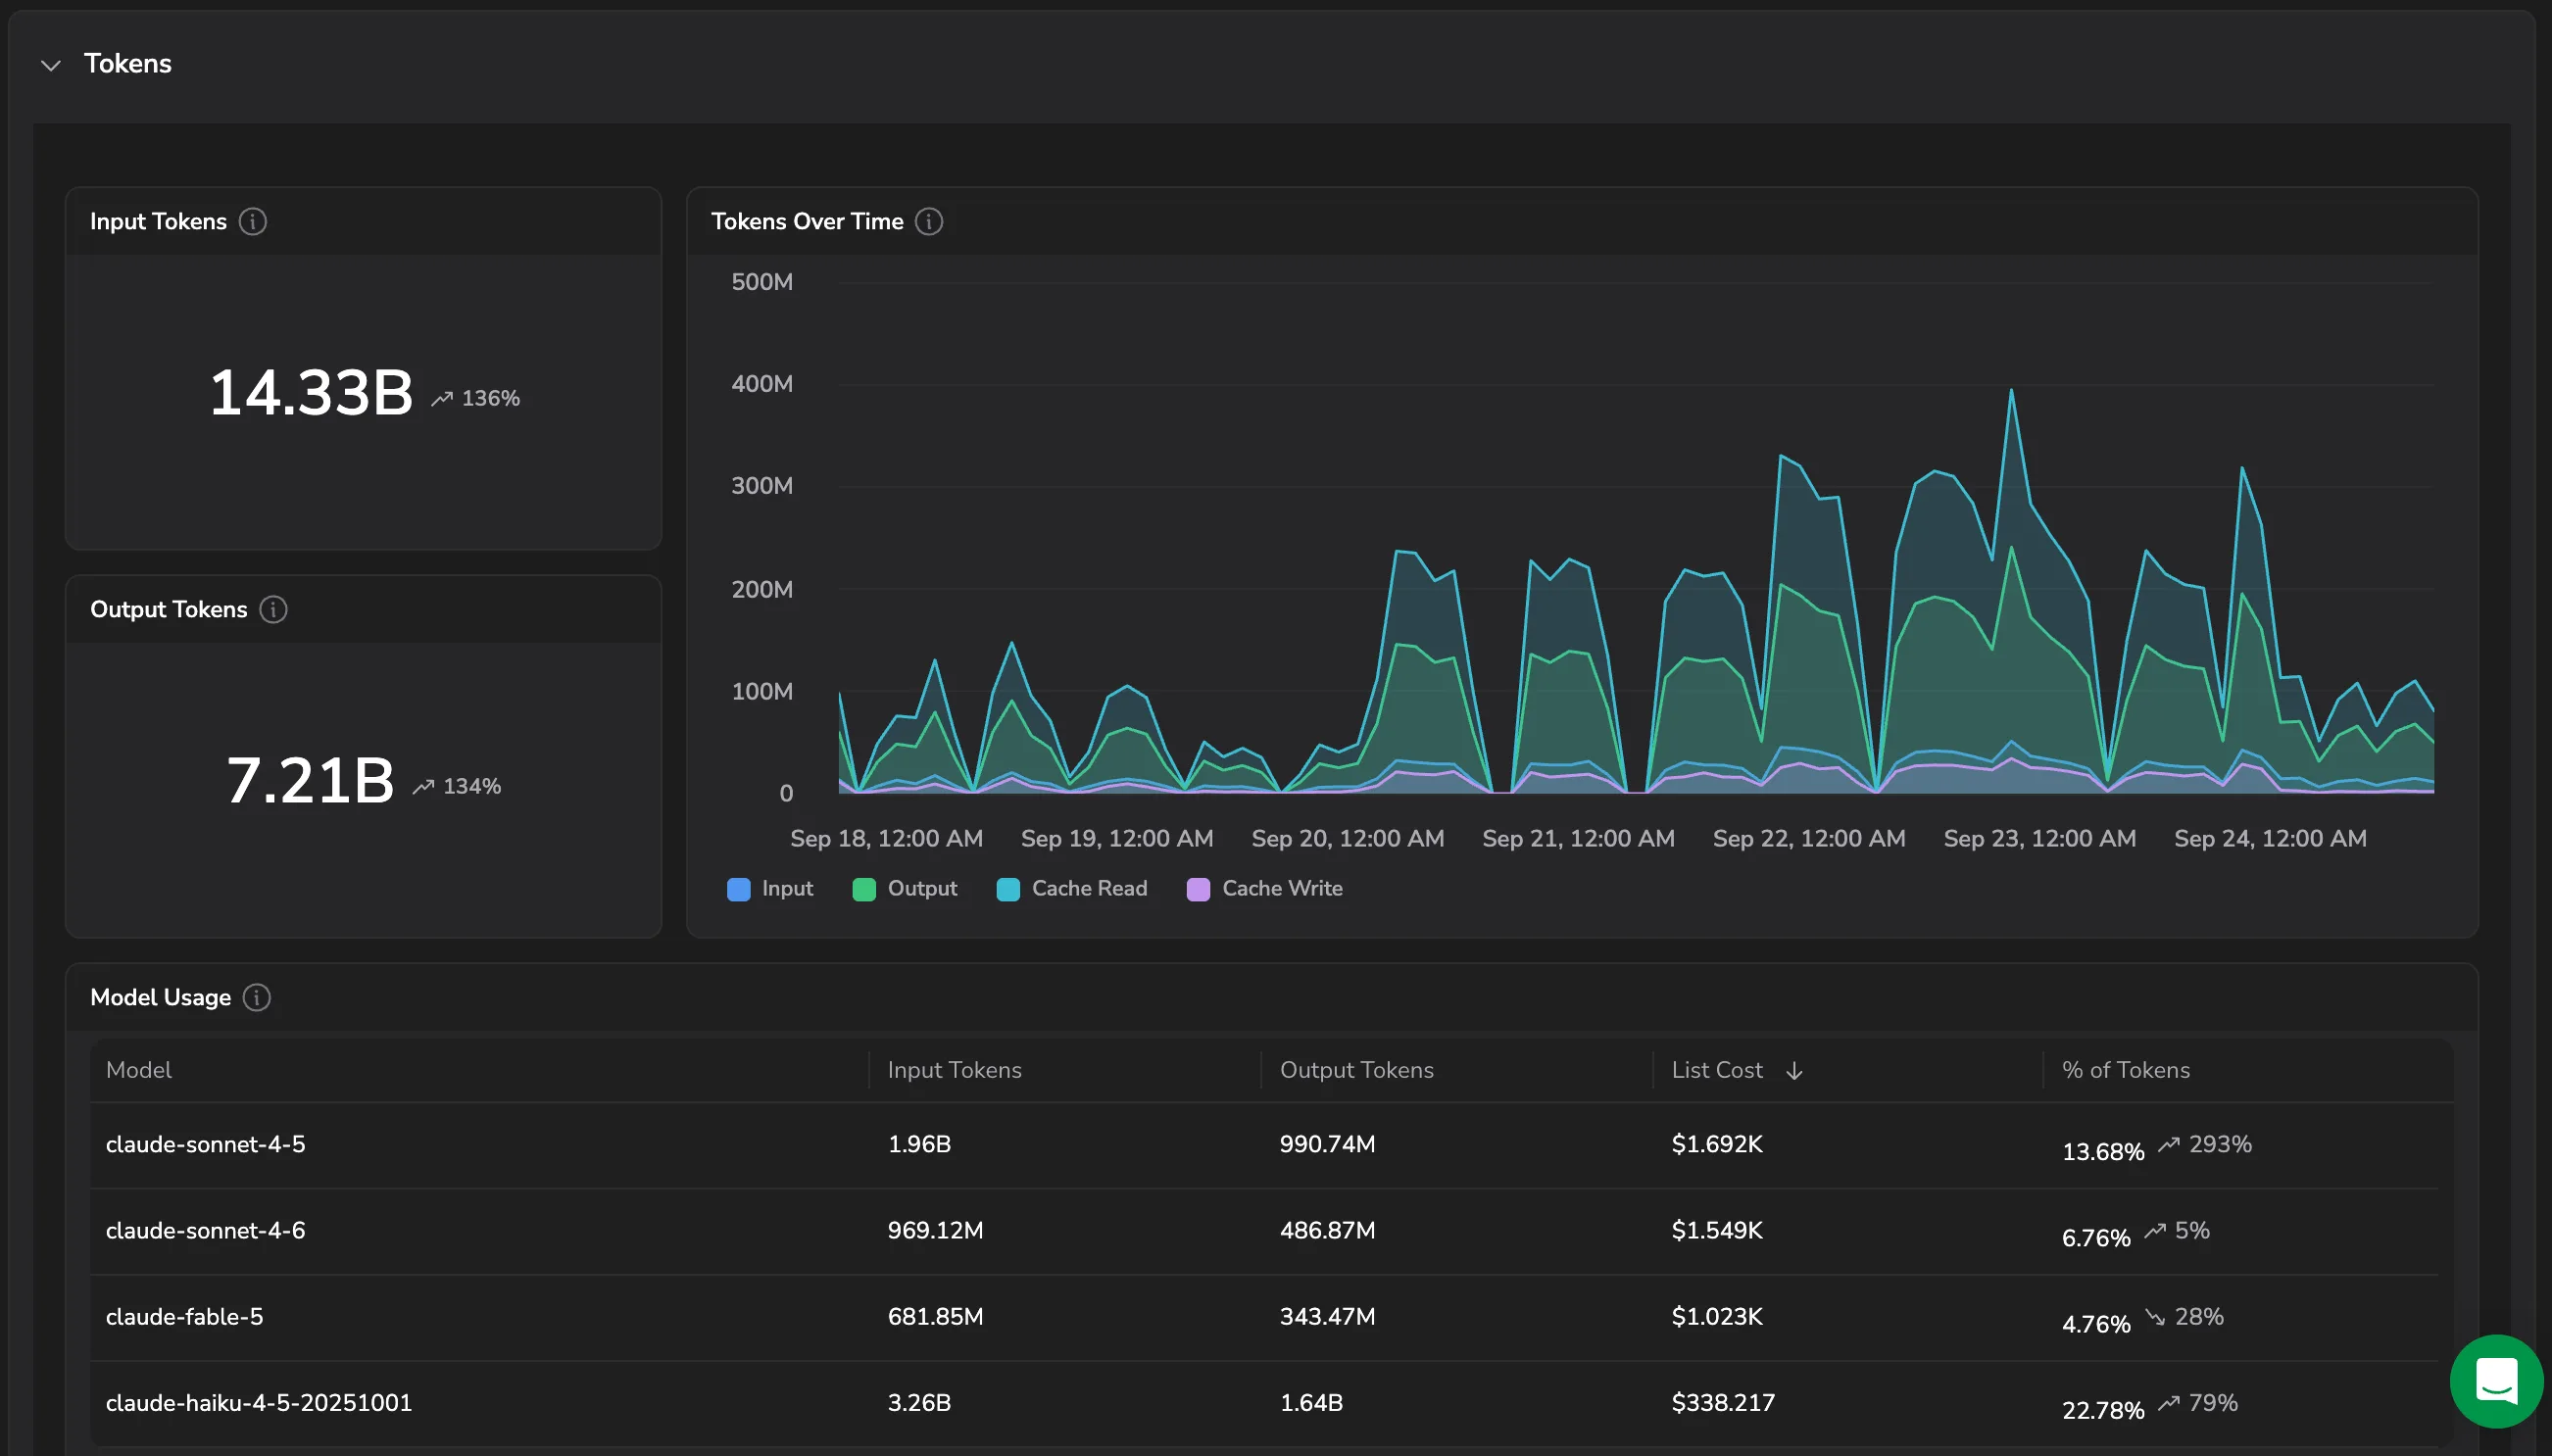
Tokens
- Input Tokens and Output Tokens: totals for the period. Input covers uncached prompt, cache read, and cache write together, the same basket the list price is charged on.
- Tokens Over Time: where consumption is trending, split into Input, Output, Cache Read, and Cache Write.
- Model Usage: Model, Input Tokens, Output Tokens, List Cost, and % of Tokens, each with its trend against the previous equal period.
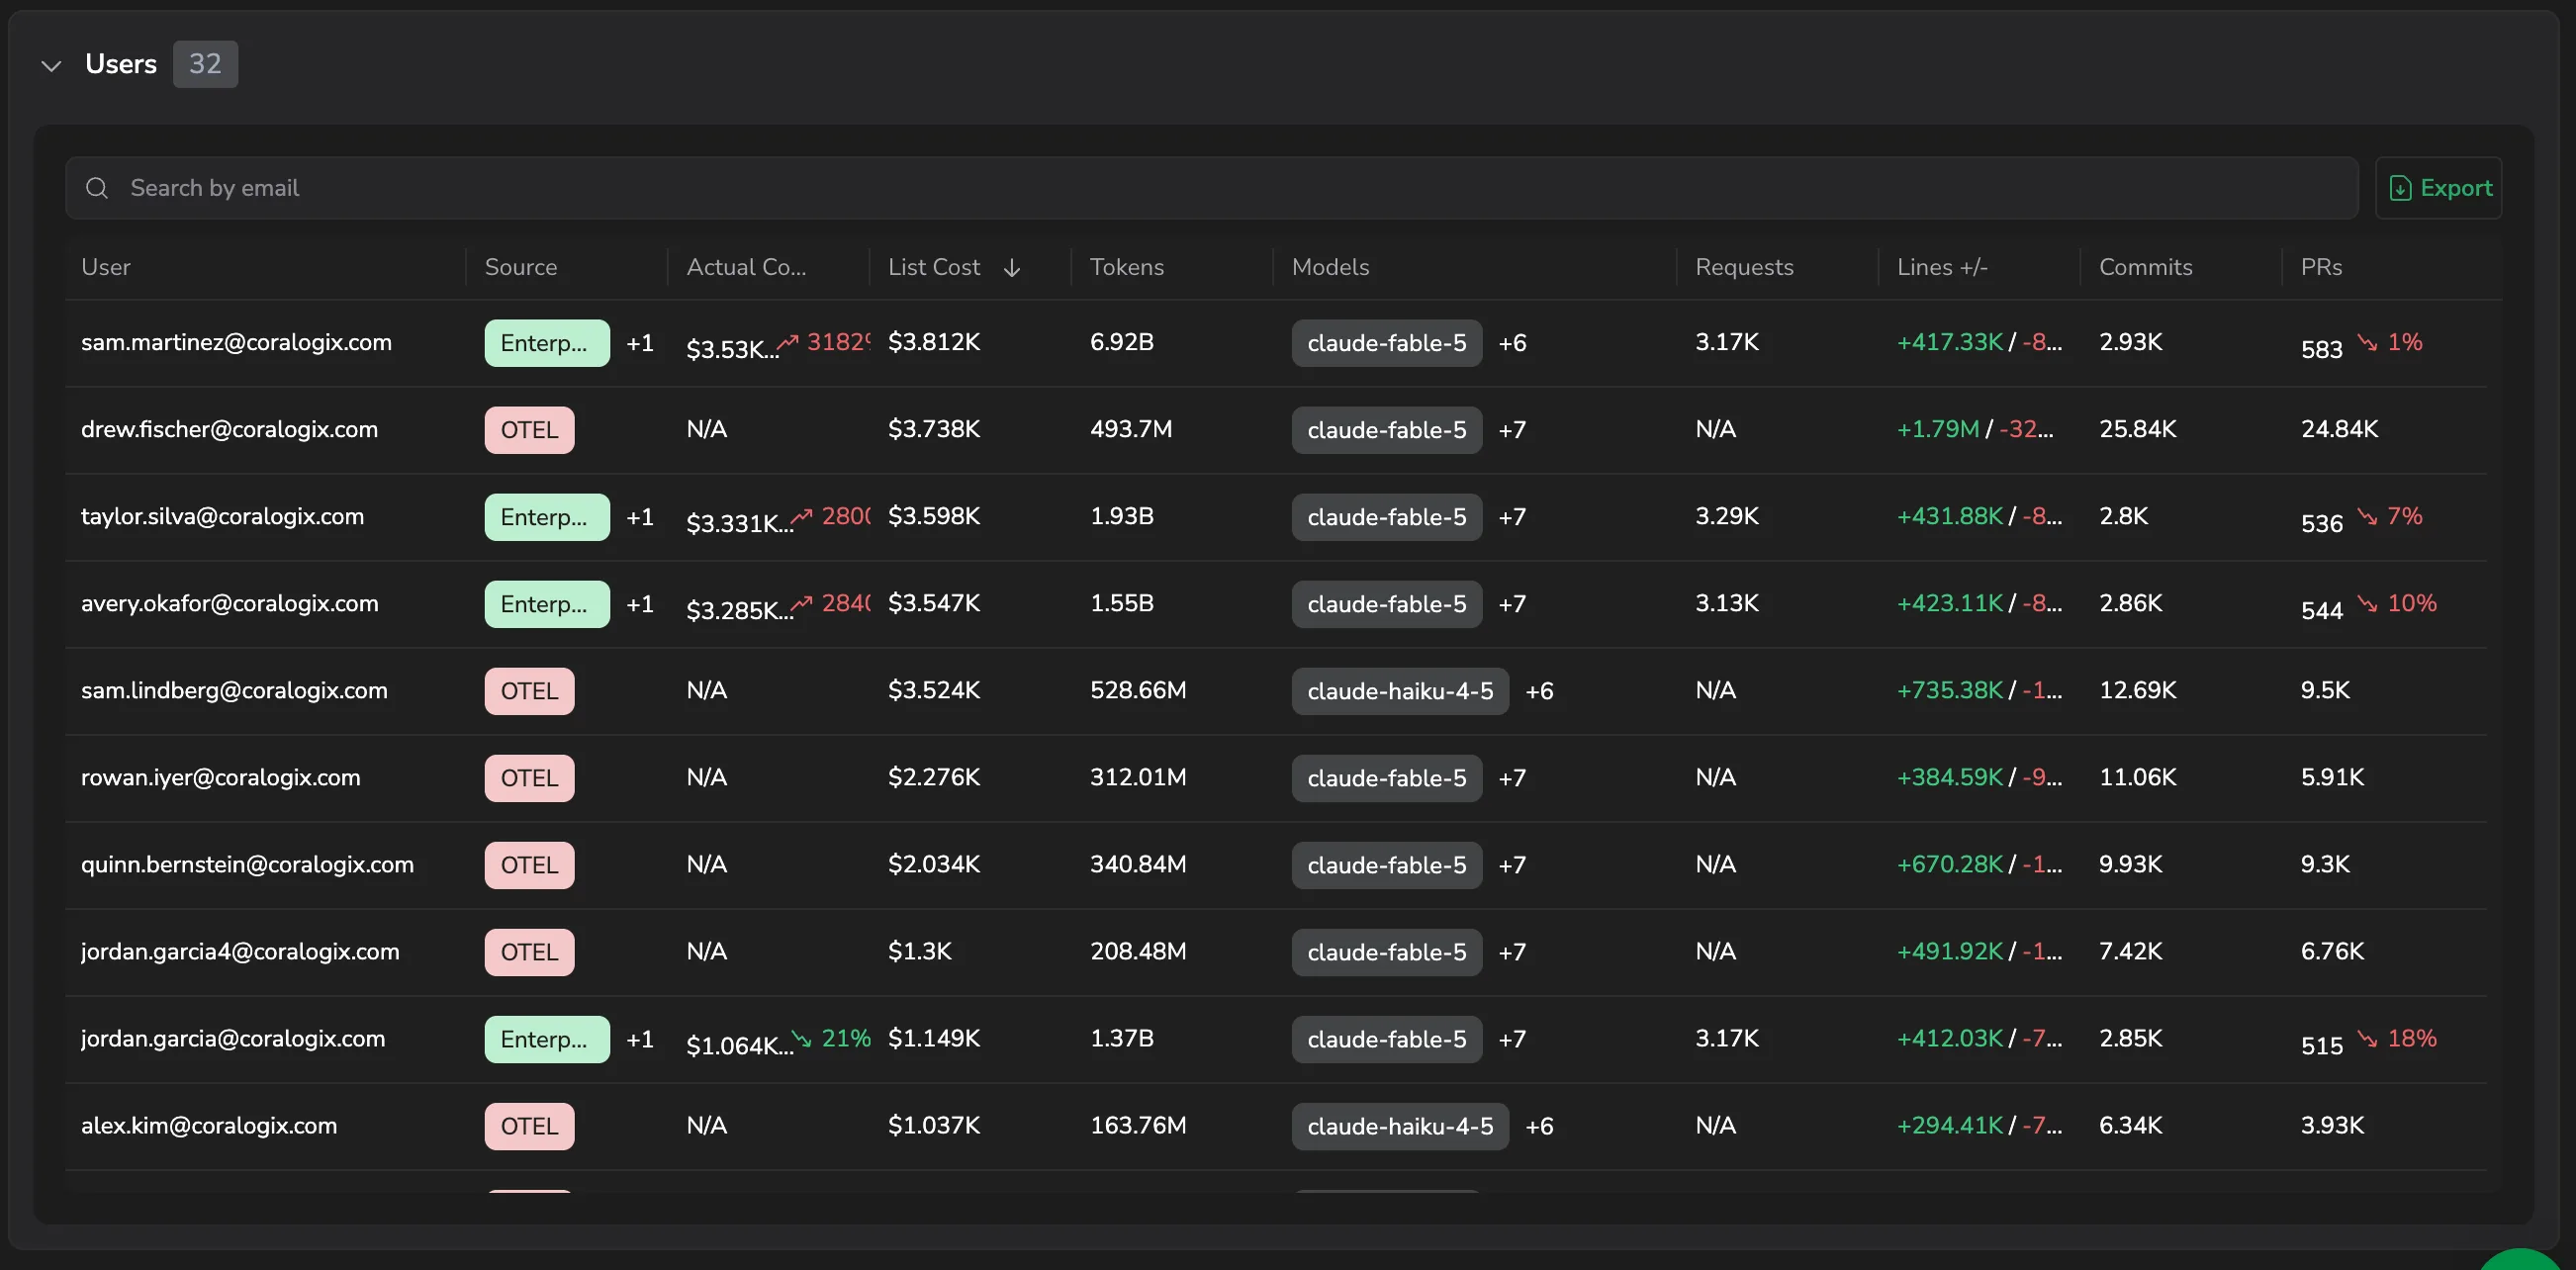
Users
The section header counts the users in range. Each row carries User, Source, Actual Cost, List Cost, Tokens, Models, Requests, Lines +/-, Commits, and PRs. Search by email, select Export to download the table, or select a row to open that user's activity, code impact, and cost by product.
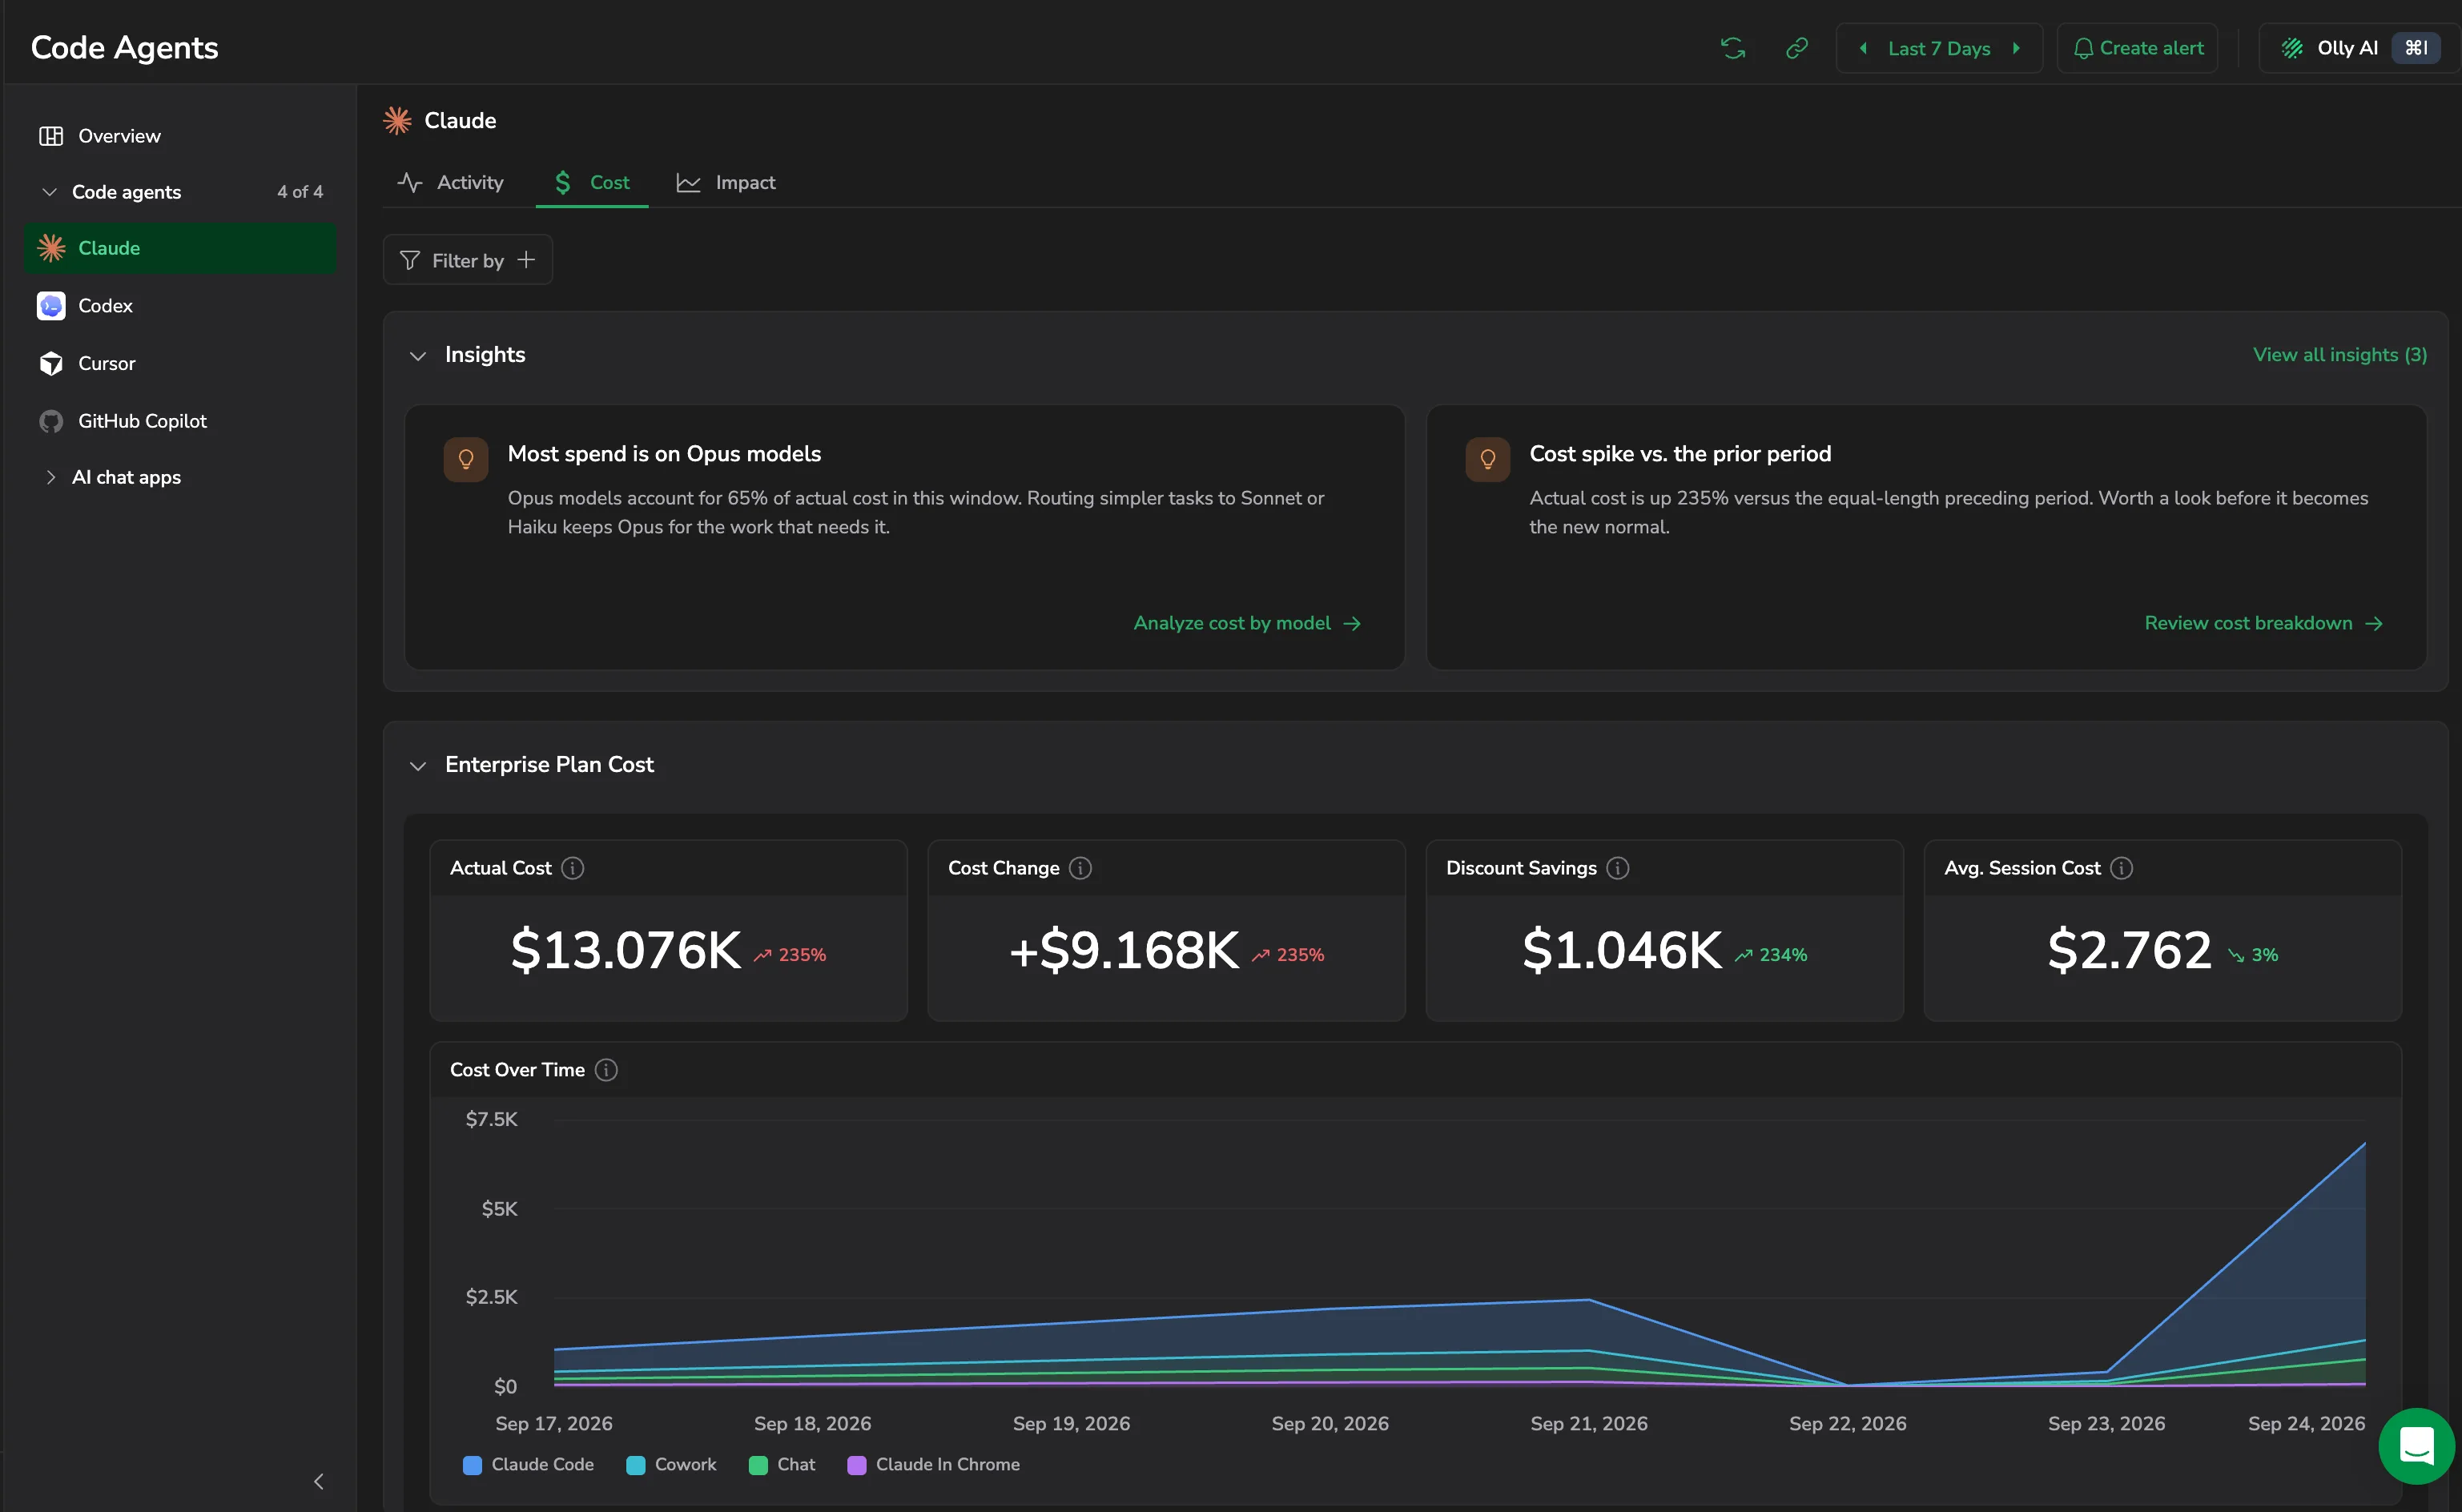
Enterprise Plan Cost
This tab needs the Claude Enterprise API.
- Actual Cost and Cost Change: what you actually paid, and how that compares with the preceding period.
- Discount Savings: the gap between list price and your negotiated rate.
- Avg. Session Cost and Cost Over Time: cost per session, and when spend moved. Cost Over Time breaks out by product, so you can see Claude Code, Cowork, chat, and Claude in Chrome separately.
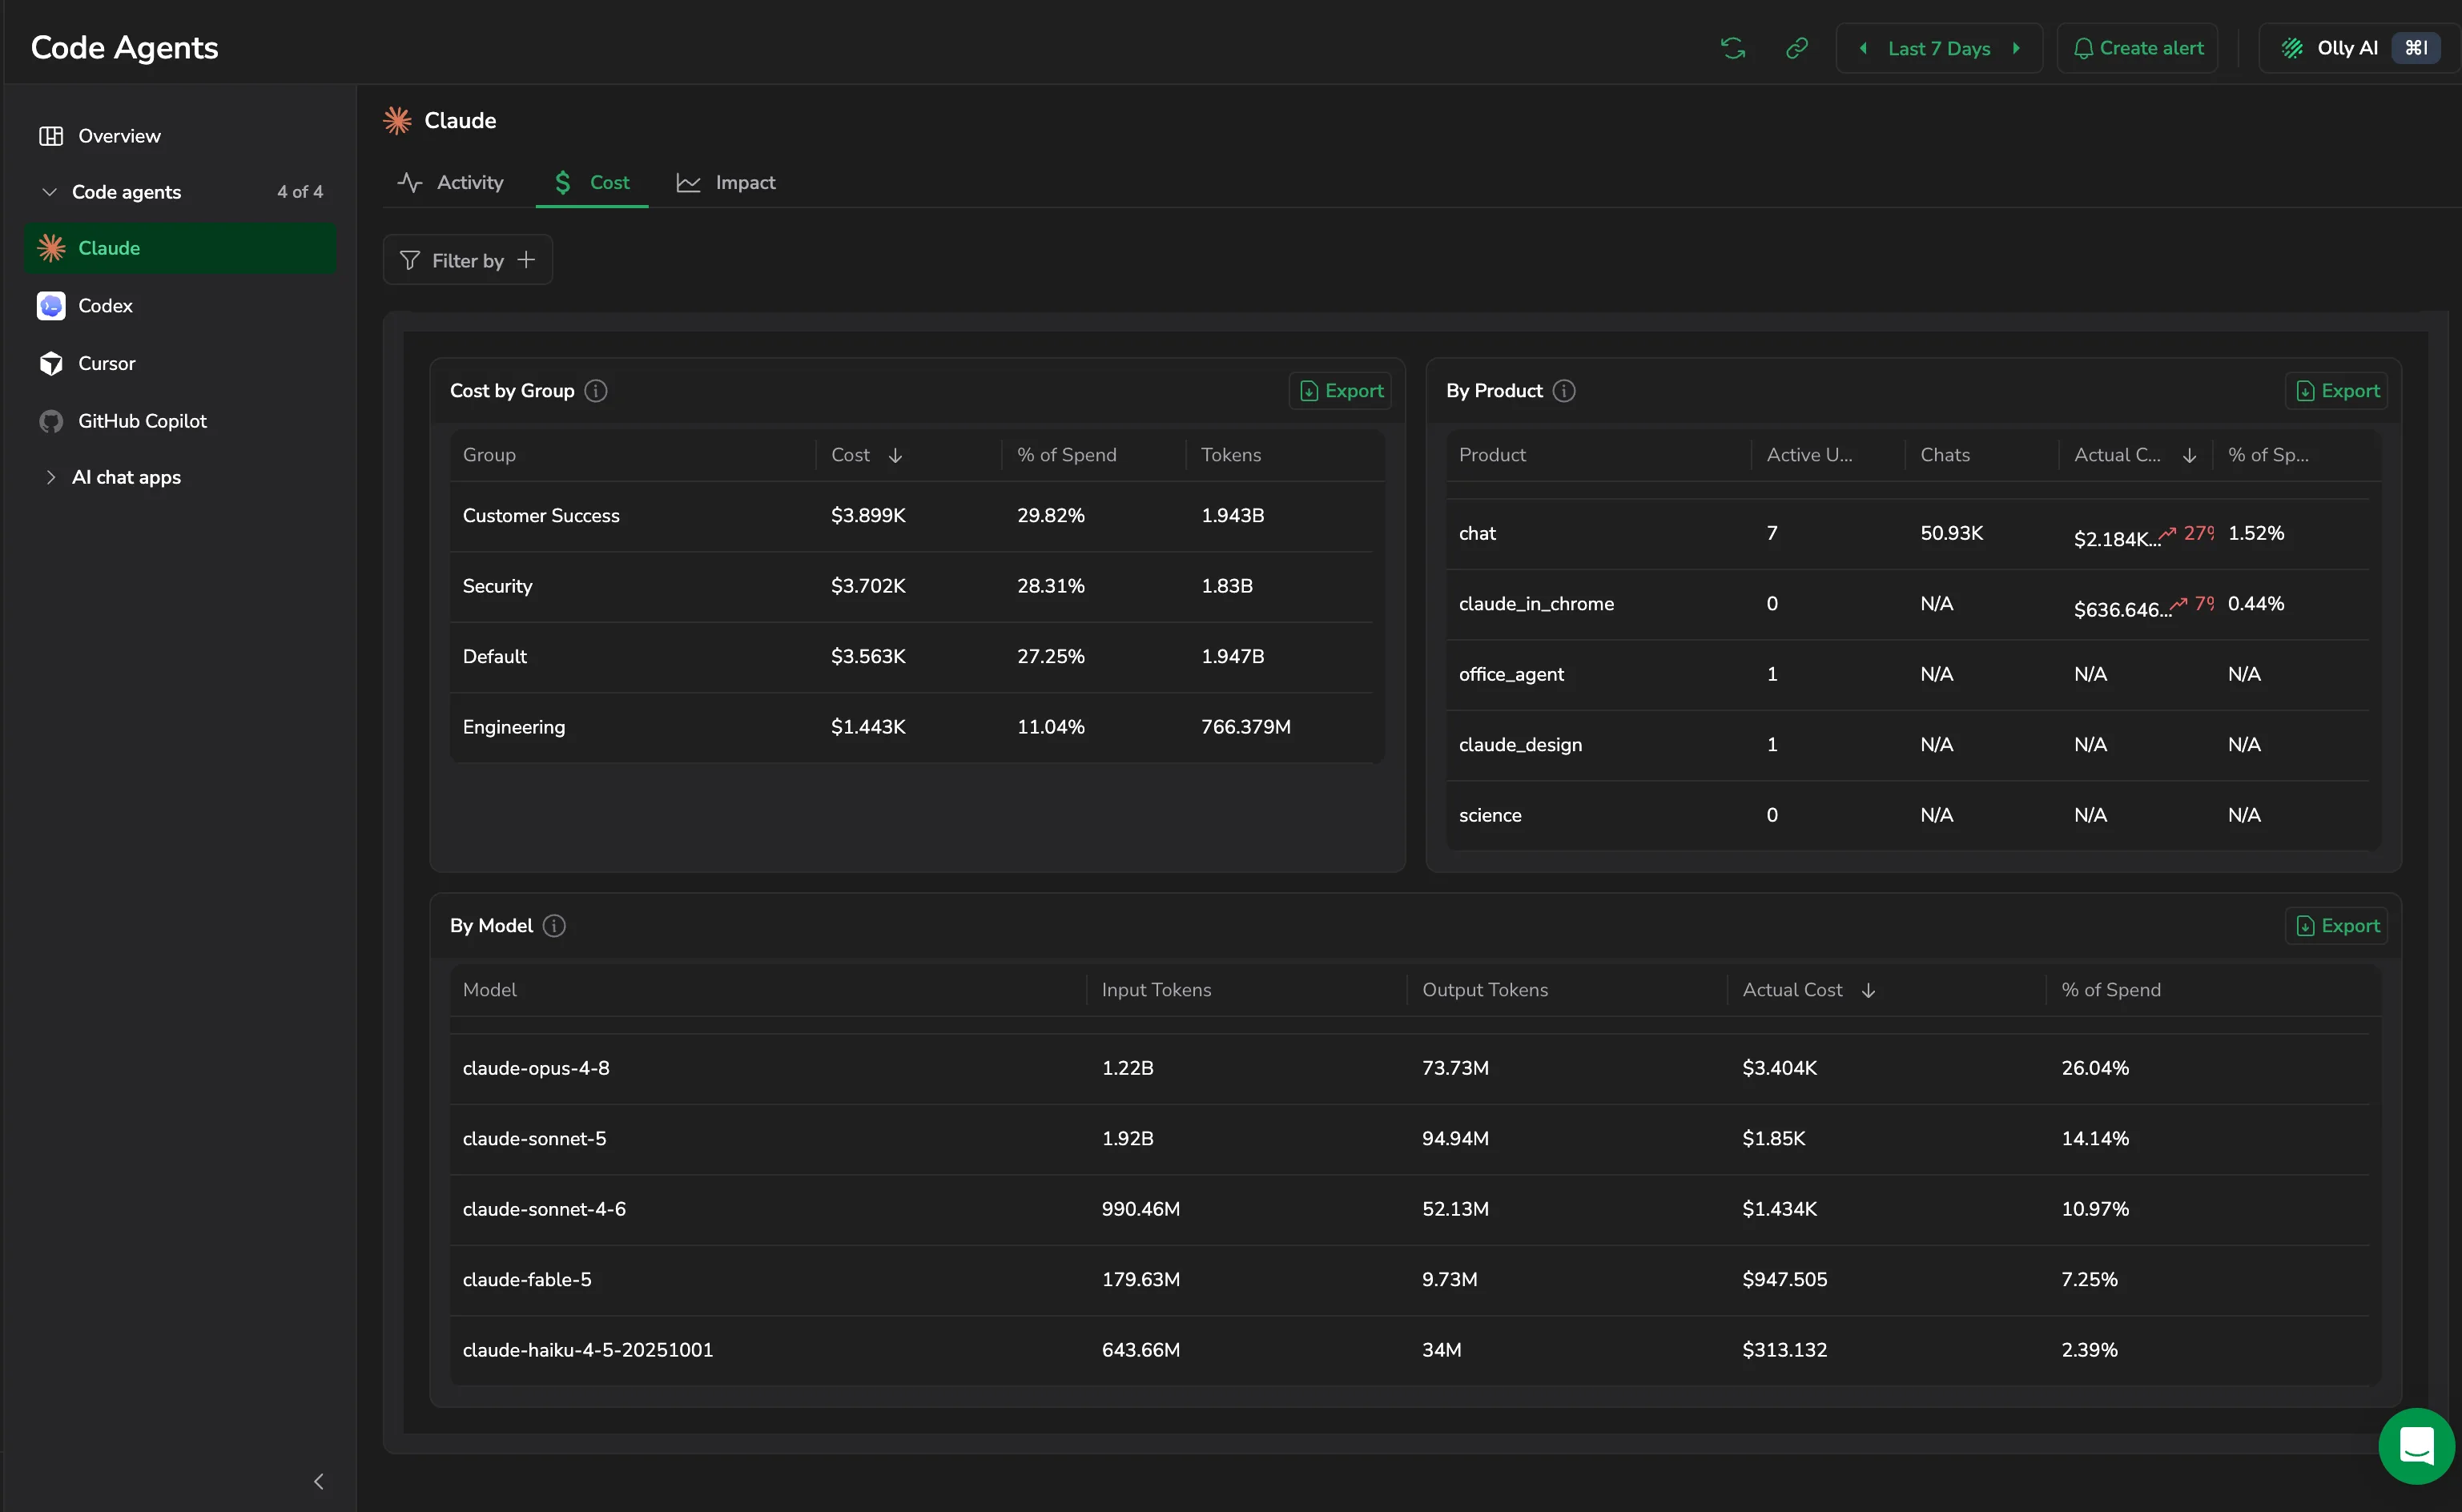
- Cost by Group: Group, Cost, % of Spend, Tokens.
- By Product: Product, Active Users, Chats, Actual Cost, % of Spend.
- By Model: Model, Input Tokens, Output Tokens, Actual Cost, % of Spend.
Each table exports to CSV.
Code Impact
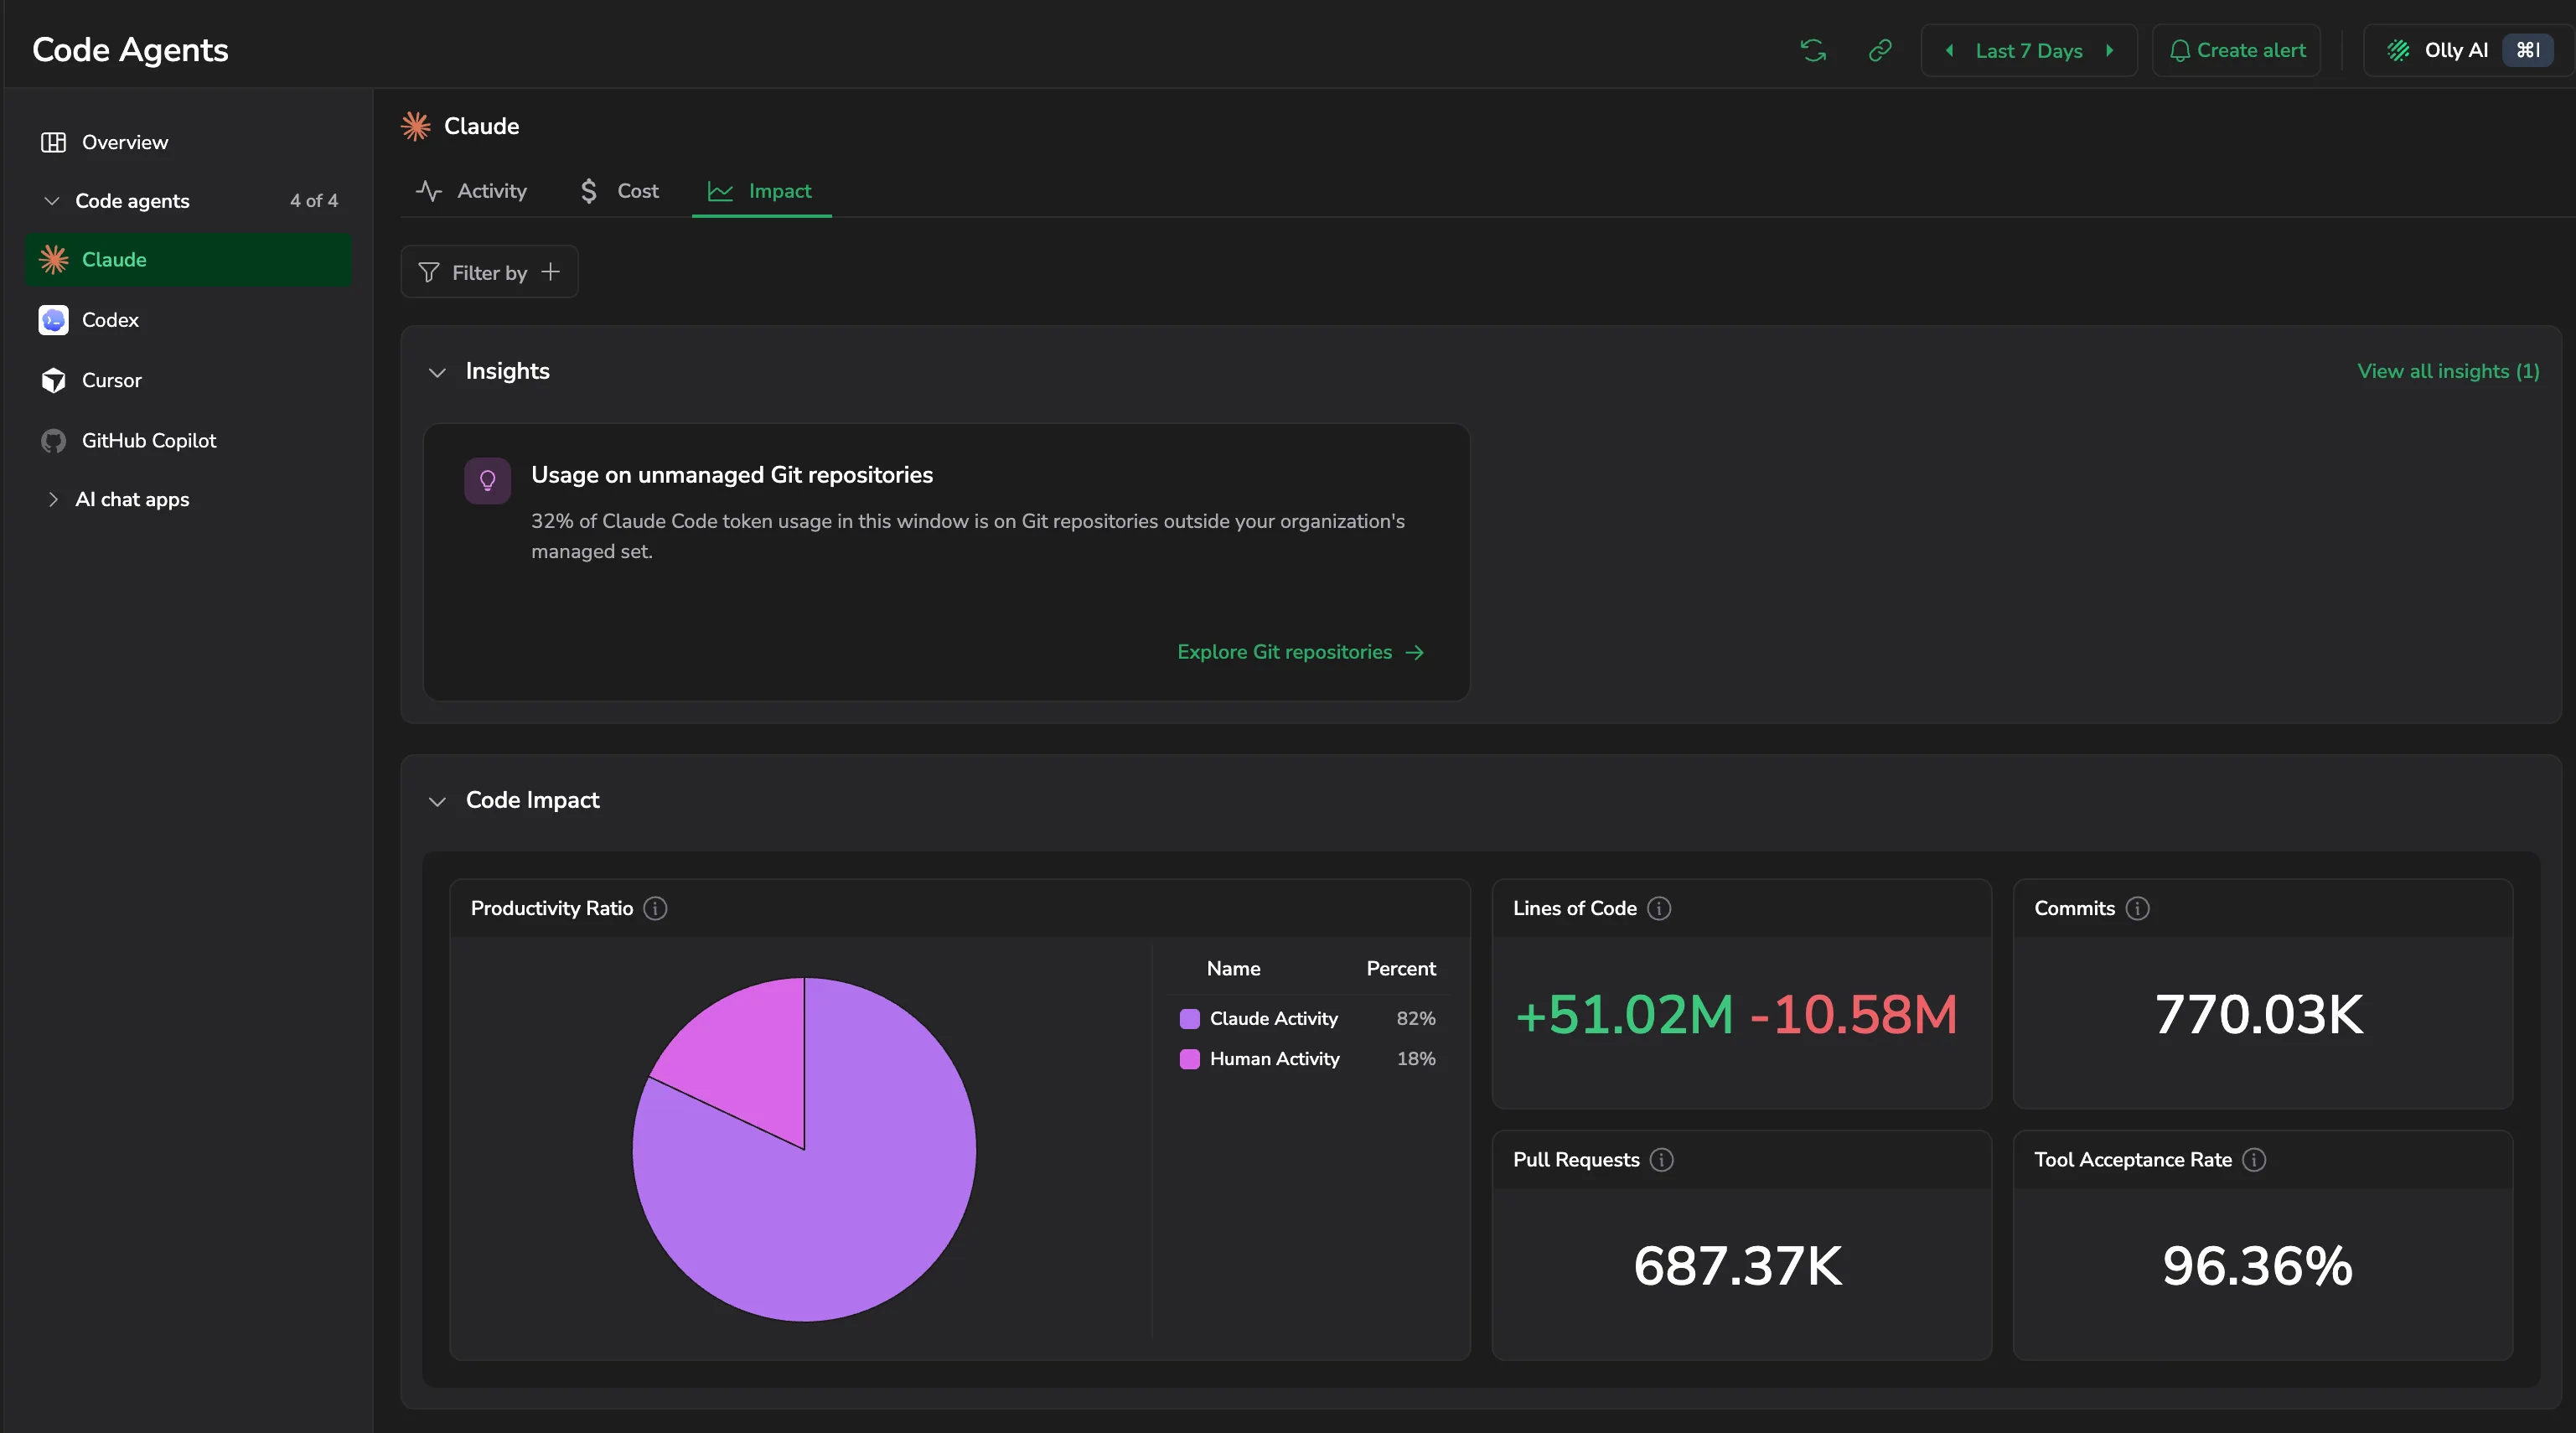
This section needs OpenTelemetry, and applies to Claude Code only, since Cowork doesn't touch repositories.
- Productivity Ratio: the split between Human Activity and Claude Activity. A higher Claude share means more output came directly from the agent.
- Lines of Code: added and removed, side by side, rather than a net figure.
- Commits and Pull Requests: what the work produced.
- Tool Acceptance Rate: the share of Claude's tool suggestions that developers accepted.
Git Repositories
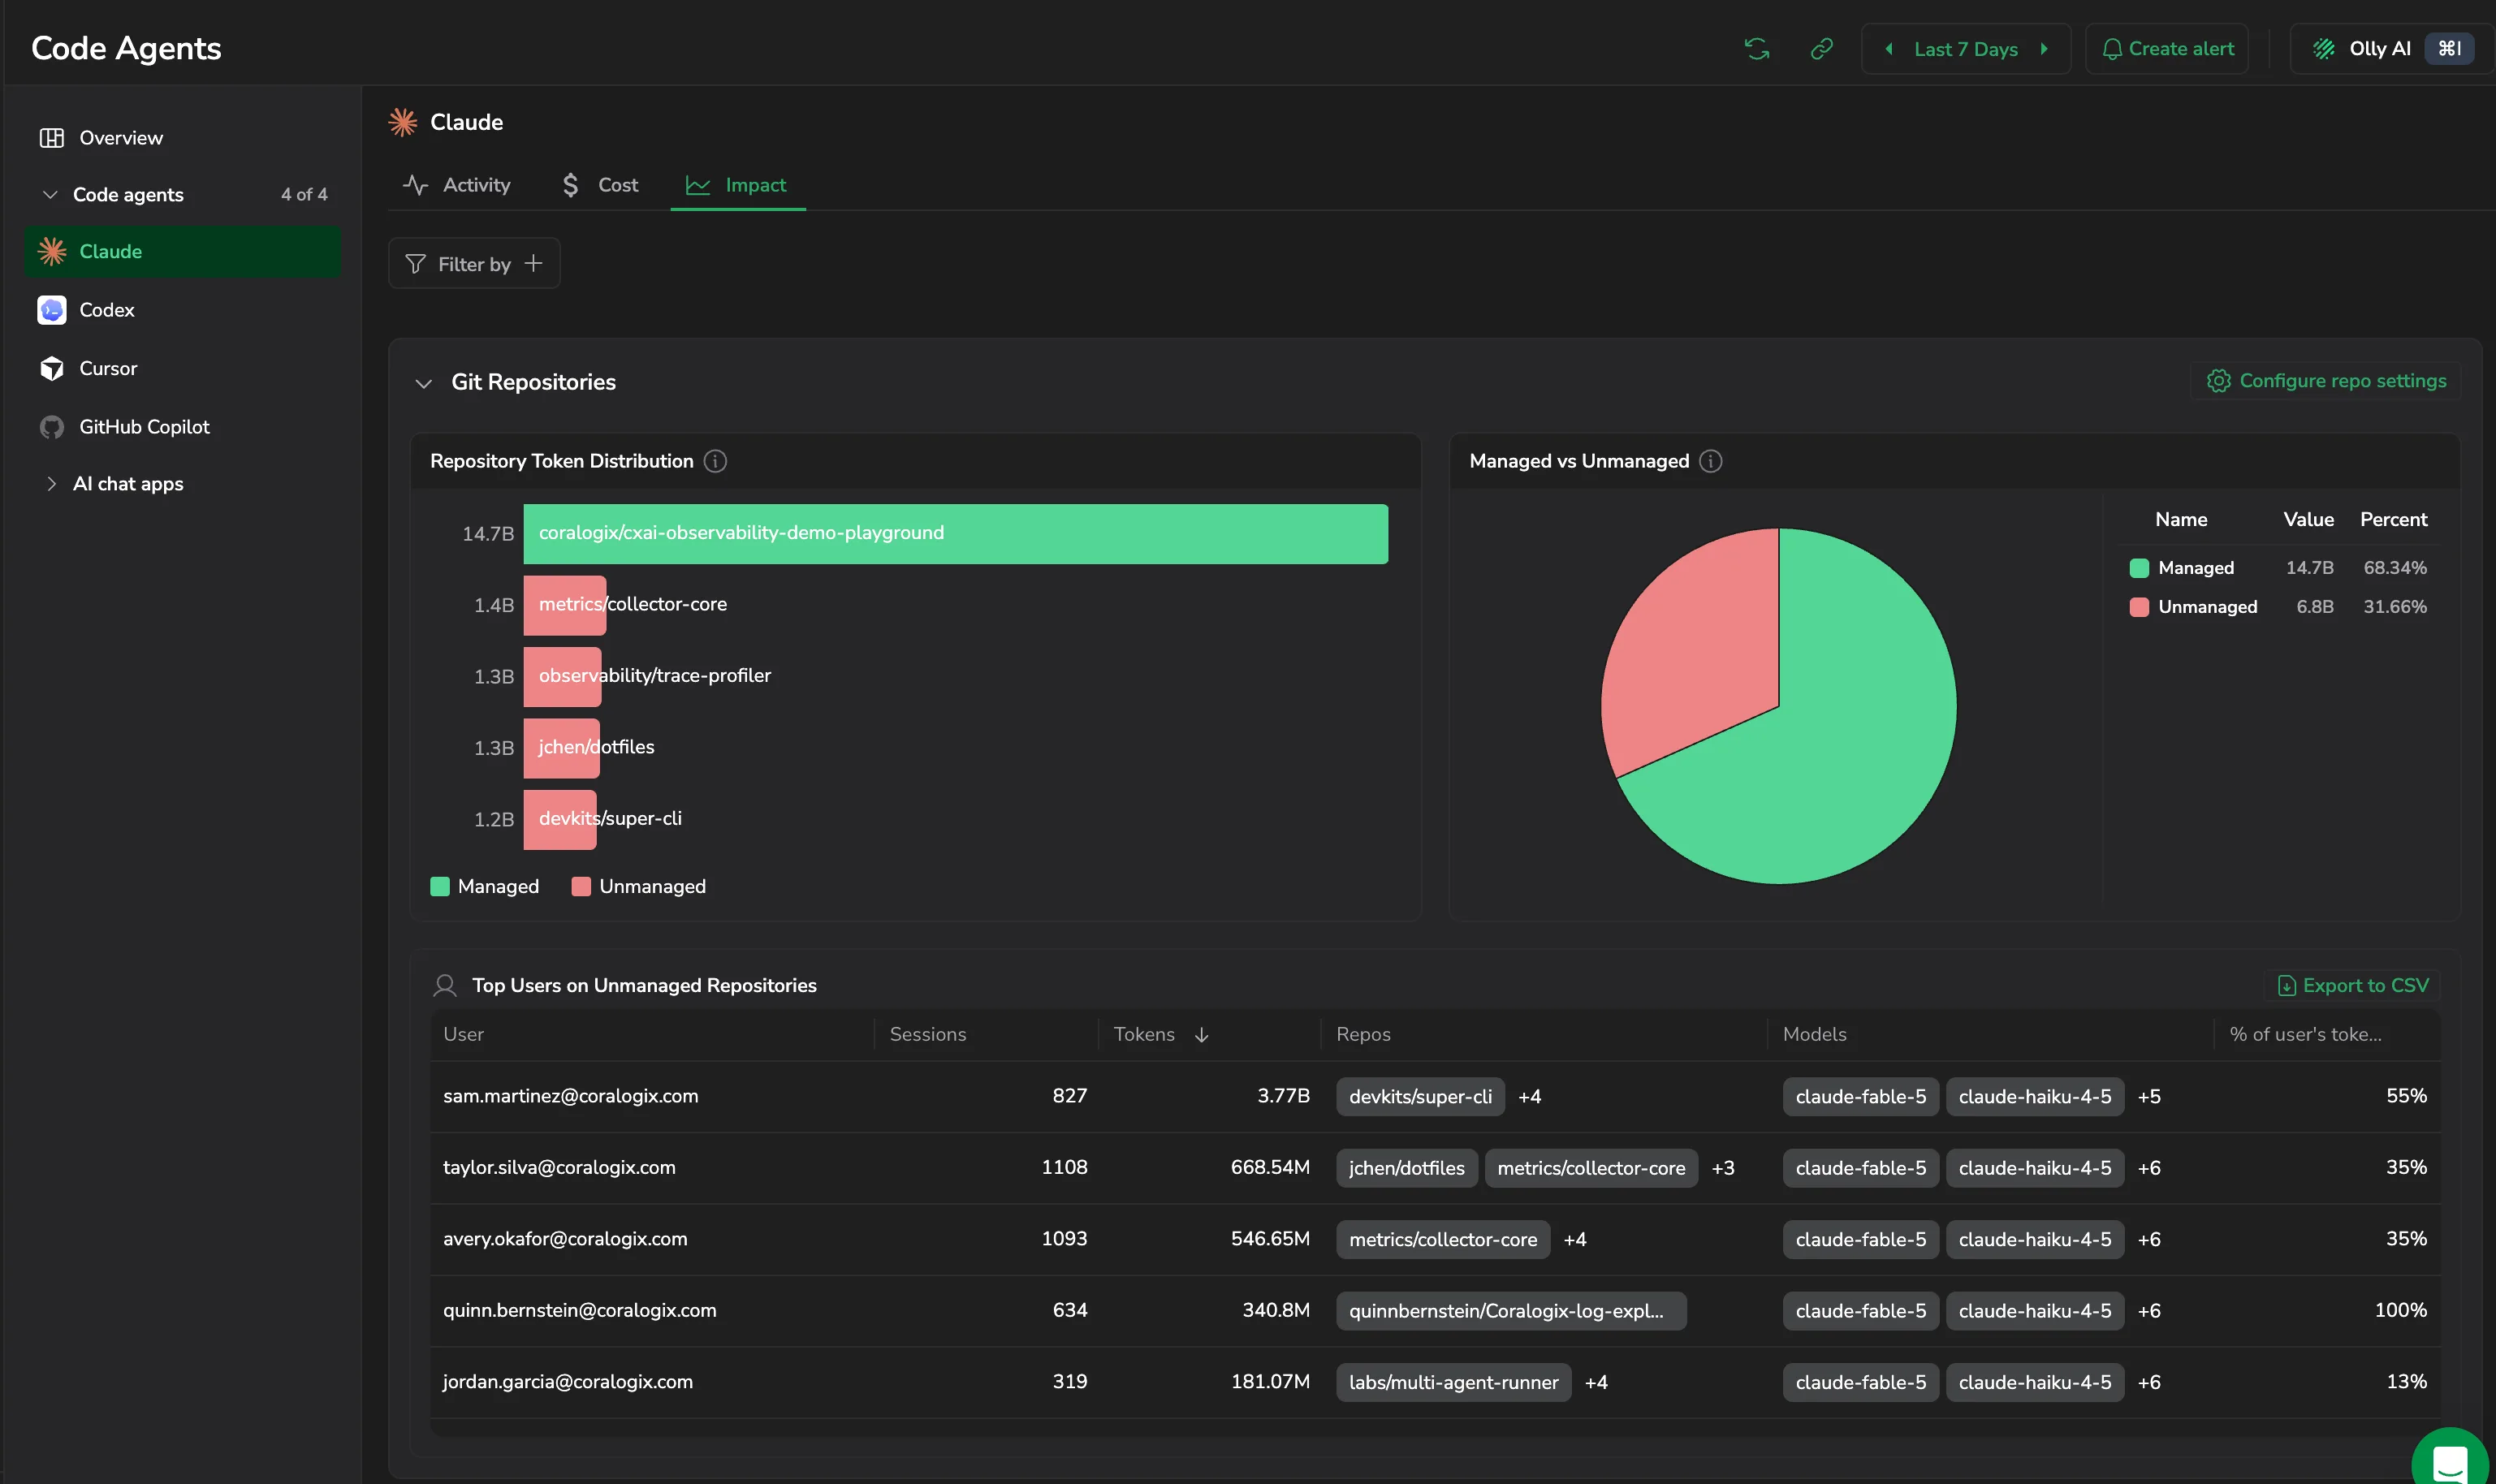
See not just how much Claude Code is costing you, but what each repository is actually getting out of it. The Git Repositories section attributes every per-session signal (tokens, cost, code impact, models invoked, session counts, and the developers behind them) to the repositories Claude Code actually touched. You can see how that activity distributes between Managed repos (those owned by an Organization you configure in Settings → AI Center → Code agent) and Unmanaged ones: personal projects, external clones, or private projects that consume the company's Code Agents license.
To populate this section, attribute sessions to repositories on the Claude Code integration.
What this unlocks
- Every Claude Code session's full signal (cost, tokens, code impact (lines of code, commits, PRs), and the model used) attributed to the repository it actually touched.
- A clean split between Managed repos (owned by Organizations you configure in Settings → AI Center → Code agent) and Unmanaged ones, personal projects, external clones, and private projects running on the company's Code Agents license.
- Pivot freely: from a repo to its top users, or from a user to their repos, models, and tokens-over-time pattern.
Use cases
Two stories that show what the Git Repositories section makes possible. Same trigger, different conclusions. Expand each one to follow the drill.
You notice a sharp spike in Claude Code spend on the Cost tab, $7K in the past hour. The question forms instantly: is this work the company is paying for, or work the company is losing?

Switch to the Impact tab. The Repo type pie tells you where the money's actually going.
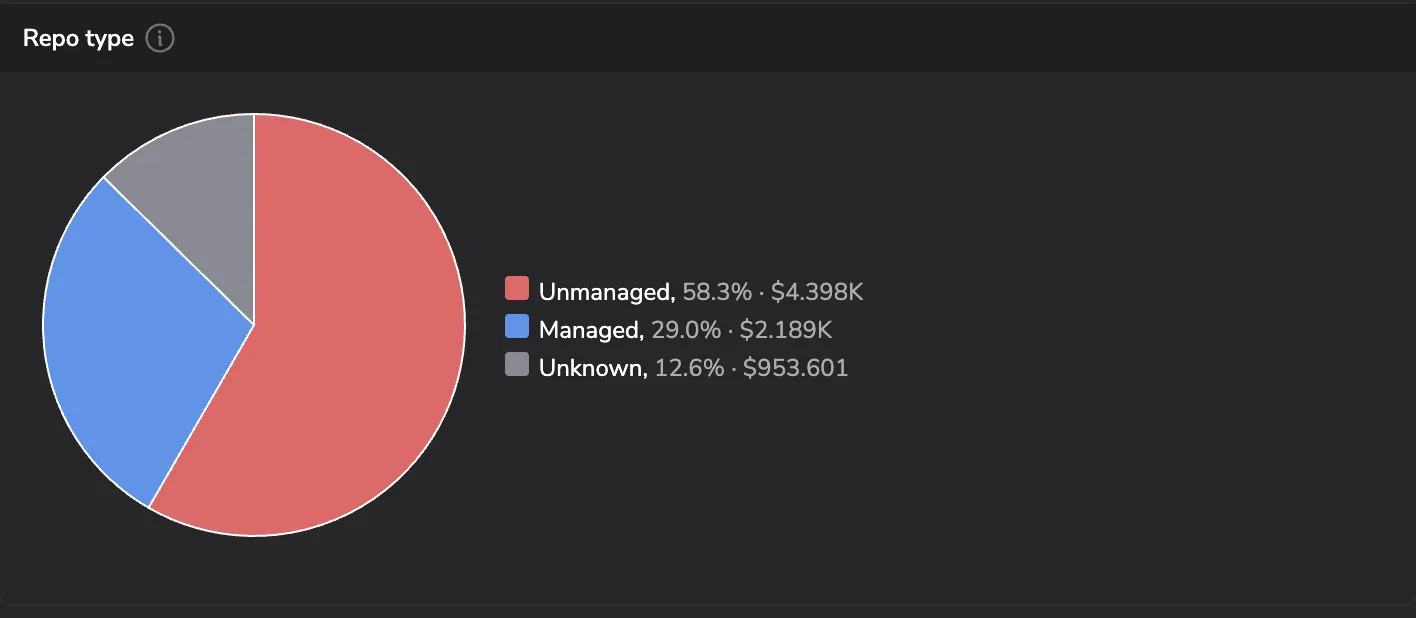
58% on Unmanaged is a lot of money on code outside your organization. Select the slice. The drawer scoped to Unmanaged surfaces every user contributing, ranked by cost, with the specific repos they touched.
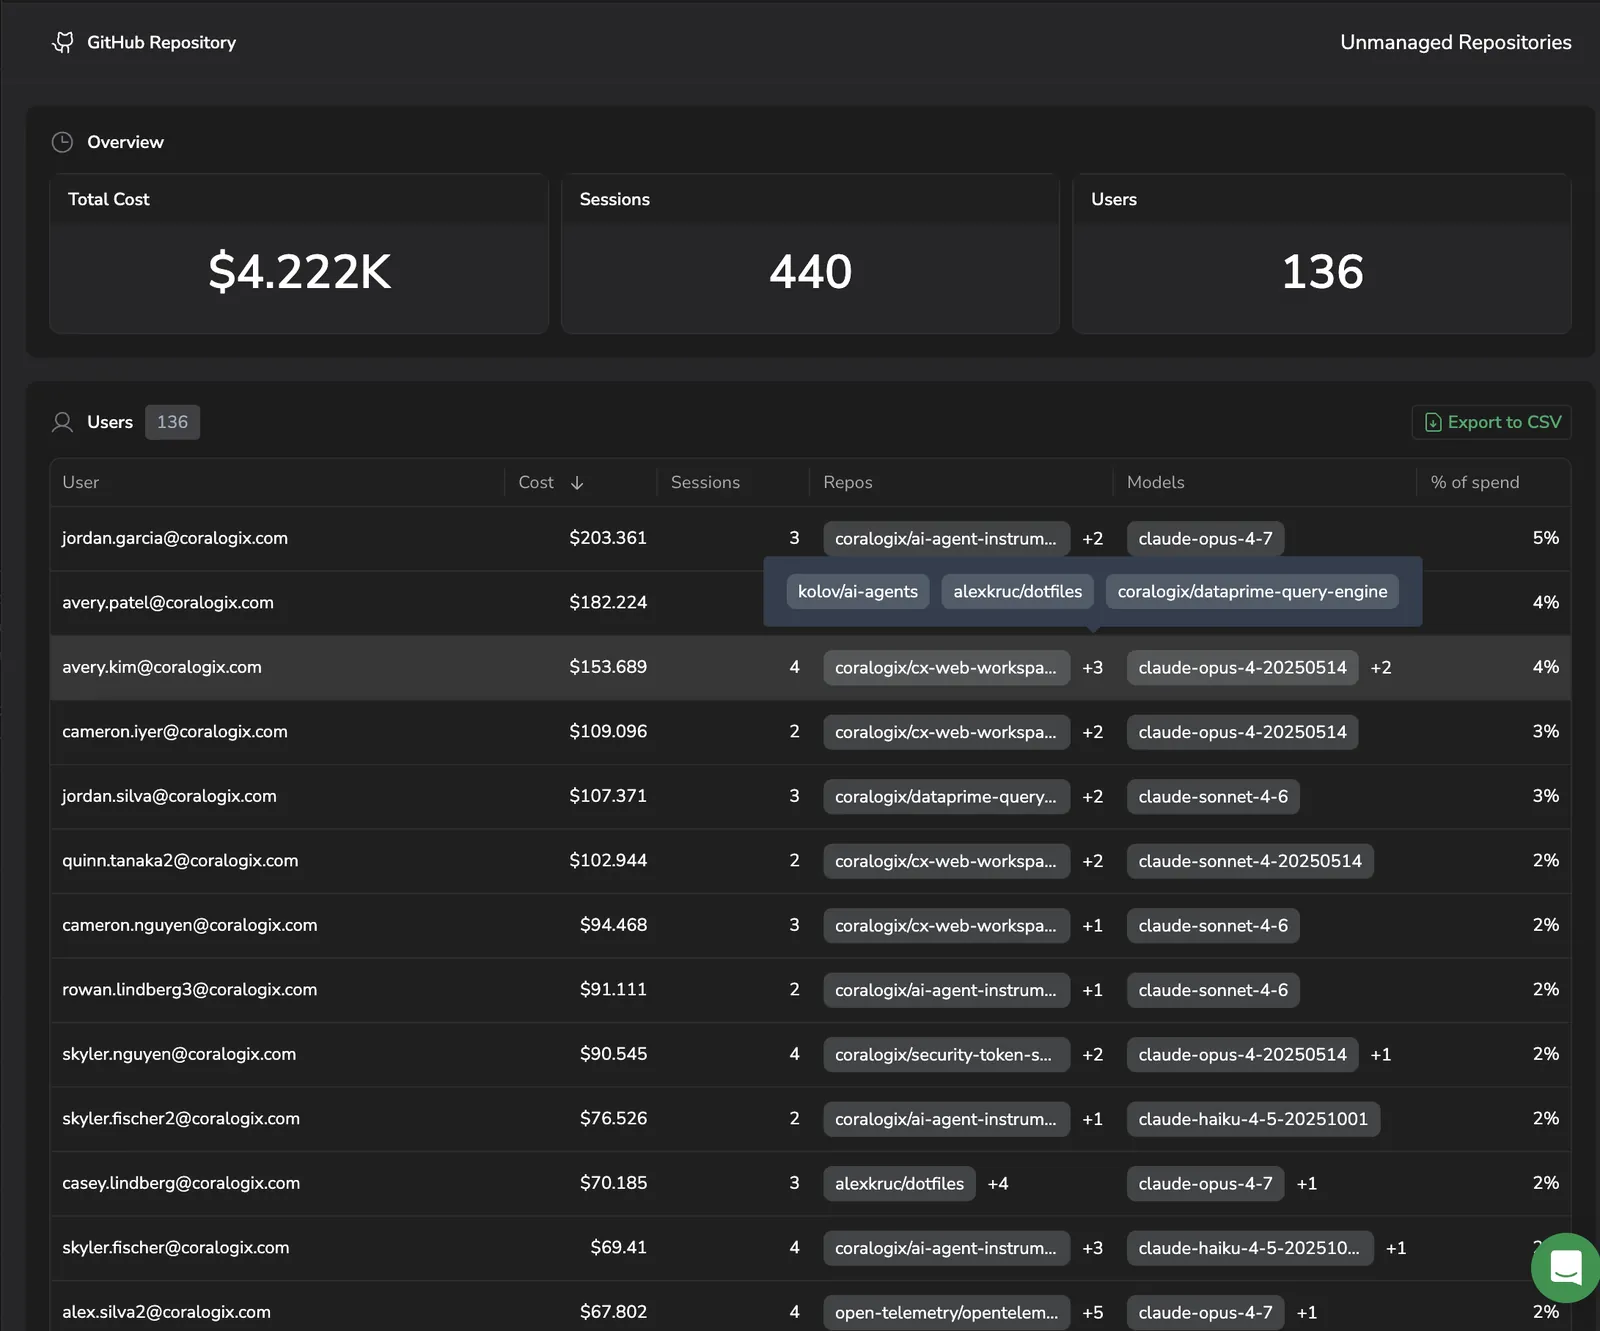
Scan the table for a repo name that sounds like internal work but lives on a personal account, knowledge-base, architecture-notes, anything that maps to internal IP. Select that user.
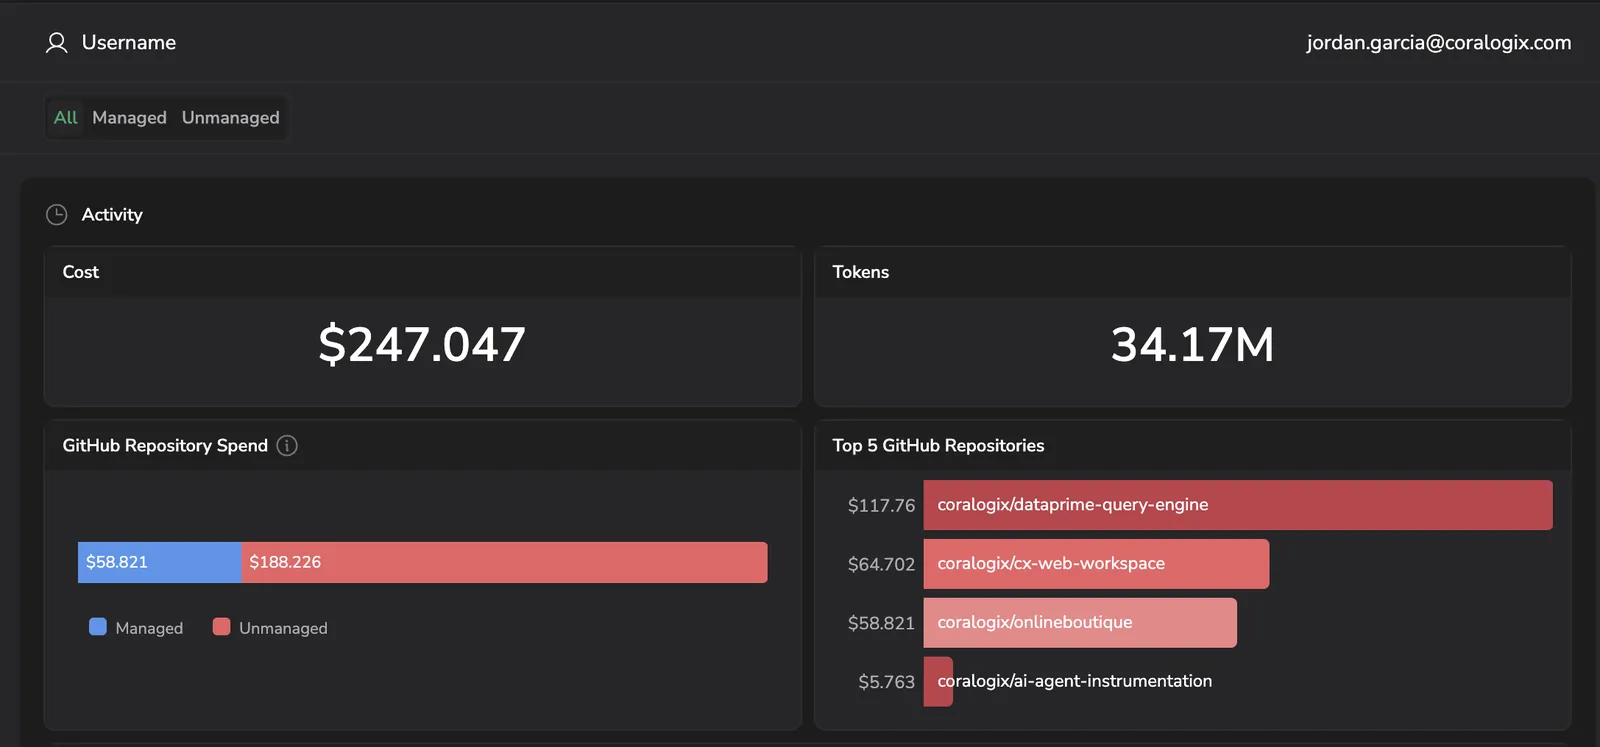
Three-quarters of this developer's Claude Code spend is going into a personal repo that holds company-relevant code. When they leave the organization, that work leaves with them, and the company has no claim on the IP they built.
What you do with this: you now have the data and the receipts to surface the conversation with the developer early, and route the work back into your organization's GitHub before the IP walks out the door.
Same view, different question. You're not chasing a spike, you're running the routine FinOps audit: of every dollar the Code Agents license is spending, how much is going into work the company actually owns?
The number itself isn't the question. Where that number is going is. Switch to the Impact tab, where the Repo type pie splits spend between code your organization owns and code it doesn't.
More than half the spend ($4.4K on Unmanaged) is buying agent capacity on code outside your organization. Some of that is legitimate (external clones, exploratory work), and some of it isn't. Select the Unmanaged slice. The drawer ranks every developer contributing to that bucket by cost, with the specific repo names they touched alongside.
This time you're scanning for repo names that don't fit company work at all, weekend-game, myschool-startup, family-website. Each one of those is the company's paid agent capacity being spent on a developer's personal project. Pick the user with the most spend against names like that and select their row.
The user drawer breaks that developer's spend down two ways. The Repository Spend stacked bar shows the split between company work and personal projects in a single glance, so you can see at once whether this developer's company-license use is mostly legitimate with a personal-project tail, or mostly personal with a thin company veneer. The Tokens over time chart, filtered to Unmanaged, then shows when that personal activity is actually happening, and that timing is what shapes the conversation.
If the unmanaged usage clusters during work hours, the personal project is being built on company time, and the conversation is about budget and time. If it recurs week after week at off-hours, the company's Code Agents license is funding ongoing personal work, and the conversation is about usage policy. If it's a one-off burst on a weekend with low cost, it's a hobby project on someone's own time, probably not worth flagging.
The data tells you which conversation to have. More importantly, it lets you have it with receipts in hand instead of suspicion.
What you need
The Git Repositories section is enabled by three independent layers, each set up on the Claude Code integration:
- Claude Code's native OTLP exporter: feeds the core per-session signals (cost, tokens, sessions). Every tab in the Claude dashboard inherits this data.
- Coralogix repository-tracking hook: attributes each session to the repository the developer was working in. Without it, sessions still appear elsewhere on the dashboard, but they're not attributed to a repo.
- Repository Organizations: split attributed activity into Managed and Unmanaged buckets based on the Organizations you configure in Settings → AI Center → Code agent. Until you configure an Organization, Repository Token Distribution still renders, but the Managed vs Unmanaged breakdown prompts you to set one up and every repository is treated as Unmanaged.
For installation steps, the hook architecture, and org-wide rollout, see Connect Claude Code.
Widgets
Repository Token Distribution
A table of token consumption by repository, with Repository Name, Tokens, and Sessions. Select Export to CSV to download it.
Managed vs Unmanaged
How total tokens split between Managed repositories (owned by an Organization you configure in Settings → AI Center → Code agent), Unmanaged ones (owned by no configured Organization), and Unknown (sessions where the agent reported no repository name). Before you configure any Organization, this panel prompts you to set one up instead of showing the split. Once configured, repositories with no matching Organization appear as Unmanaged.
Top Users on Unmanaged Repositories
A ranked table of the users with the most activity on Unmanaged repositories, with User, Cost, Sessions, Repos, Models, % of user's tokens, and Tokens.
Per-session activity is split across the repositories a session touched, proportionally to file activity. Sessions launched outside any Git repository land in the Unknown bucket.
Drill into a repo or bucket
Selecting a row in Repository Token Distribution opens a side drawer scoped to that repository. Selecting a segment of Managed vs Unmanaged opens the drawer scoped to that bucket, whether Managed, Unmanaged, or Unknown.
The drawer shows the totals for your selection alongside a table of its top users.
Selecting a row in Top Users on Unmanaged Repositories opens the standard user drawer, pre-filtered to that user's unmanaged-repository activity.
Select Configure repository organization from either place to set the Organizations that decide the split.
Alert examples
Example alerts you can build on Claude Code and Cowork metrics to catch cost spikes, runaway sessions, and unapproved models early. Each one expands to show what it detects and the query to use. Most of these are also available as ready-to-deploy alerts in the Code Agents alerts extension.
Alerts when token usage is recorded against a Claude model that wasn't present over the previous 7 days, a newly released or previously unseen model version (for example, Claude Fable 5) is in use. The alert surfaces the exact model name so leadership can assess whether it's sanctioned and act accordingly.
count by (model) (
  claude_code_token_usage_tokens_total
)
unless
count by (model) (
  claude_code_token_usage_tokens_total offset 7d
)
Alerts when a single user's cumulative spend over 24 hours crosses a threshold (for example, more than $100 per user). Surfaces individual runaway usage before it distorts org totals.
sum by (user_email) (increase(claude_code_cost_usage_USD_total[24h]))
Compares the last 15-minute cost rate against the 1-hour rolling average. A ratio above 3 means spend is accelerating 3× faster than baseline.
sum(rate(claude_code_cost_usage_USD_total[15m]))
/ sum(rate(claude_code_cost_usage_USD_total[1h]))
Alerts when a single model accounts for more than 80% of total spend. Useful when an expensive model should be used selectively but is dominating usage.
sum by (model) (increase(claude_code_cost_usage_USD_total[1h]))
/ sum(increase(claude_code_cost_usage_USD_total[1h]))
Alerts when token consumption is high but no commits have been recorded for 2 hours (threshold: tokens > 50k and commits == 0).
sum(increase(claude_code_token_usage_tokens_total[2h])) > 50000
and
sum(increase(claude_code_commit_count_total[2h])) == 0
Fires when a single session accumulates more than 2 hours of active agent time. Active time far beyond a normal coding session signals an unattended or looping agent.
max by (session_id, user_email) (
  increase(claude_code_active_time_total_s_total[3h])
)
Fires when any individual session consumes more than 200k tokens in a 1-hour window.
max by (session_id, user_email) (
  increase(claude_code_token_usage_tokens_total[1h])
)
Troubleshoot
The Claude dashboard reports fewer tokens than a custom dashboard built on the same metric.
When you compare token totals between the Claude dashboard and a Custom Dashboards widget built on the same metric, the Code Agents number can come out lower. The Code Agents widgets use PromQL increase() over the visible time range, and for short windows or sparse time series, increase() can skip individual data points, the resulting total ends up smaller than a raw counter sum. For longer time ranges, the two values converge.
If you need an exact counter total, build a Custom Dashboards widget with sum by (cx_application_name) (claude_code_token_usage_tokens_total{}).