Copilot
The Copilot dashboard has five tabs: Overview, Cost, Usage, GitHub Repos, and Users. Every figure is derived from Copilot's own usage data over the time range and filters you've set.
Before the dashboard shows data, set up the integration — see Set up GitHub Copilot.
Overview
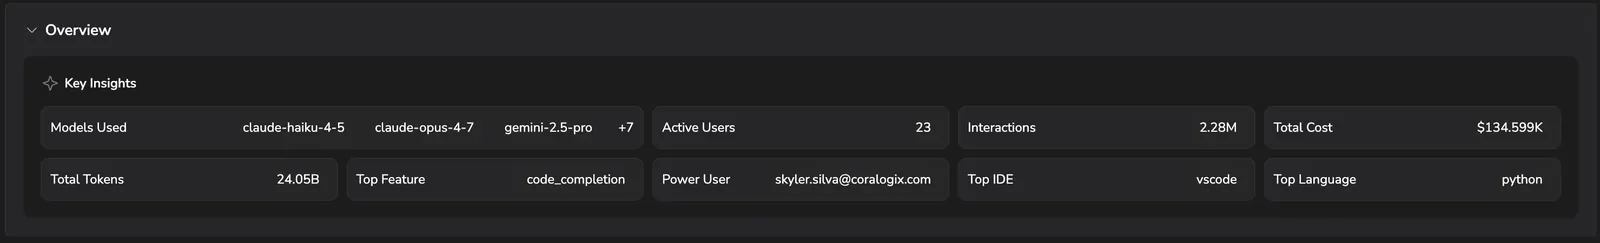
A snapshot of Copilot activity across your org — models in use, active users, interactions, total cost, total tokens, the most-used feature, your power user, the top IDE, and the top programming language.
Cost
Built to answer one question: where is your Copilot spend going, and what's it buying you?
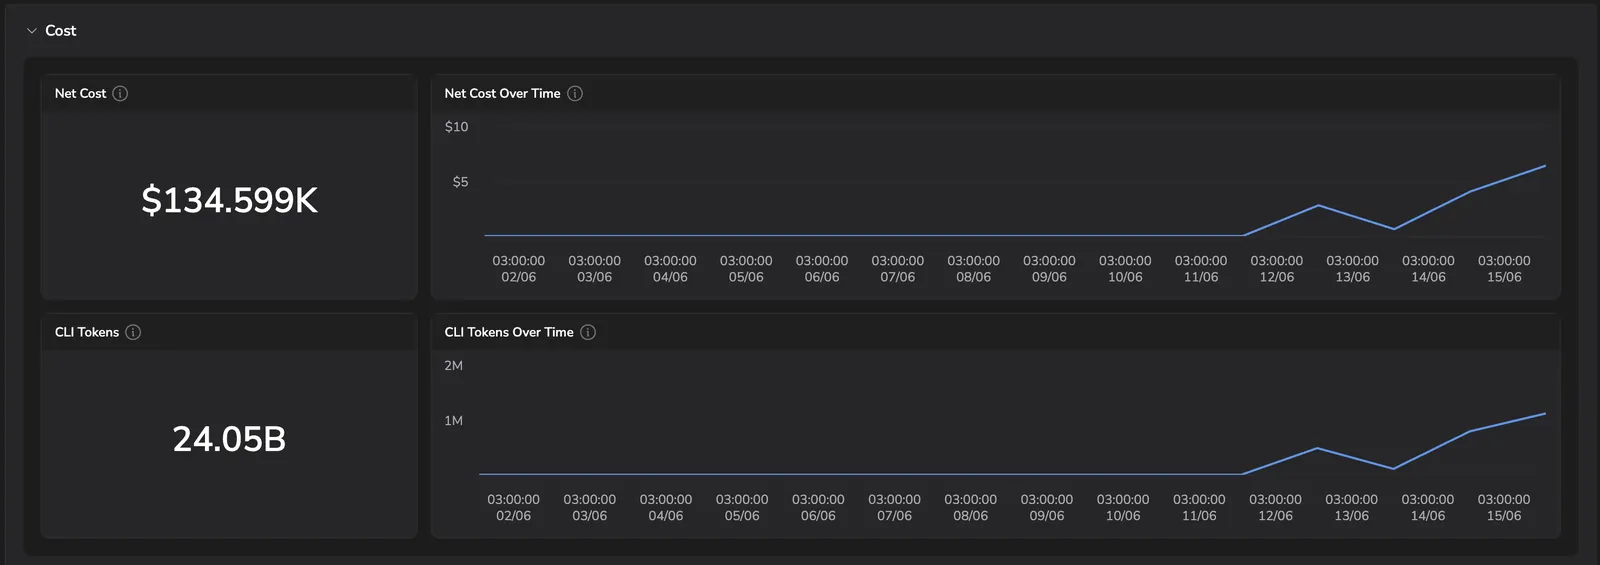
- Net cost and Net cost over time — spend for the period and how it trended day by day.
- CLI tokens and CLI tokens over time — token volume attributed to Copilot CLI usage.
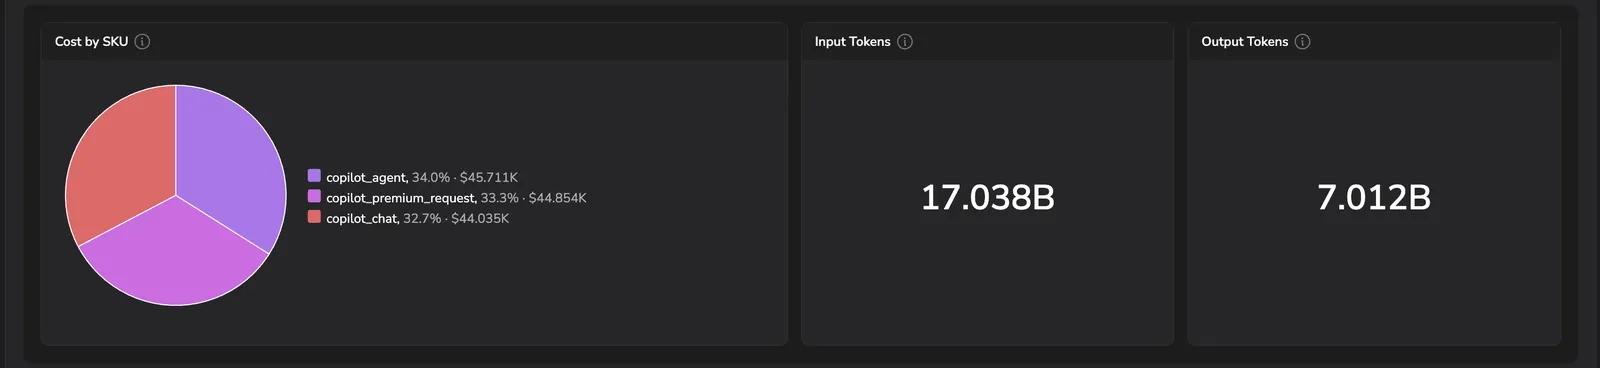
- Cost by SKU — split of spend across Copilot products (agent, premium request, chat).
- Input tokens and Output tokens — totals for the period.
- Optimization insights — ranked, metric-based suggestions for cutting Copilot spend, scanned from your usage data over the selected time range. Each card links to the widget it relates to. For example:
- The most expensive models account for most of your spend.
- A few users account for most of the budget.
- Licensed seats are going unused.
Usage
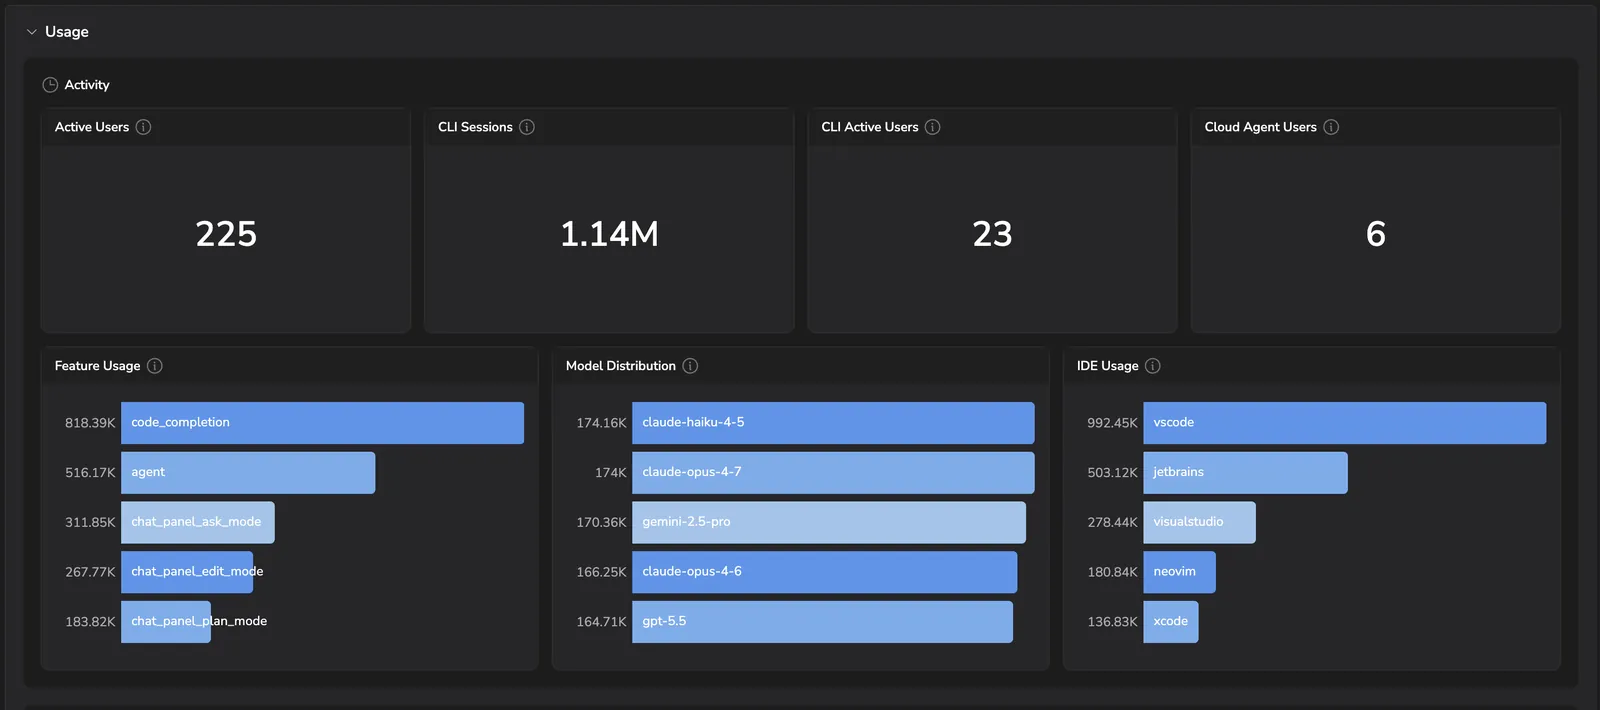
- Activity — active users, CLI sessions, CLI active users, and cloud agent users.
- Feature usage — which Copilot features are driving usage (code completion, agent, chat panel modes).
- Model distribution — which models Copilot is routing to.
- IDE usage — where developers are running Copilot.
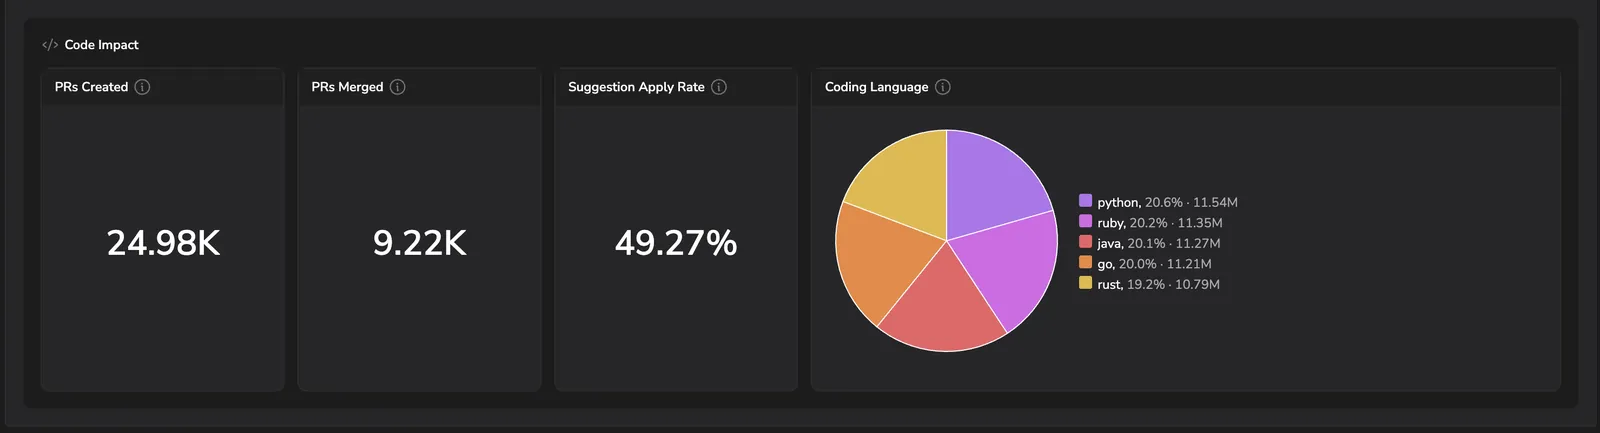
- Code impact — PRs created and merged, the share of Copilot suggestions developers applied, and the languages they applied them in.
GitHub Repos
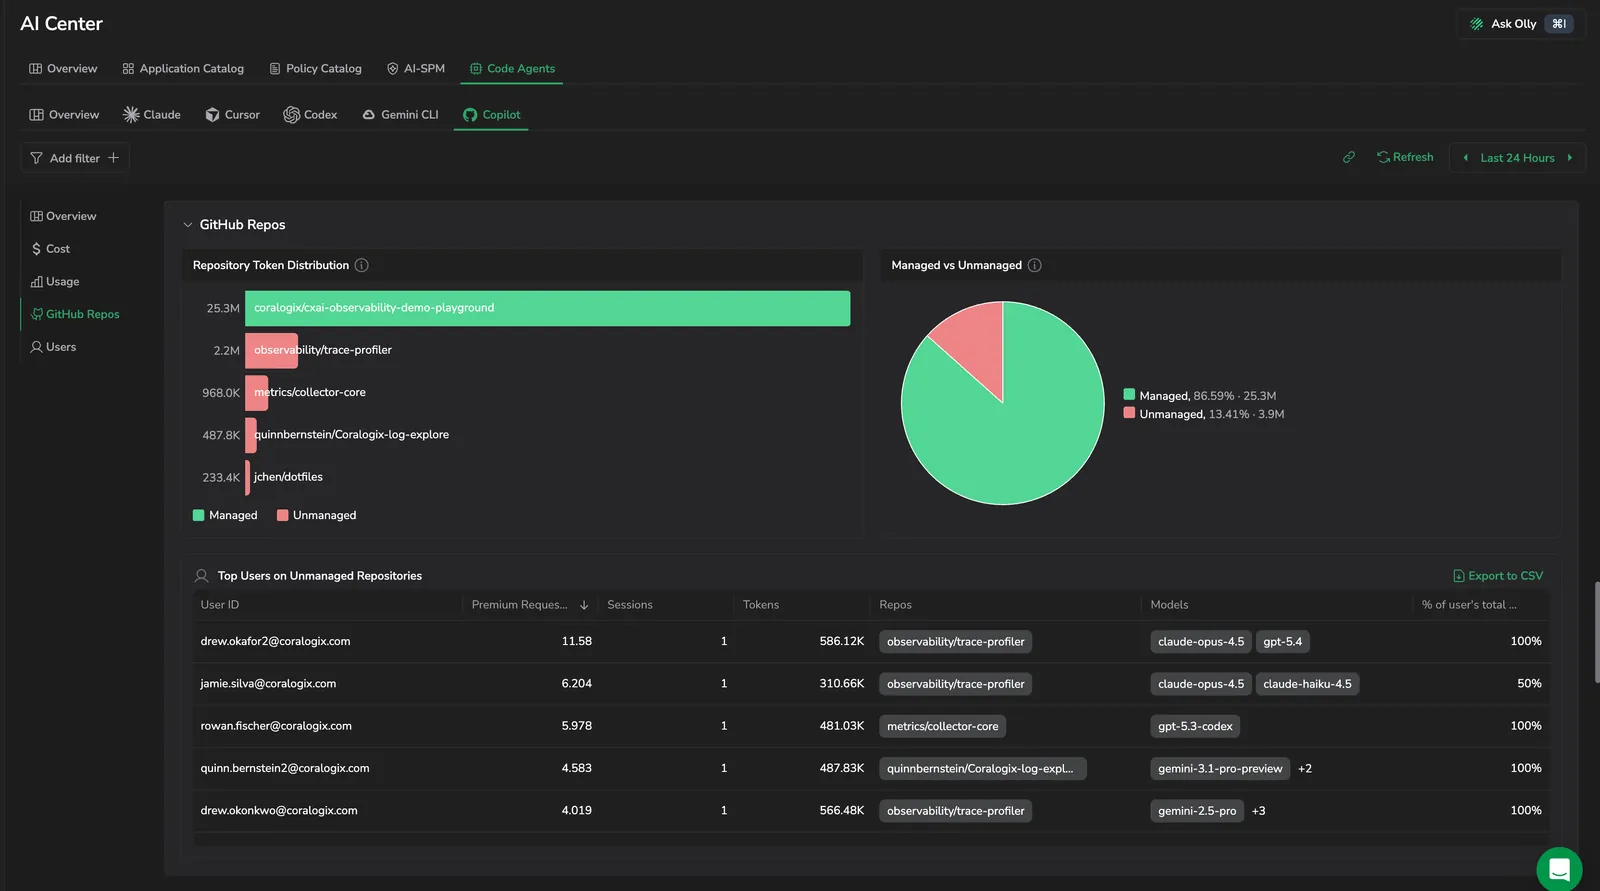
The GitHub Repos tab attributes each Copilot CLI session's token usage to the repository it touched, then splits that activity between Managed repositories — those owned by an Organization you configure in Settings → AI Center → Code agent — and Unmanaged ones: personal projects, external clones, or private work running on the company's Copilot license.
The built-in OpenTelemetry in Copilot CLI reports the repository per session on the github.copilot.git.repository attribute. For how that attribute is read and classified, see Repository breakdown.
Widgets
Repository token distribution
A ranked bar chart of token share by repository, each bar colored Managed (green) or Unmanaged (red).
Managed vs unmanaged
A pie that splits total tokens between Managed repositories (owned by an Organization you configure in Settings → AI Center → Code agent) and Unmanaged ones (owned by no configured Organization). Until you configure an Organization, every repository appears as Unmanaged.
Top users on unmanaged repositories
A ranked table of the users with the most activity on Unmanaged repos. Columns: User ID, Premium Requests, Sessions, Tokens, Repos, Models, and % of the user's total. Export the table to CSV from the top-right.
What you need
- CLI session telemetry (Copilot CLI) — feeds per-session tokens, premium requests, and the
github.copilot.git.repositoryattribute that ties activity to a repository. - Repository Organizations — split attributed activity into Managed and Unmanaged buckets based on the Organizations you configure in Settings → AI Center → Code agent. Until you configure an Organization, every repository appears as Unmanaged.
Users
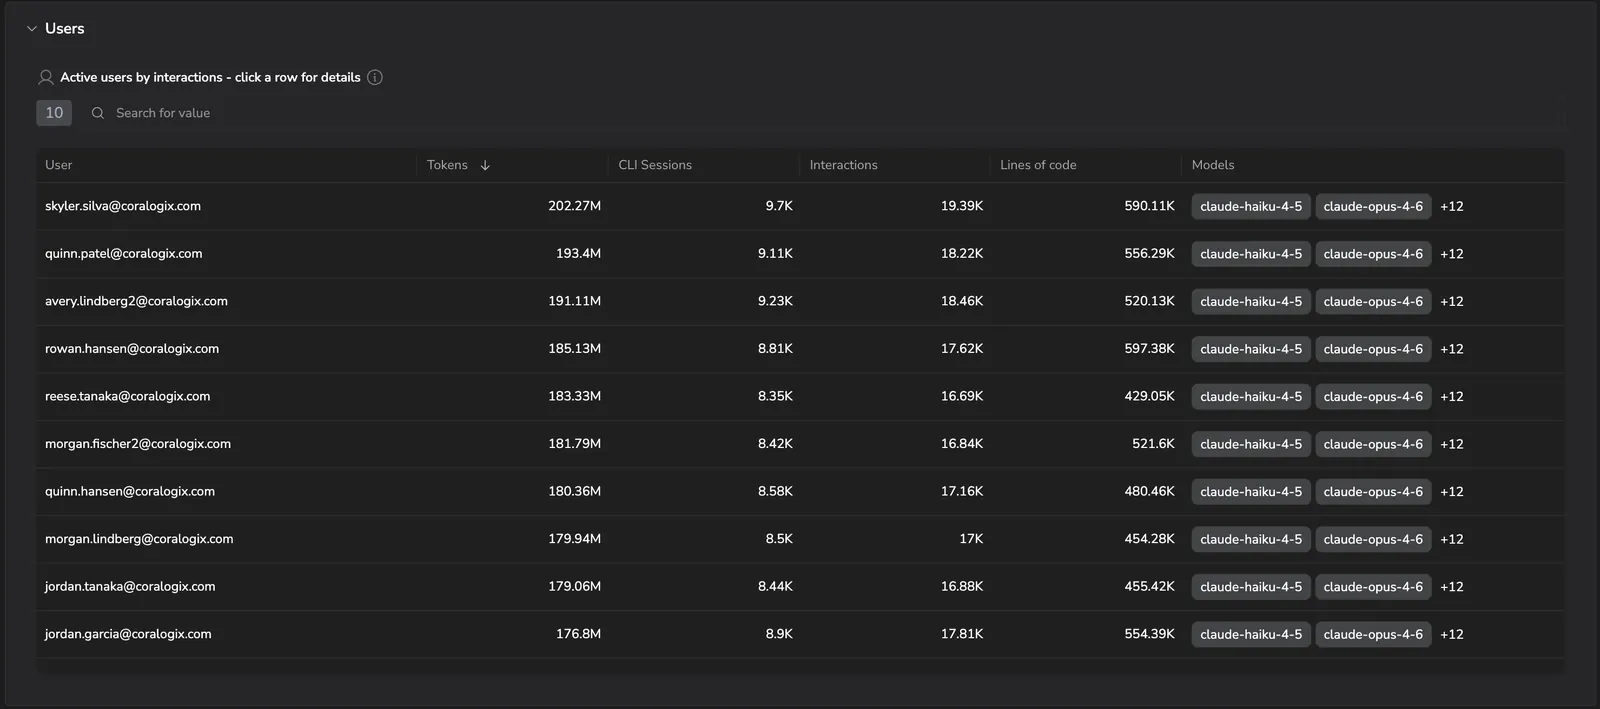
Active users ranked by interactions, with tokens, CLI sessions, lines of code, and models per user. Select any row to drill into that user's session activity and code impact.
Alert examples
Example alerts you can build on Copilot's metrics to catch cost, adoption, and governance issues early. Each one expands to show what it detects and the query to use.
Alerts when one user accounts for more than 60% of total CLI prompt tokens — a sign that heavy automated CLI jobs from one developer are crowding out org capacity.
sum by (user_email) (
  increase(github_copilot_user_cli_prompt_tokens_sum[1h])
)
/ on() group_left() (
  sum(increase(github_copilot_user_cli_prompt_tokens_sum[1h])) + 1
)
Alerts when accepted suggestions as a share of total generated suggestions drops below 20%. Developers are rejecting most of Copilot's output, which can signal prompt-quality or model-alignment issues.
sum(increase(github_copilot_org_code_acceptance_activity_count[24h]))
/ (sum(increase(github_copilot_org_code_generation_activity_count[24h])) + 1)
Alerts when no users are active for the current day — a sign of a complete outage, auth failure, or connectivity issue.
sum(github_copilot_org_daily_active_users{}) == 0
Alerts when billed seats exceed monthly active users by more than 20 (adjustable). Every unused seat is avoidable spend.
sum(github_copilot_billing_net_quantity)
- sum(github_copilot_org_monthly_active_users)
Alerts when Copilot net billing increases more than 30% compared to 7 days ago — a sign of unexpected seat additions or SKU upgrades before the monthly invoice.
sum(github_copilot_billing_net_amount)
/ sum(github_copilot_billing_net_amount offset 7d)
Alerts when a Copilot interaction is recorded against a model that wasn't present over the previous 7 days. The alert surfaces the exact model name so leadership can assess whether it's sanctioned and act accordingly.
count by (model) (
  github_copilot_user_user_initiated_interaction_count_by_model_feature
)
unless
count by (model) (
  github_copilot_user_user_initiated_interaction_count_by_model_feature offset 7d
)