Gemini CLI
The Gemini CLI dashboard has four tabs: Overview, Tokens, Usage, and Users. Every figure is derived from Gemini CLI usage data over the time range and filters you've set.
Before the dashboard shows data, set up the integration — see Connect Gemini CLI.
Overview
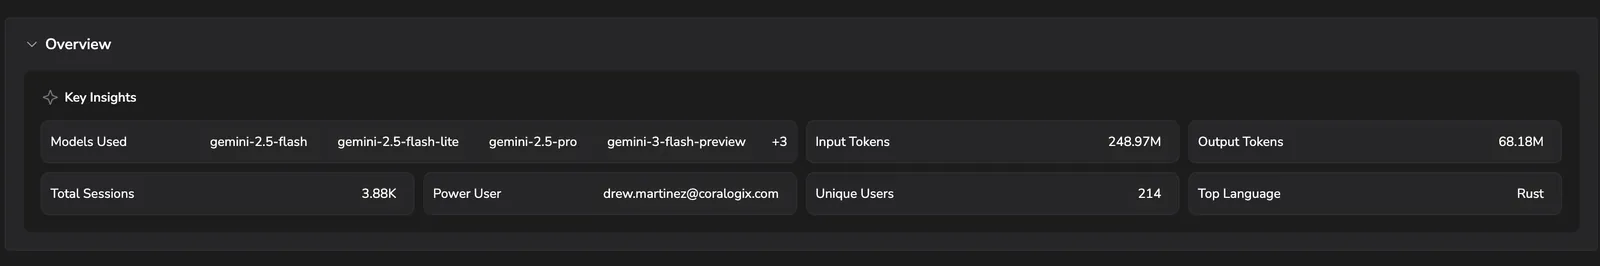
A snapshot of Gemini CLI activity — models in use, input and output tokens, total sessions, your power user, how many unique users were active, and the top programming language Gemini worked on.
Tokens
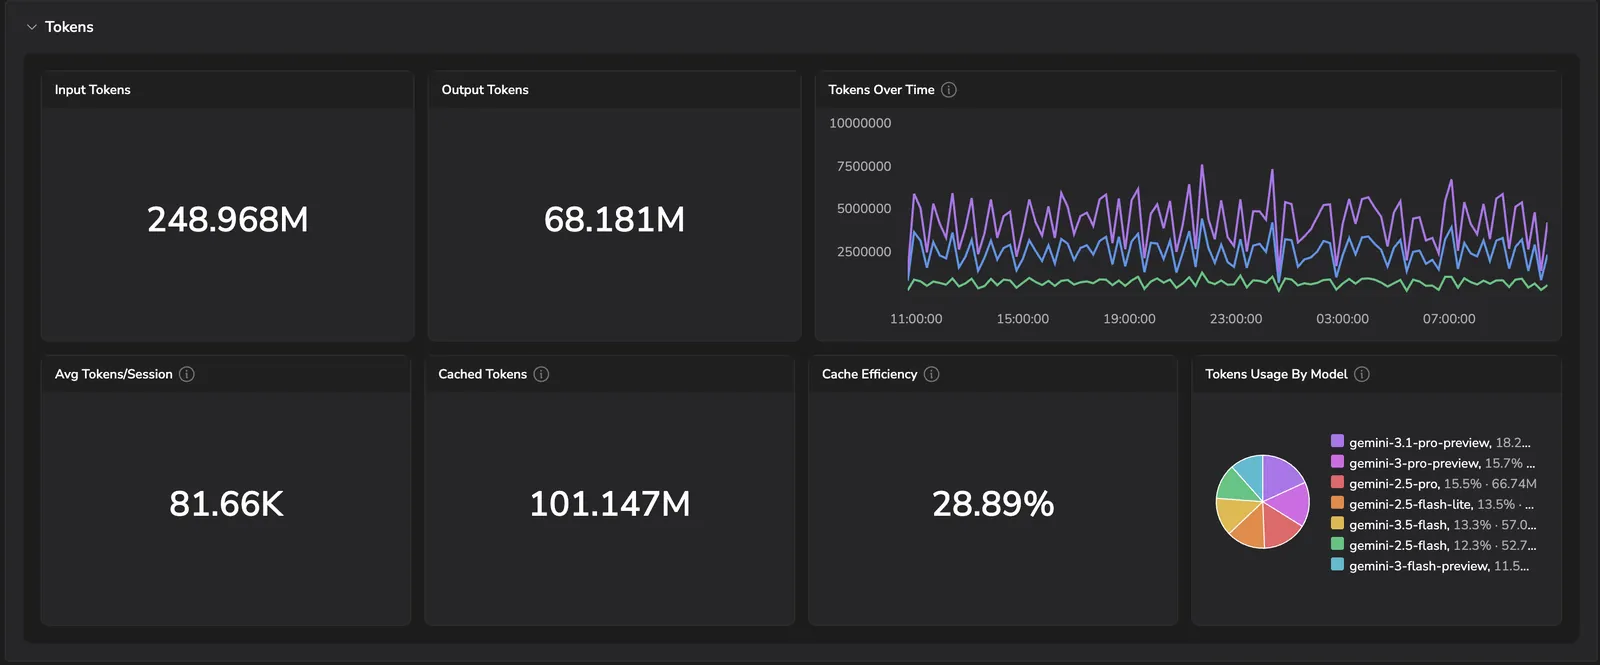
- Input tokens and Output tokens — totals for the period.
- Tokens over time — when token consumption peaked.
- Avg tokens/session — how token-heavy a typical session is.
- Cached tokens and Cache efficiency — how much of your input is served from cache; higher efficiency means lower cost per request.
- Tokens usage by model — token share across the Gemini models you're using.
Usage
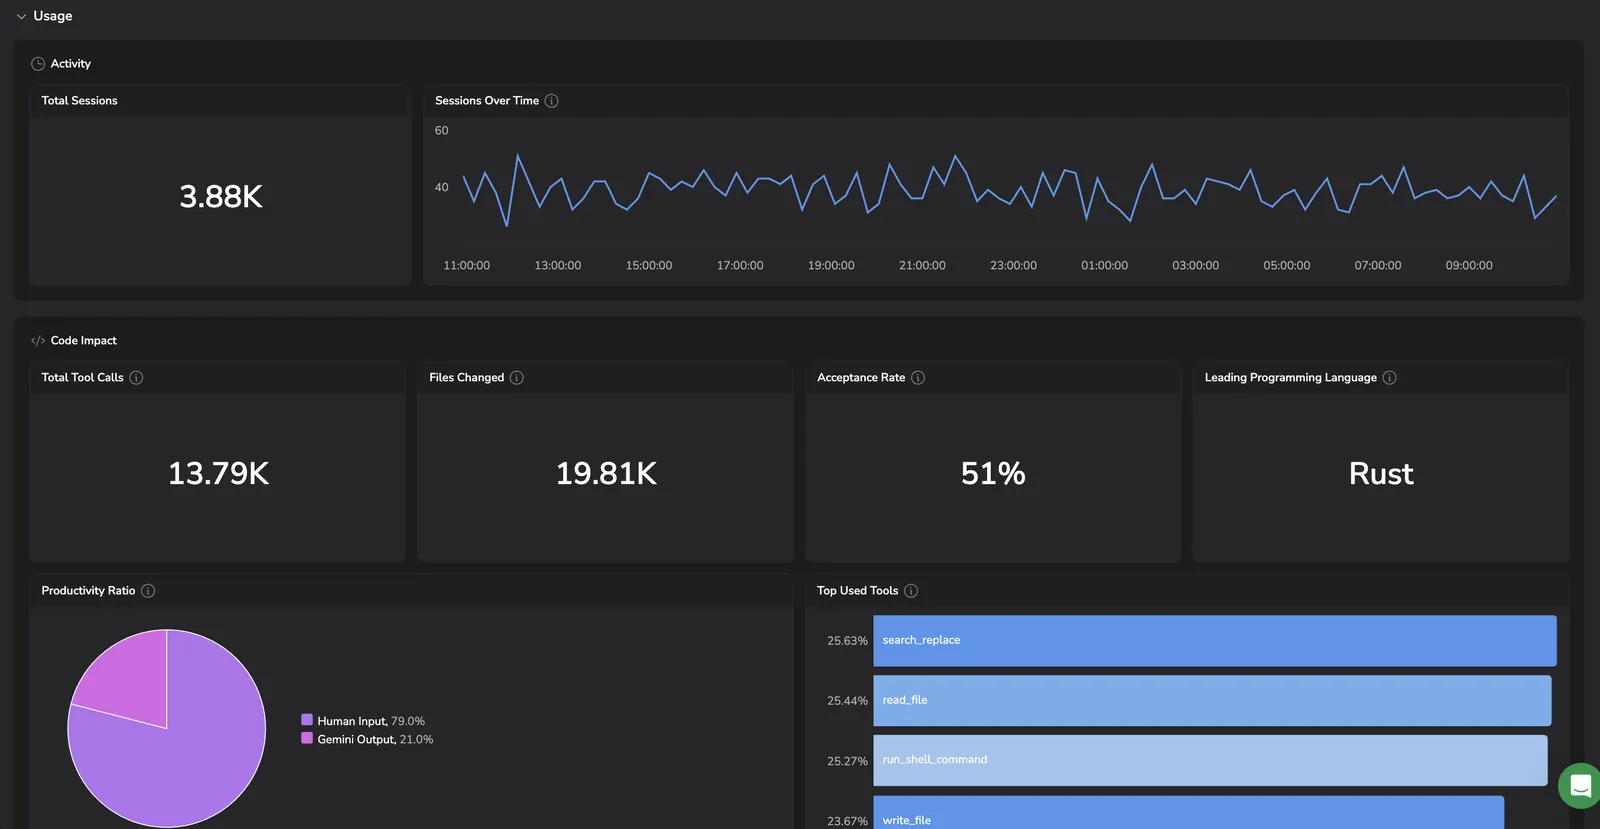
- Activity — total sessions and sessions over time.
- Code impact — total tool calls, files changed, the share of AI suggestions accepted, and the leading programming language.
- Productivity ratio — split of human input vs. Gemini output.
- Top used tools — the tools Gemini invoked most across sessions.
Users
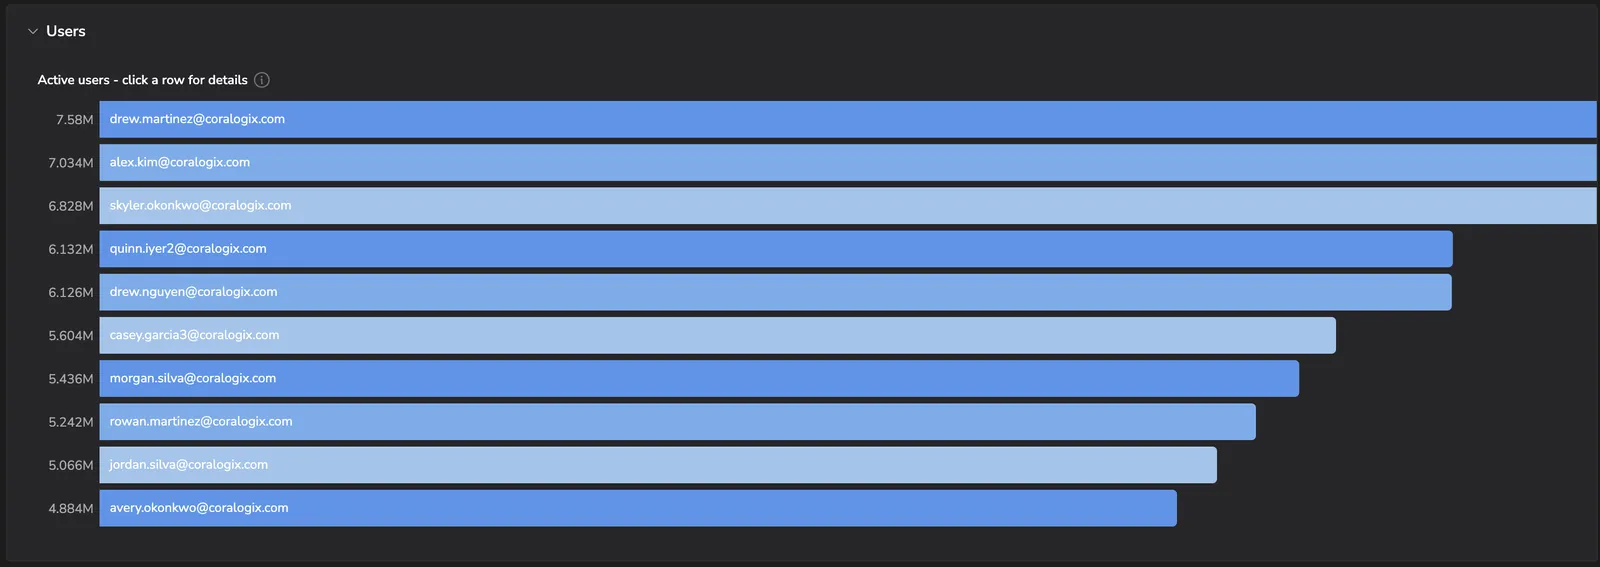
Active users ranked by token consumption. Select any row to drill into that user's session activity, tokens, and code impact.
Theme
Light